National Weather Service United States Department of Commerce

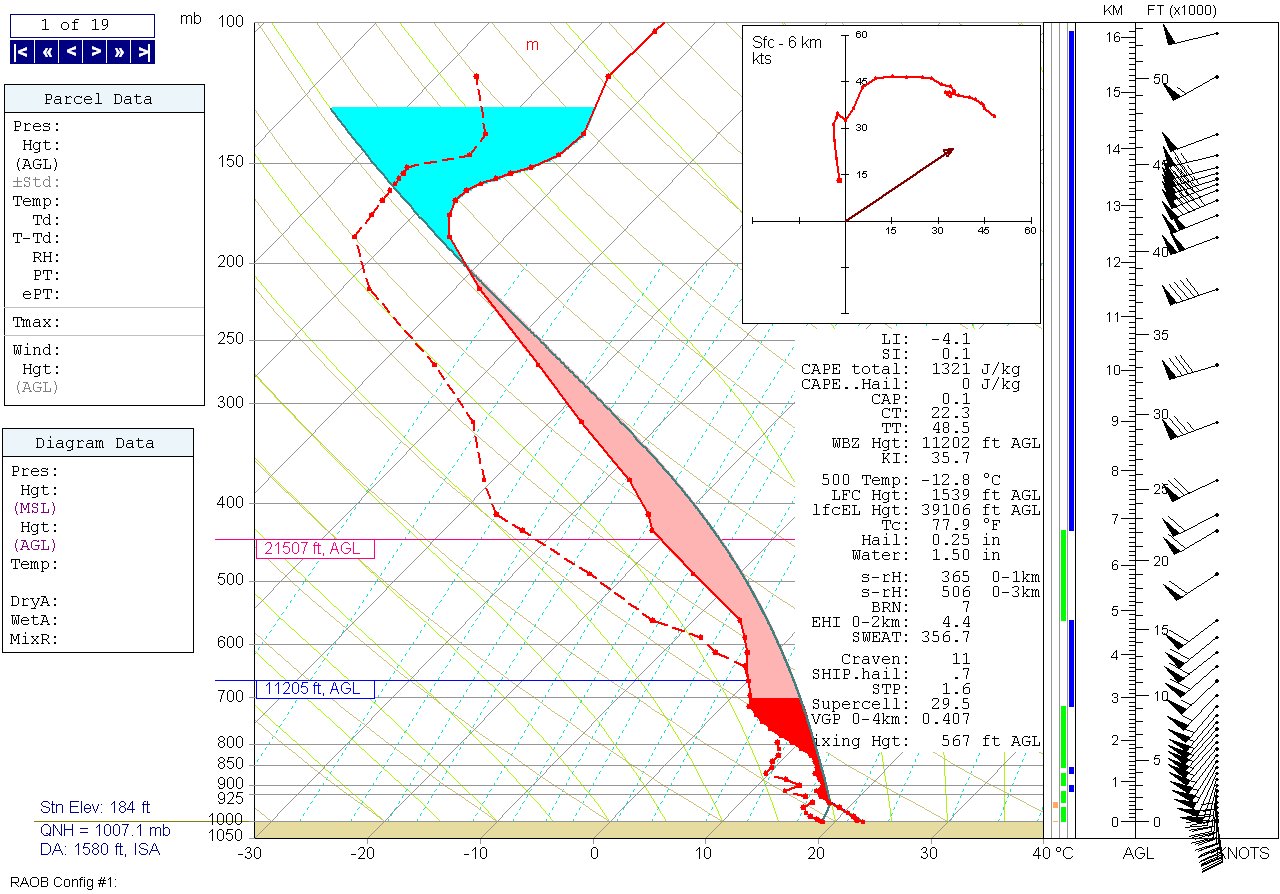
Storm Summary

A line of showers and thunderstorms developed during the morning hours of Saturday April 16, 2011 across the western Midlands moving eastward to near Columbia, SC by noon. The environment ahead of the cold front became extremely unstable by the early afternoon with warm and humid conditions developing due to strong solar heating through breaks in the clouds and southerly winds spreading abundant moisture northward. A strong jet stream aloft also provided high wind shear across the southeast US leading to fast storm motions between 40 and 50 mph. Thunderstorms rapidly developed beginning near 1pm, growing to severe levels within minutes. Severe thunderstorms raced across the eastern Midlands through the afternoon moving east of the forecast area by 5pm. The largest storms produced golf ball to softball sized hail and downed numerous trees and power lines. KCAE doppler radar also picked up on rotation within some of the thunderstorms which lead to the issuance of three tornado warnings and and observed funnel cloud at McEntire Air National Guard base. Severe weather reports were relayed to the National Weather Service by law enforcement, trained storm spotters as well as the public.
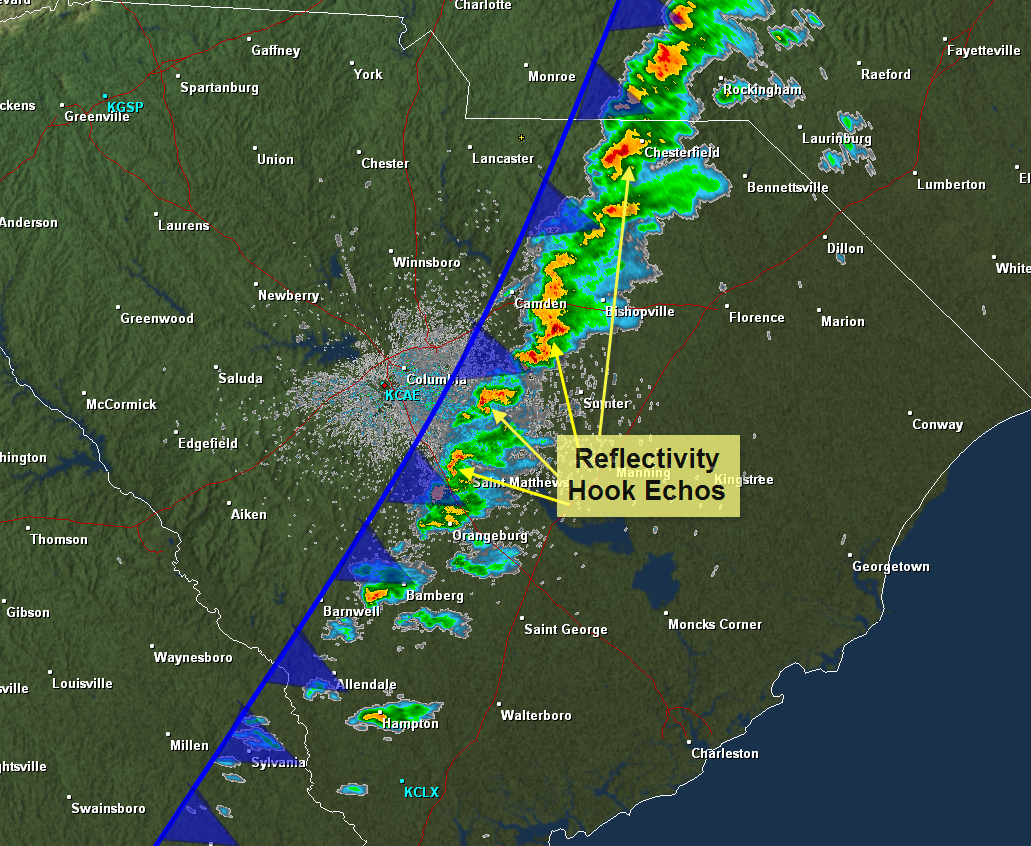
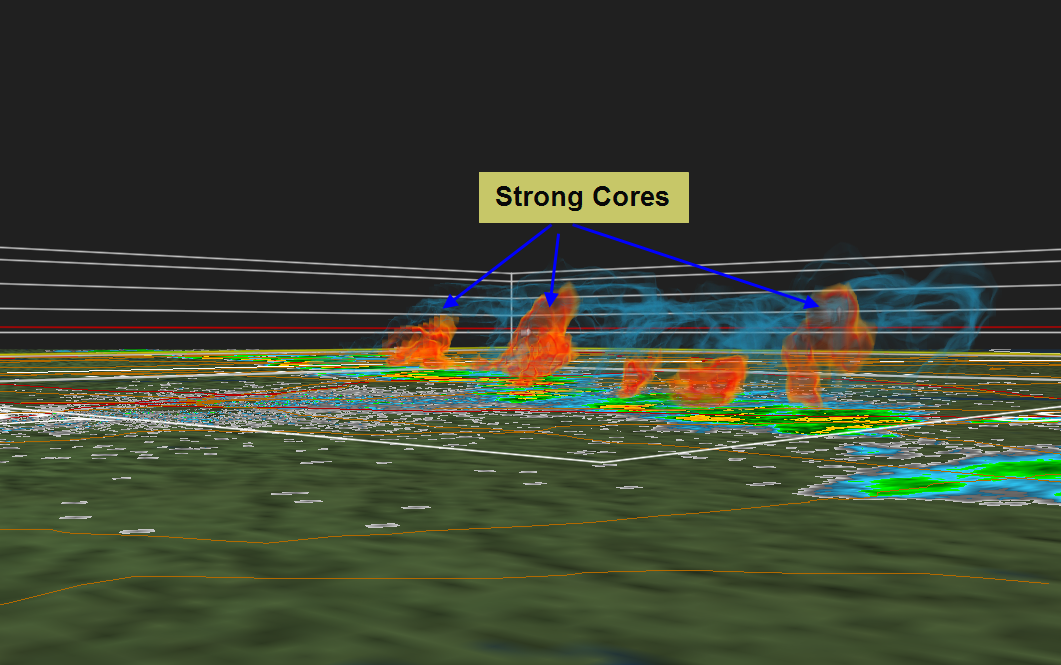
HPC surface analyis from 5pm showing the cold front moving across South Carolina. Notice the warm moist environment east of the cold front and south of the warm front which helped fuel the storms.


RUC model sounding for Columbia, SC from 10am. In this SKEW-T Log-P diagram notice the pink shaded area which highlights the unstable environment aloft and the winds veering and increasing with height...key ingredients for severe thunderstorms with explosive/rotating updrafts.


SPC convective outlook from 1230pm. South Carolina was included in a moderate risk for severe weather including tornadoes, large hail and damaging winds. Eastern North Carolina was highlighted for a high risk. The main difference being the level of instability and wind shear.
 

Loop of 30 minute interval satellite images from 1pm to 5pm showing the severe thunderstorms forming ahead of the cold front. Notice the orange and red colors colors which show the coldest/highest cloud tops. ( -50 to -60 degrees Celsius ).

KCAE Radar Imagery

0.5 degree reflectivity at 2pm showing the line of severe thunderstorms that formed along the cold front. A few reflectivity hooks can be seen which is evidence of the strong wind shear present in the environment.


Reflectivity volume at 2pm looking northeast from near Orangeburg, SC toward Chesterfield, SC. Numerous strong to severe thunderstorms can me seen with refelctivity cores extending up to over 30,000 ft.


Reflectivity volume at 412pm of a supercell thunderstorm located about 10 miles southeast of Manning, SC. This storm produced large hail just northeast of Lake Marion. Notice the intense updraft, overshooting tops and hook echo which lead to the issuance of a tornado warning.

This is a reflectivity volume loop of the storm that moved through near the Manning area around 330 pm. Notice the depth of the high reflectivity core (white and pink to over 40,000 ft) and also the overshooting tops when the updraft intensifies (light blue color).

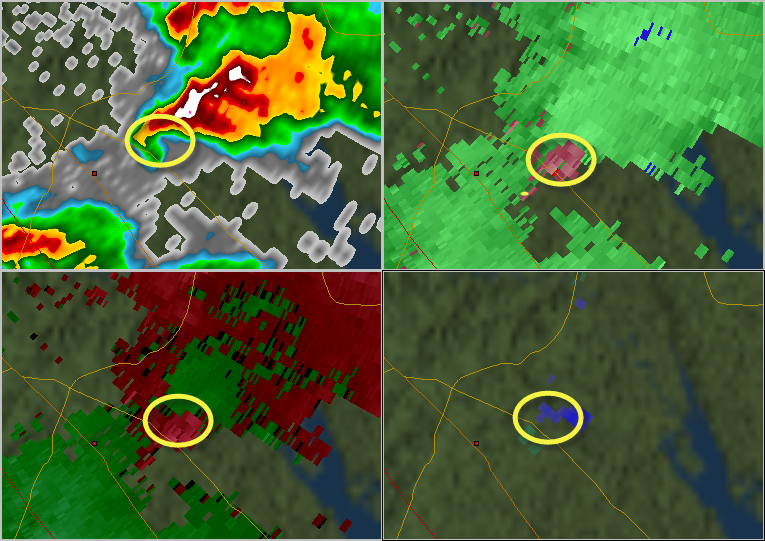
Funnel Cloud Observation

At 2:22pm a weather observer at McEntire Air National Guard Base (15 miles southeast of Columbia, SC) reported seeing a funnel cloud 9 miles southeast of the base moving northeastward. Below is the coded weather report and a 4-panel KCAE doppler radar image of the observed funnel cloud..

SPECI KMMT 161822Z COR 26012KT 10SM +FC FEW039 21/18 RMK A02A TORNADO 9 SE MOV NE SLP050 COR 1831
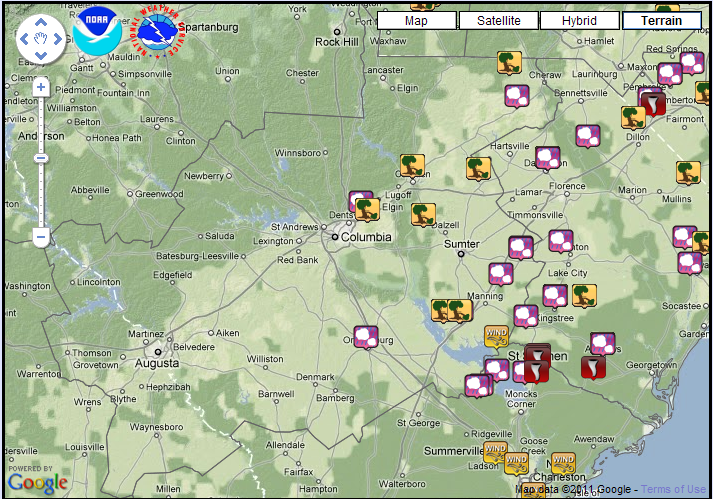
1.9 deg Reflectivity and a hook echo (upper left ), 1.9 deg Base Velocity (lower left), 1.9 deg Storm Relative Velocity (upper right) and 1.9 deg Normalized Rotation (lower right) associated with the observed funnel cloud St. Matthews, SC at 221pm. Max rotational velocity was calculated to be around 19 knots which is consider weak elevated roatation.

Storm Reports


Click on the image to see a larger view and be able to click on icons to view the reports.


Storm Photos

Send in your Storm Photos to caewx@noaa.gov and we will post some of them on this page!