| Climate/Almanac Data - Jan Normals - Jan Records |
| |
| JANUARY |
| |
|
Site (Click site name for report)
|
Avg
Temp |
Norm
1991-2020 |
Dept
From
Norm |
Precip
Total |
Norm
1991-2020 |
Dept
From
Norm |
Snow
Total |
Norm
1991-2020 |
Dept
From
Norm |
| Burlington |
30.5° |
24.3° |
+6.2° |
1.77" |
1.45" |
+0.32" |
NA |
NA |
NA |
| Cedar Rapids |
25.0° |
19.6° |
+5.4° |
1.42" |
0.95" |
+0.47" |
NA |
NA |
NA |
| Davenport |
28.4° |
21.9° |
+6.5° |
1.80" |
1.14" |
+0.66" |
7.2" |
NA |
NA |
| Dubuque |
25.3° |
18.8° |
+6.5° |
2.38" |
1.32" |
+1.06" |
9.6" |
10.7" |
-1.1" |
| Iowa City |
27.7° |
22.8° |
+4.9° |
1.56" |
1.04" |
+0.52" |
NA |
NA |
NA |
| Moline |
30.9°(9) |
23.3° |
+7.6° |
2.17" |
1.66" |
+0.51" |
5.7" |
10.8" |
-5.1" |
|
| The ranking is listed in parentheses (__) when within the "Top 10". |
| |
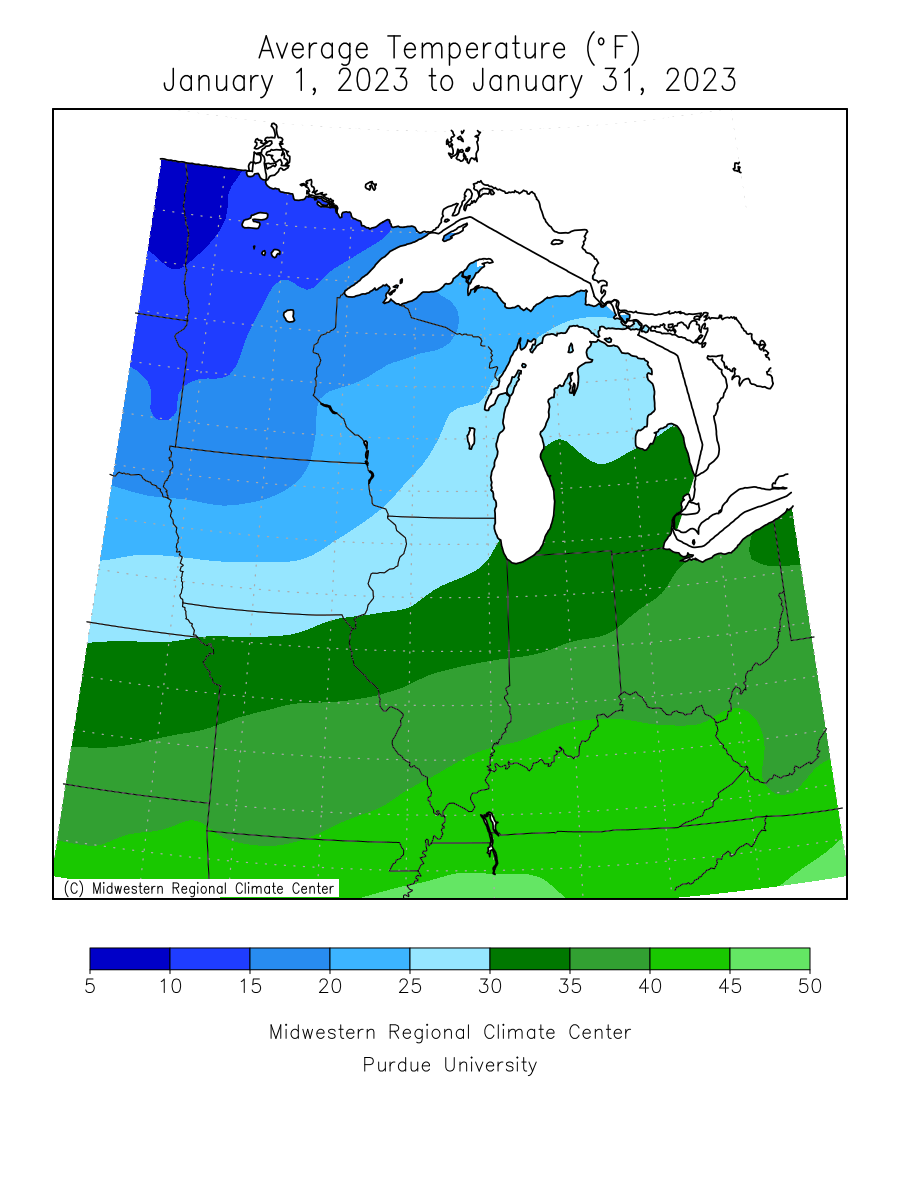
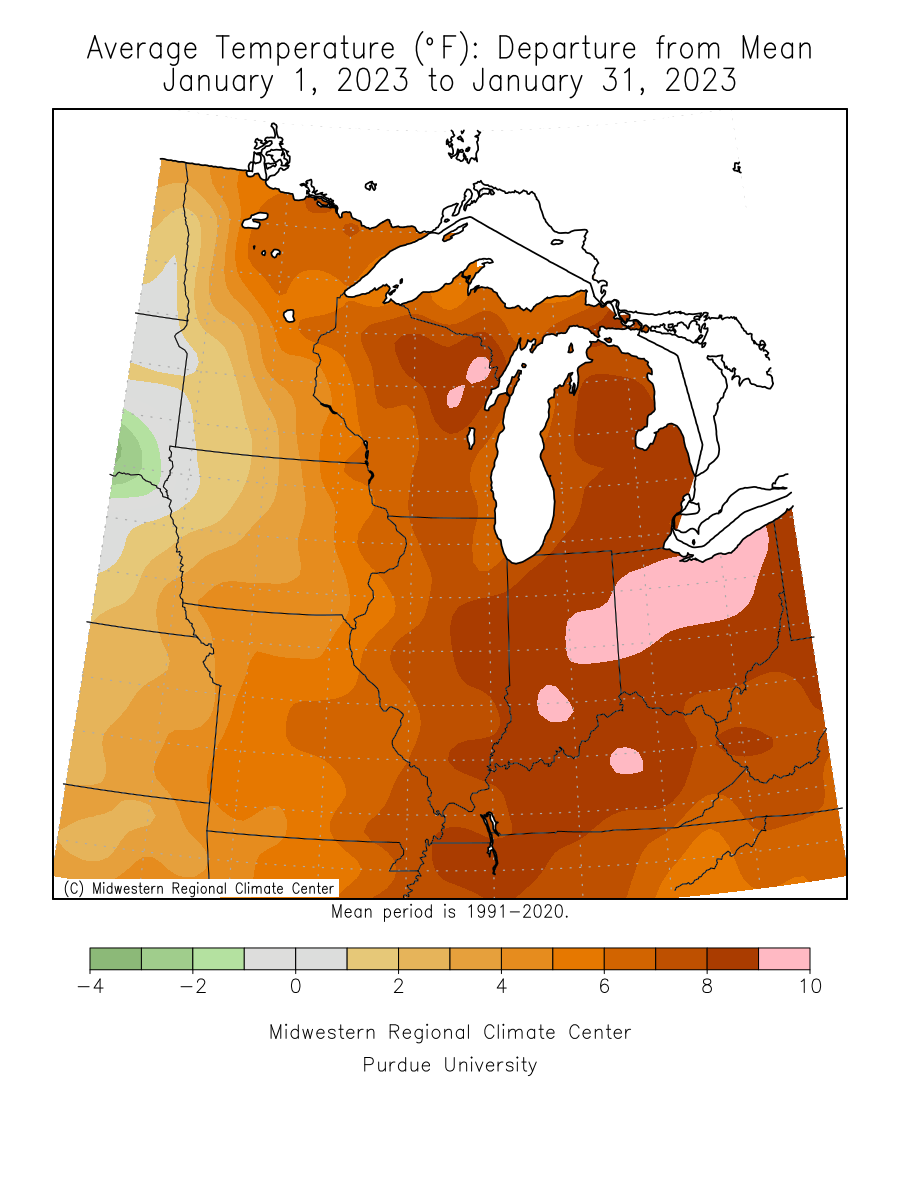
- January 2023 was about 5 to 7.5 degrees above normal. It was the ninth warmest January in Moline!
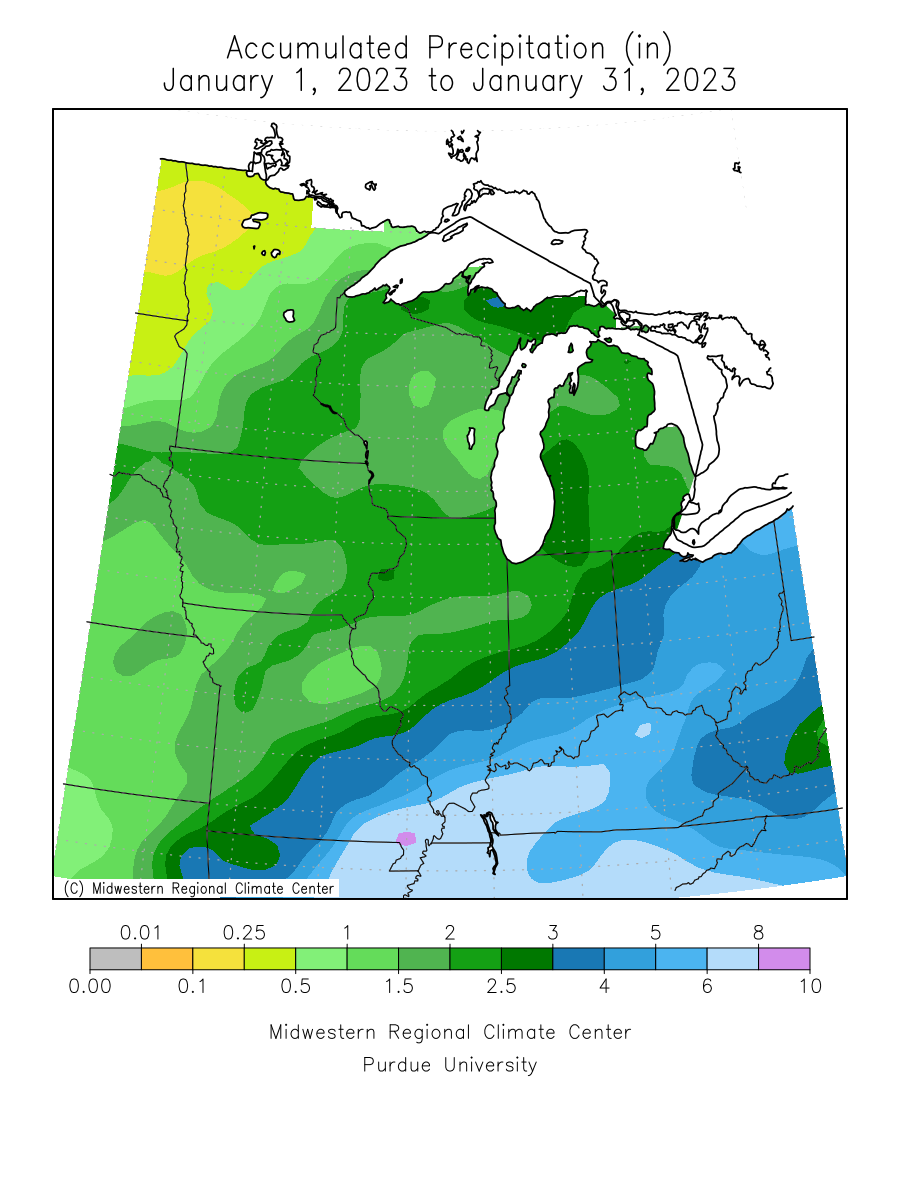
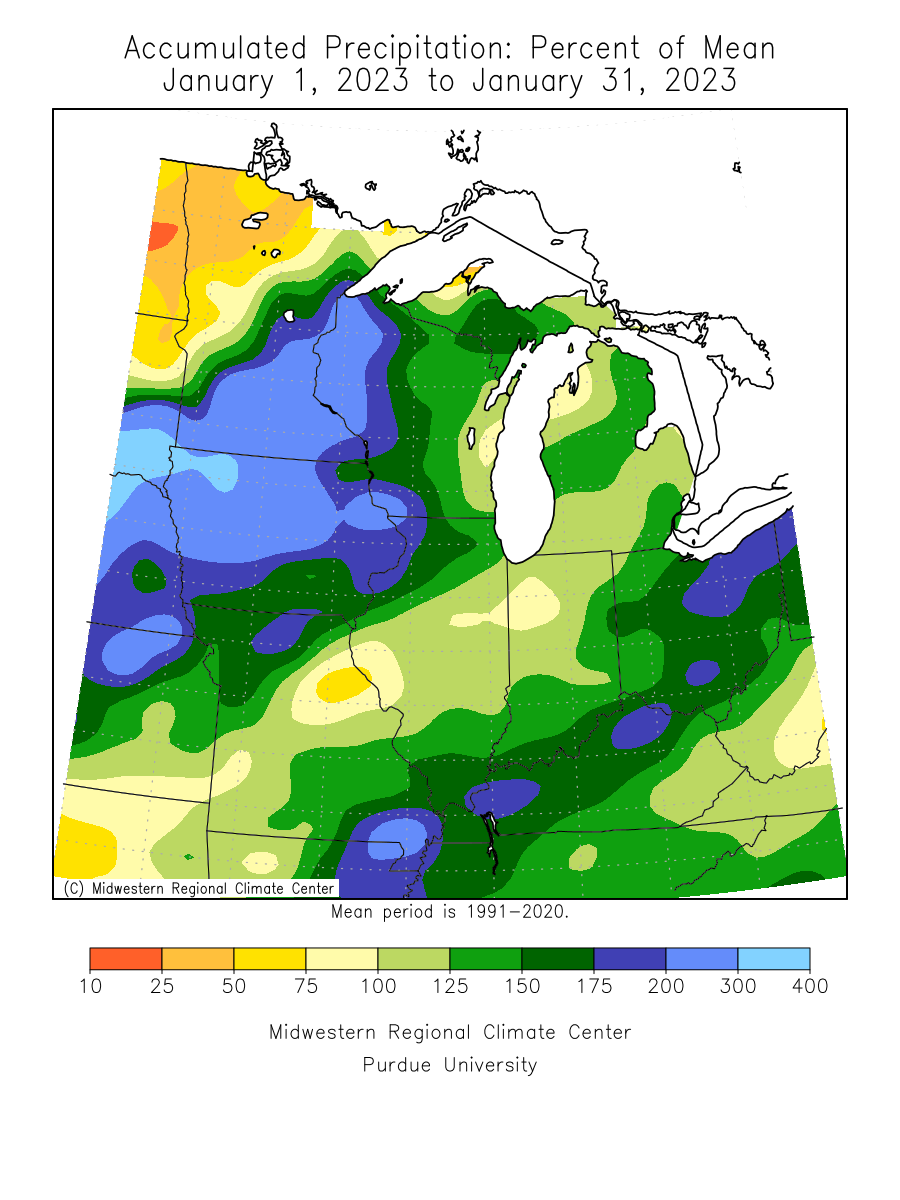
- Precipitation totals were about 1/3 to 1 inch above normal.
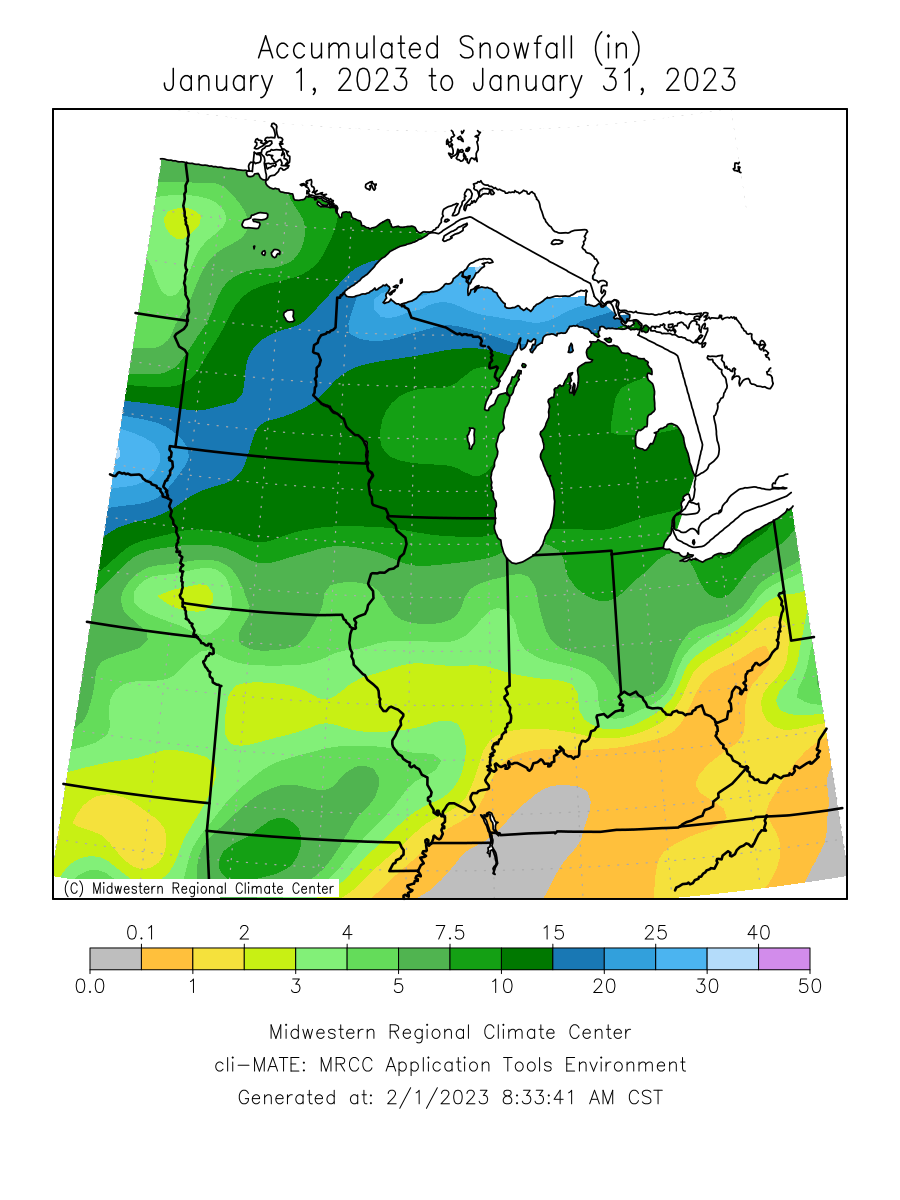
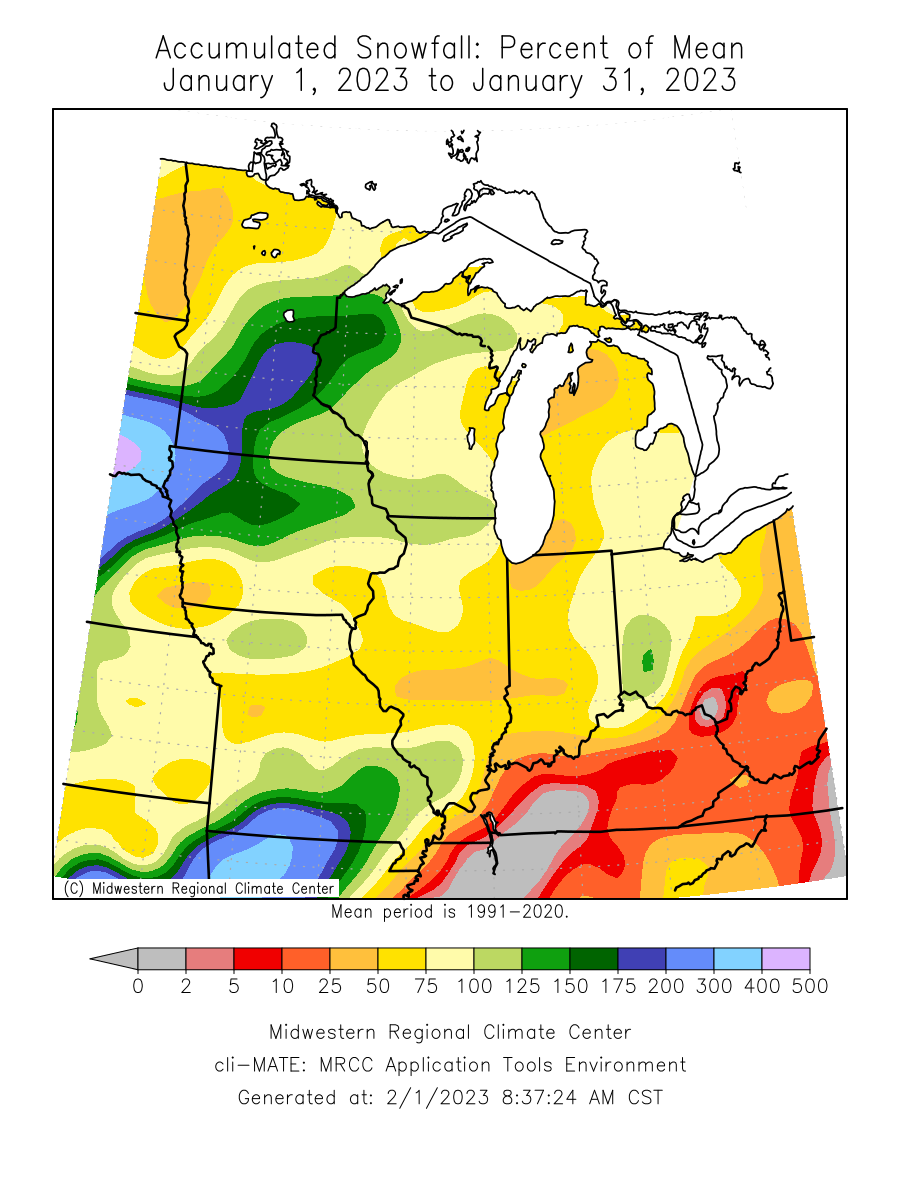
- Snowfall totals were about 1 to 5 inches below normal.
|
| Please see Jan Records for monthly record information. |
| |
| |
| The climate maps below are courtesy of the Midwest Regional Climate Center. |
| These maps become available around 10:30am on the first of the month. |
| |
|
|
|
|
|
Average
Temperature |
Average
Temperature
Departure from Mean |
Accumulated
Precipitation |
Accumulated
Precipitation
Percent of Mean |
Accumulated
Snowfall |
Accumulated
Snowfall
Percent of Mean |
 |
 |
 |
 |
 |
 |
|
| |
| |
| A LOOK AHEAD |
| |
| For more information on the Climate Outlooks, see the Climate Prediction Center. |
| |
February
Temperature Outlook |
February
Precipitation Outlook |
February - April
Temperature Outlook |
February - April
Precipitation Outlook |
 |
 |
 |
 |
|
| |
| |
| |
| |
| |

