| Climate/Almanac Data - JUL Normals - JUL Records |
| |
| JULY |
| |
|
Site (Click site name for report)
|
Average
Temperature |
Normal
1991-2020 |
Departure
From
Normal |
Precipitation
Total |
Normal
1991-2020 |
Departure
From
Normal |
| Burlington |
74.8° |
75.6° |
-0.8° |
2.26" |
4.02" |
-1.76" |
| Cedar Rapids |
73.3° |
72.8° |
+0.5° |
3.77" |
4.41" |
-0.64" |
| Davenport |
73.4° |
73.7° |
-0.3° |
4.26" |
4.07" |
+0.19" |
| Dubuque |
72.8° |
71.7° |
+1.1° |
4.91" |
4.80" |
+0.11" |
| Iowa City |
75.7° |
75.8° |
-0.1° |
3.78" |
3.91" |
-0.13" |
| Moline |
75.5° |
75.5° |
0.0° |
2.88" |
4.23" |
-1.35" |
|
| The ranking is listed in parentheses (__) when within the "Top 10". |
| |
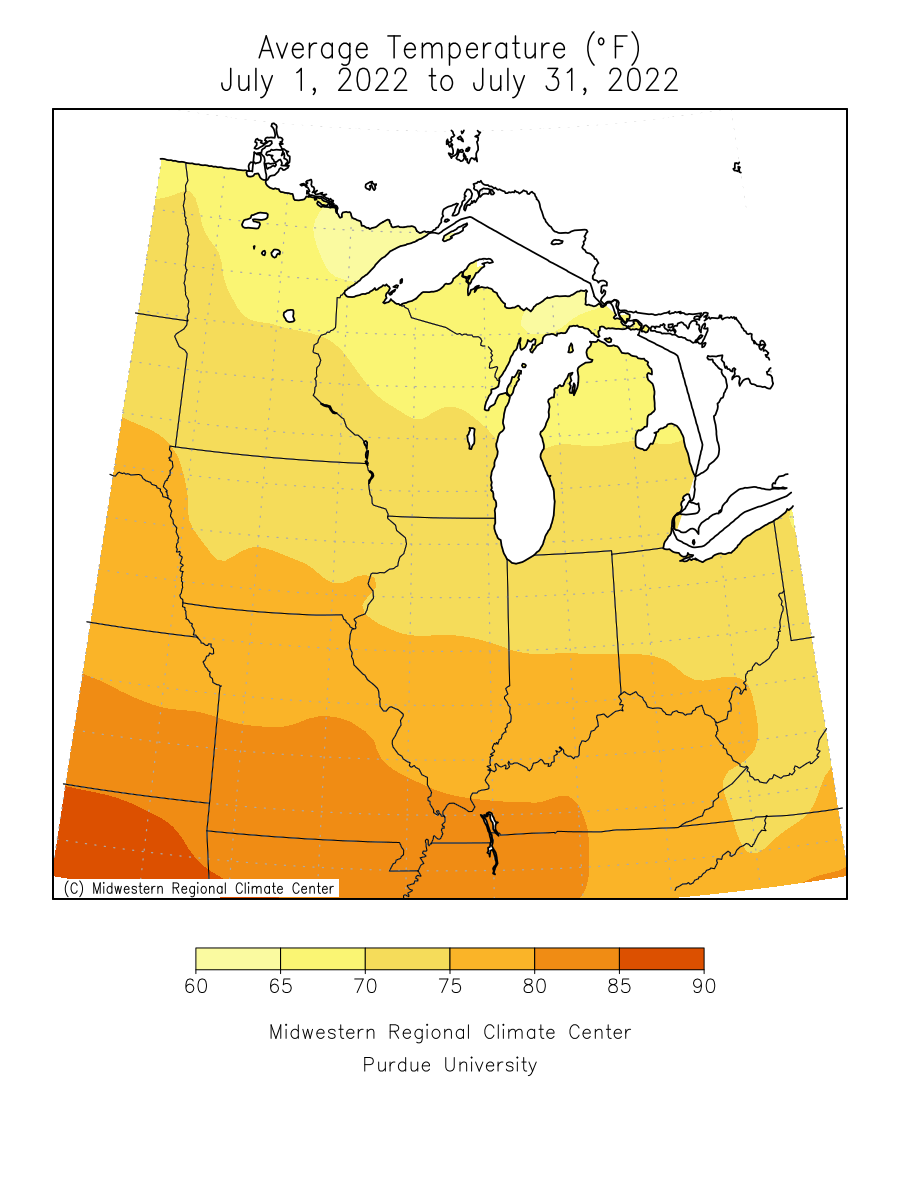
| July 2022 was about 1 degree below normal at Burlington to about 1 degree above normal at Dubuque. |
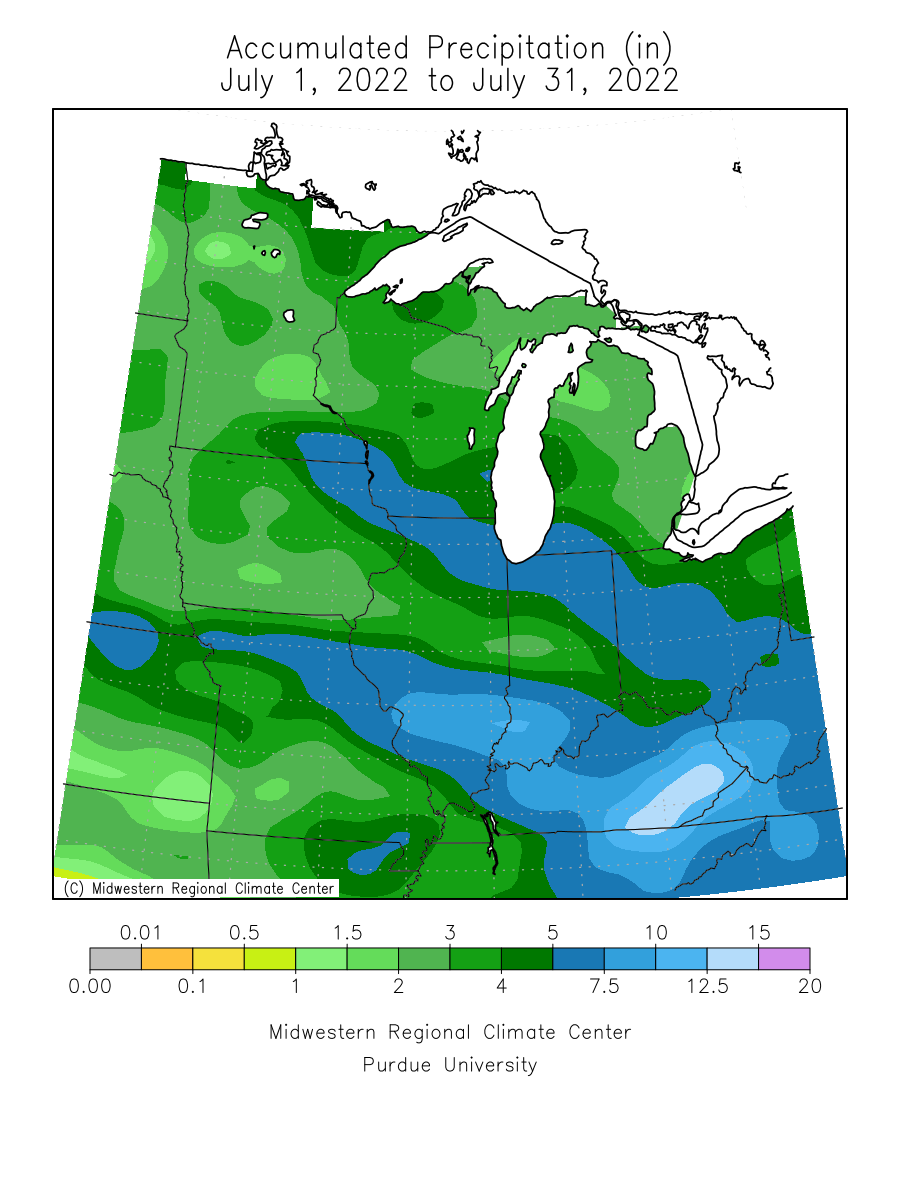
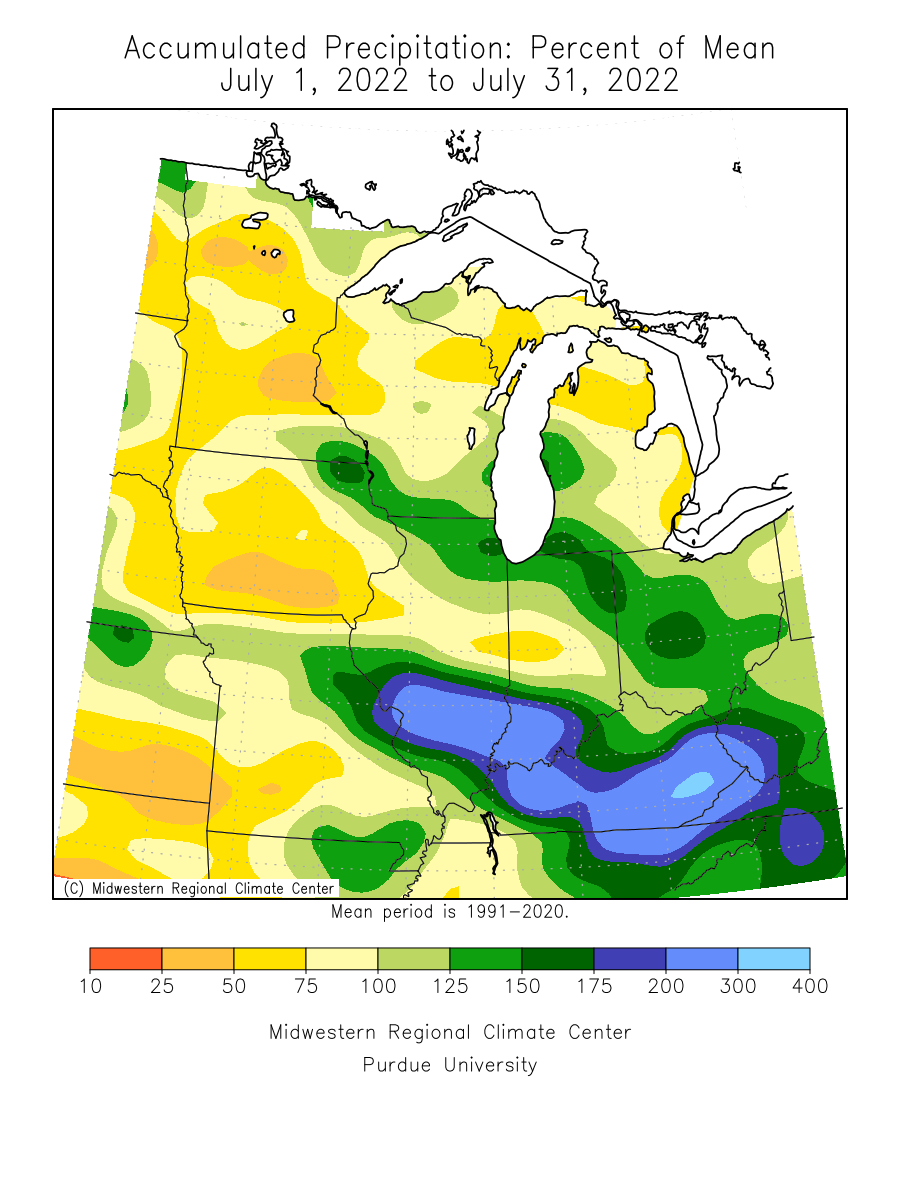
| Precipitation totals for July 2022 were about normal to near 1 3/4 inches below normal. |
| Please see JUL Records for monthly record information. |
| |
| |
| The climate maps below are courtesy of the Midwest Regional Climate Center. |
| These maps become available around 10 am on the first of the month. |
| |
|
|
|
Average
Temperature |
Average
Temperature
Departure from Mean |
Accumulated
Precipitation |
Accumulated
Precipitation
Percent of Mean |
 |
 |
 |
 |
|
| |
| |
| |
| A LOOK AHEAD |
| |
| Climate Prediction Center |
| |
August
Temperature Outlook |
August
Precipitation Outlook |
August - October
Temperature Outlook |
August - October
Precipitation Outlook |
 |
 |
 |
 |
|
| |
| |
| |
| |
| |

