| Climate/Almanac Data - Dec Normals - Dec Records |
| |
| December |
| |
|
Site
(Click site name for report)
|
Avg
Temp |
Normal
1991-2020 |
Dept
From
Norm |
Precip
Total |
Normal
1991-2020 |
Dept
From
Norm |
Snowfall
Total |
Normal
1991-2020 |
Dept
From
Norm |
| Burlington |
xx.x° |
29.9° |
+x.x° |
1.62" |
1.87" |
-0.25" |
NA |
NA |
NA |
| Cedar Rapids |
xx.x° |
25.2° |
+x.x° |
1.48" |
1.59" |
-0.11" |
NA |
NA |
NA |
| Davenport |
xx.x° |
27.6° |
+x.x° |
1.29" |
1.64" |
-0.35" |
1.2" |
NA |
NA |
| Dubuque |
xx.x° |
24.5° |
+x.x° |
1.47" |
1.80" |
-0.33" |
4.1" |
10.3" |
-6.2" |
| Iowa City |
xx.x° |
28.2° |
+x.x° |
1.84" |
1.45" |
+0.39" |
NA |
NA |
NA |
| Moline |
xx.x° |
28.9° |
+x.x° |
1.65" |
2.04" |
-0.39" |
1.3" |
8.8" |
-7.5" |
|
| The ranking is listed in parentheses (__) when within the "Top 10". |
| |
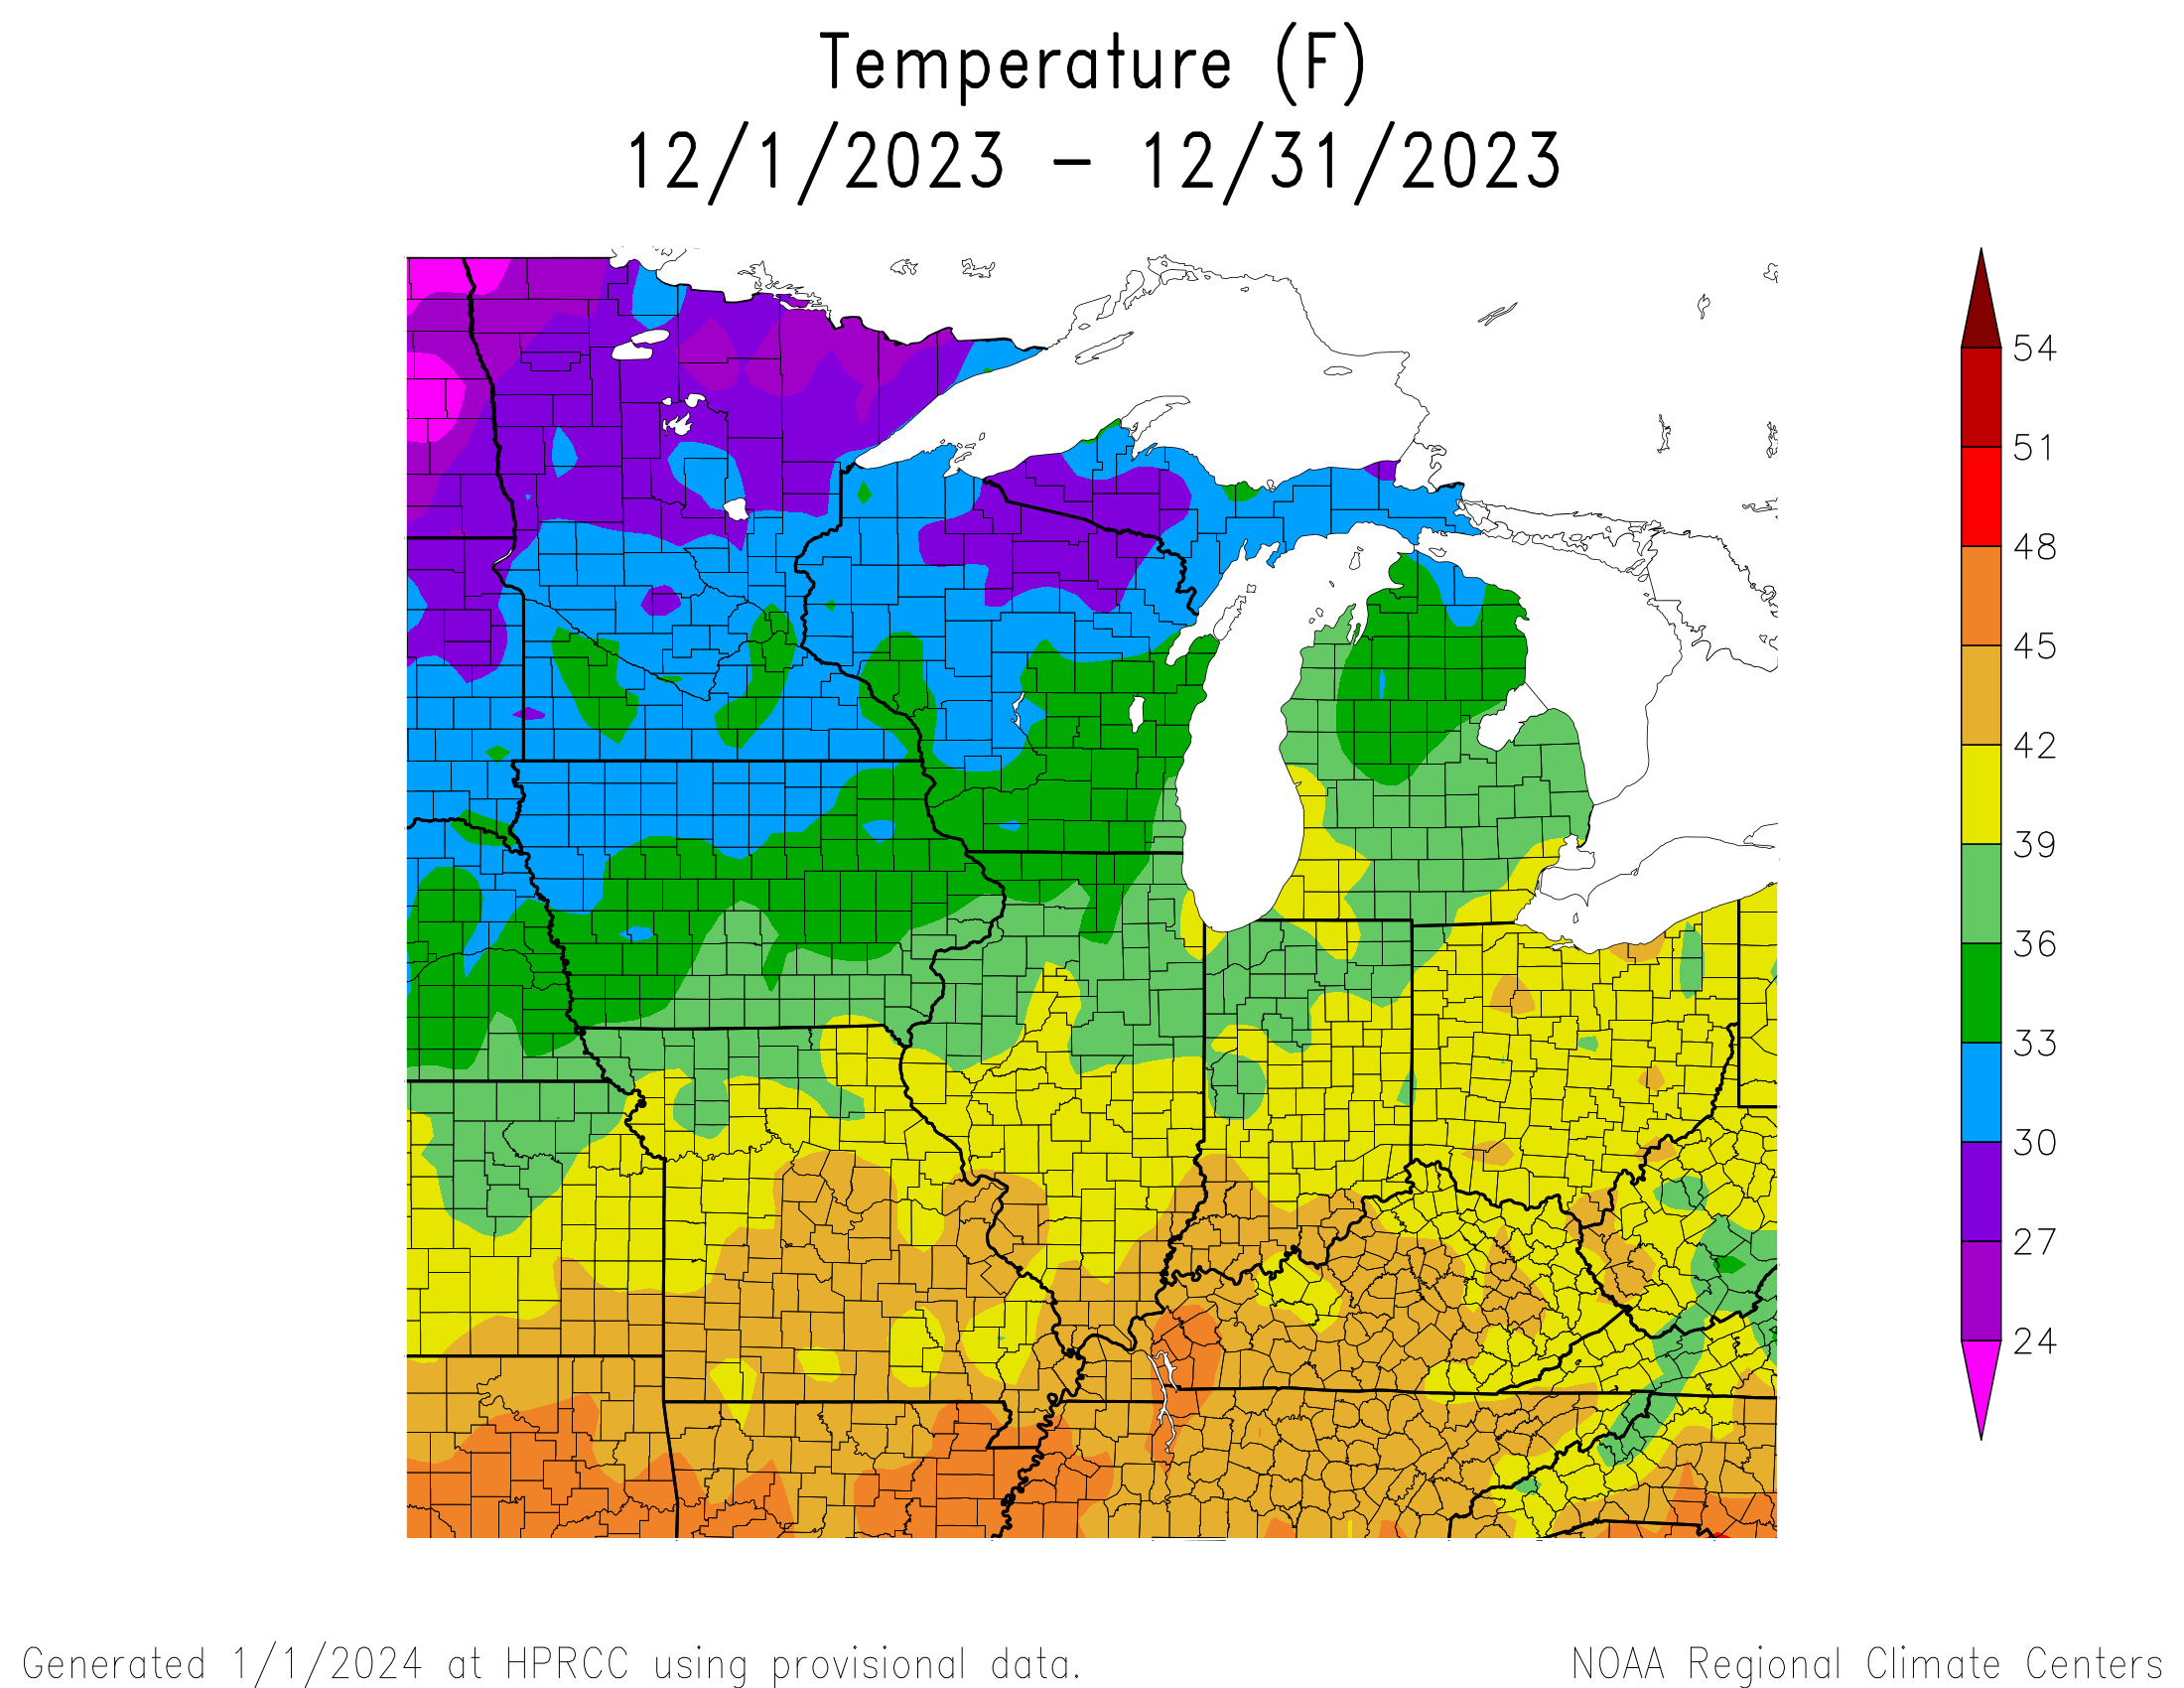
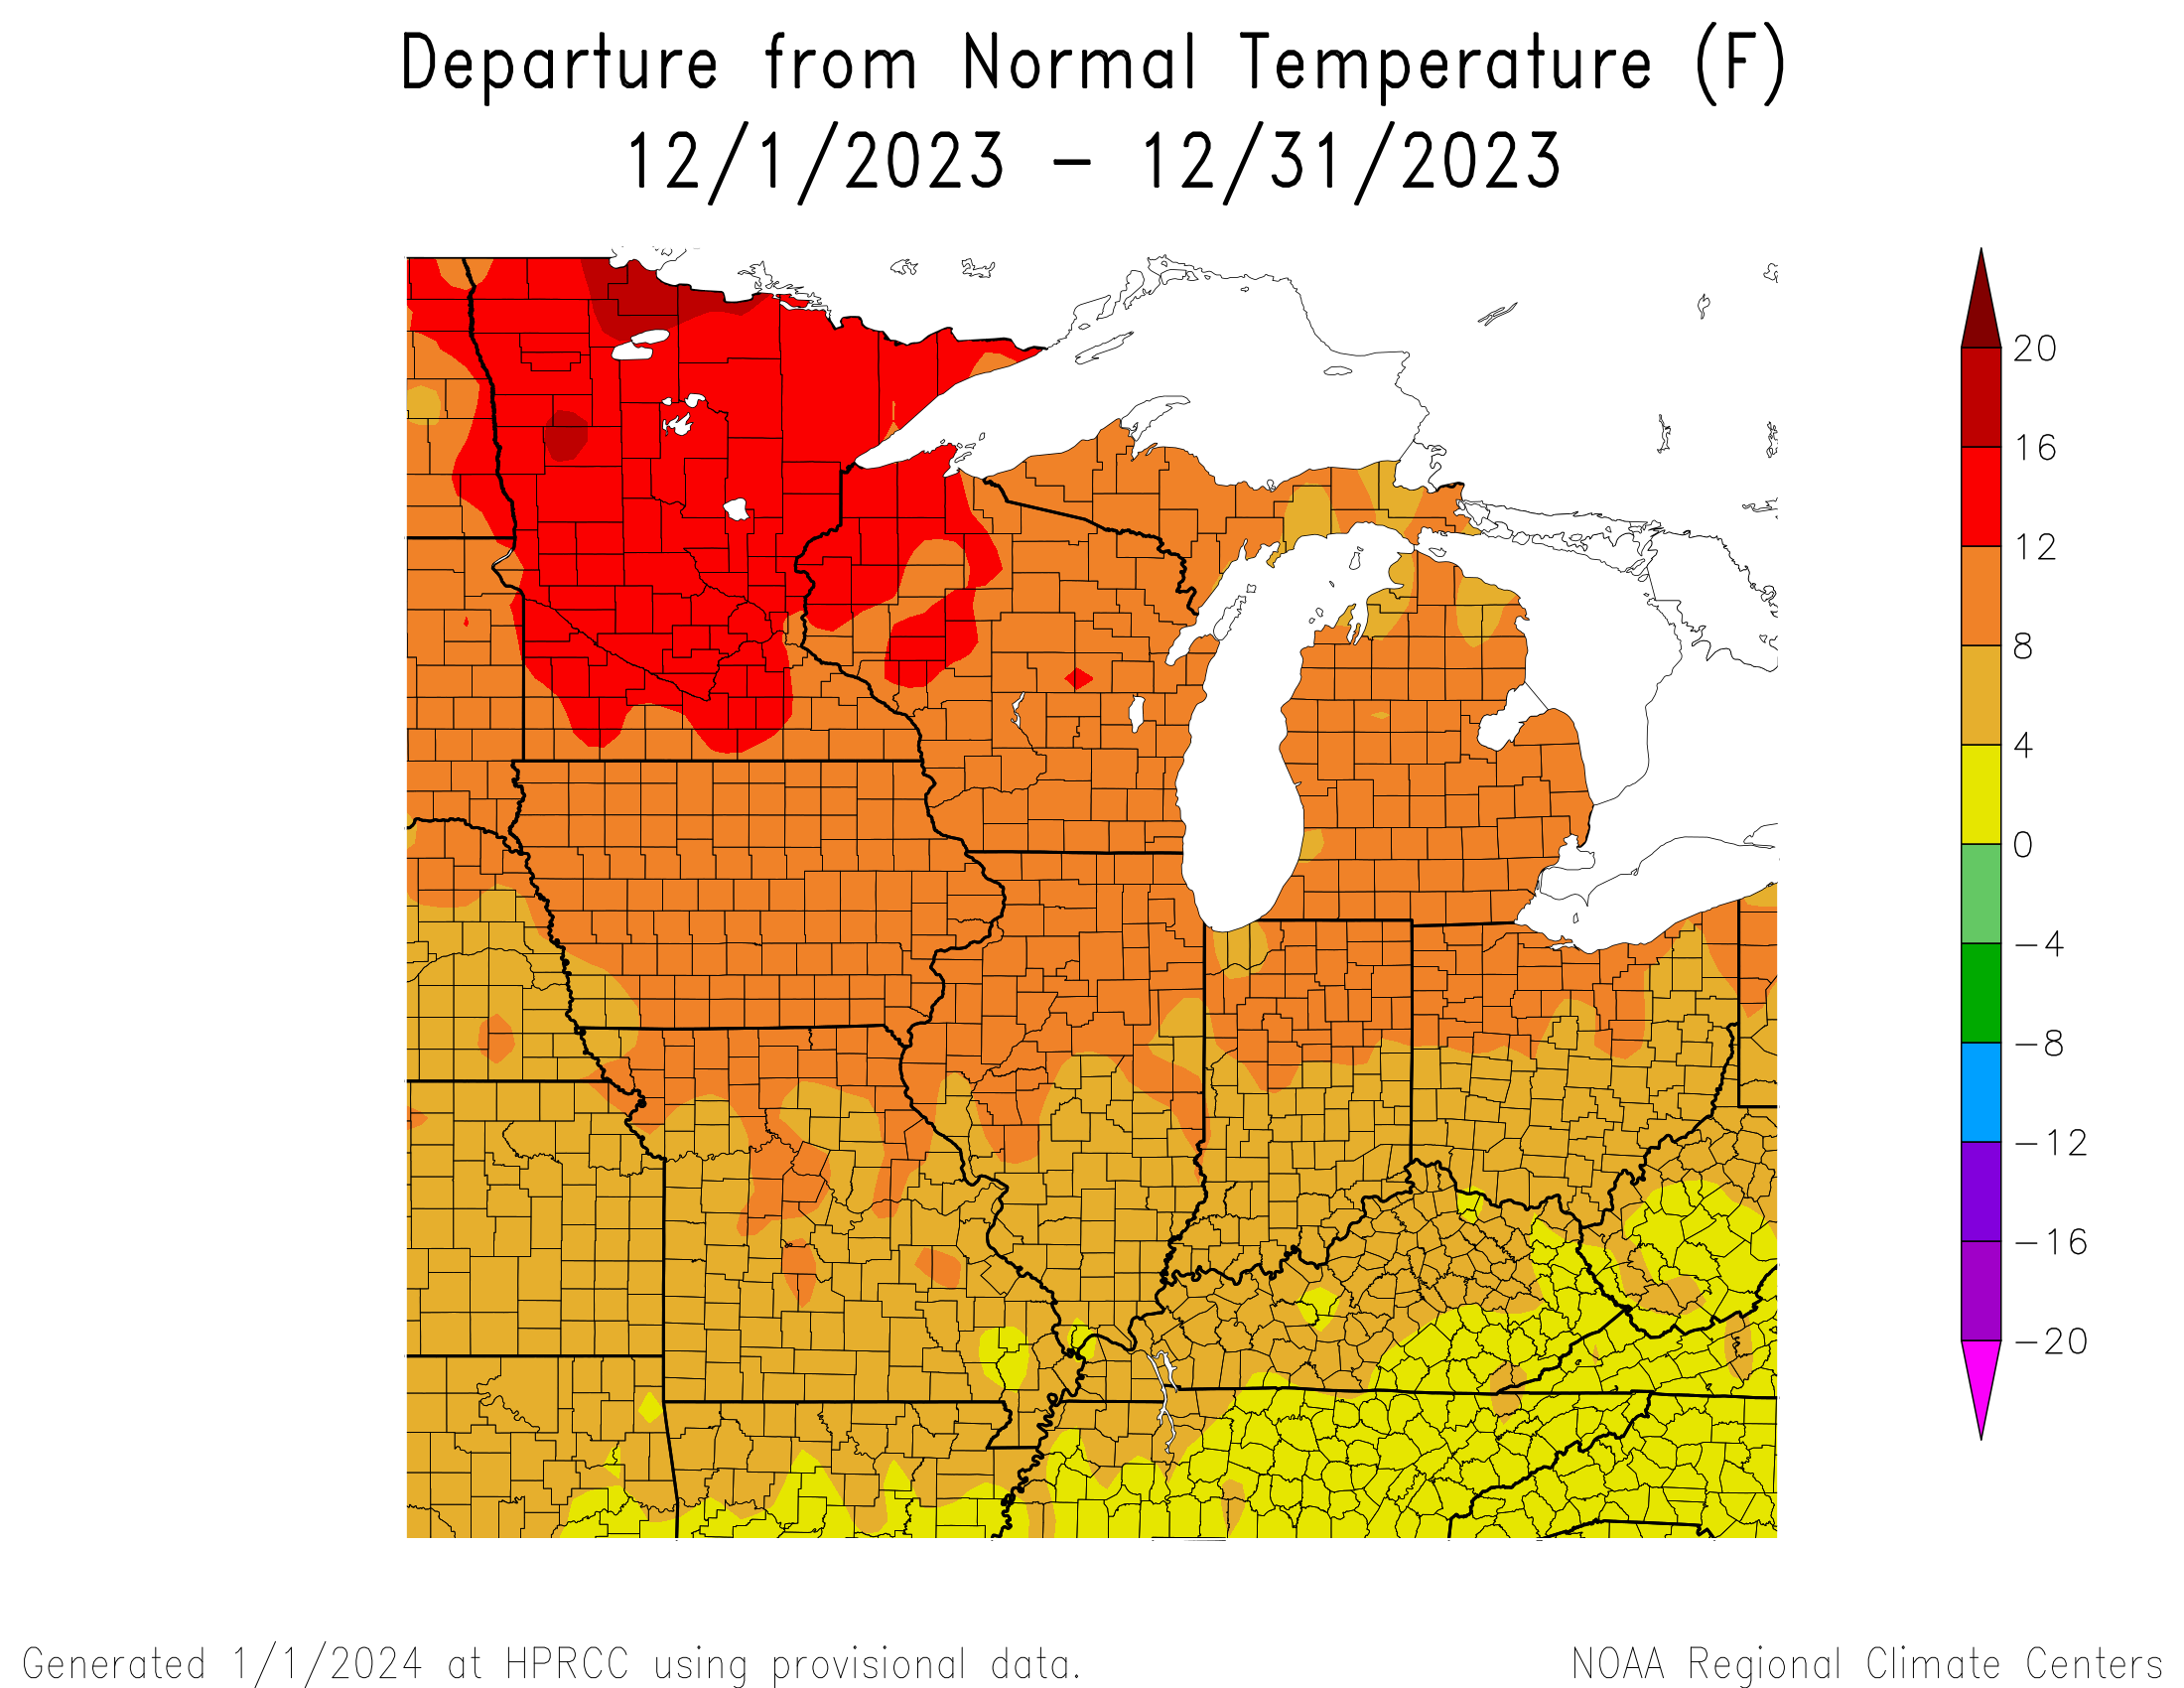
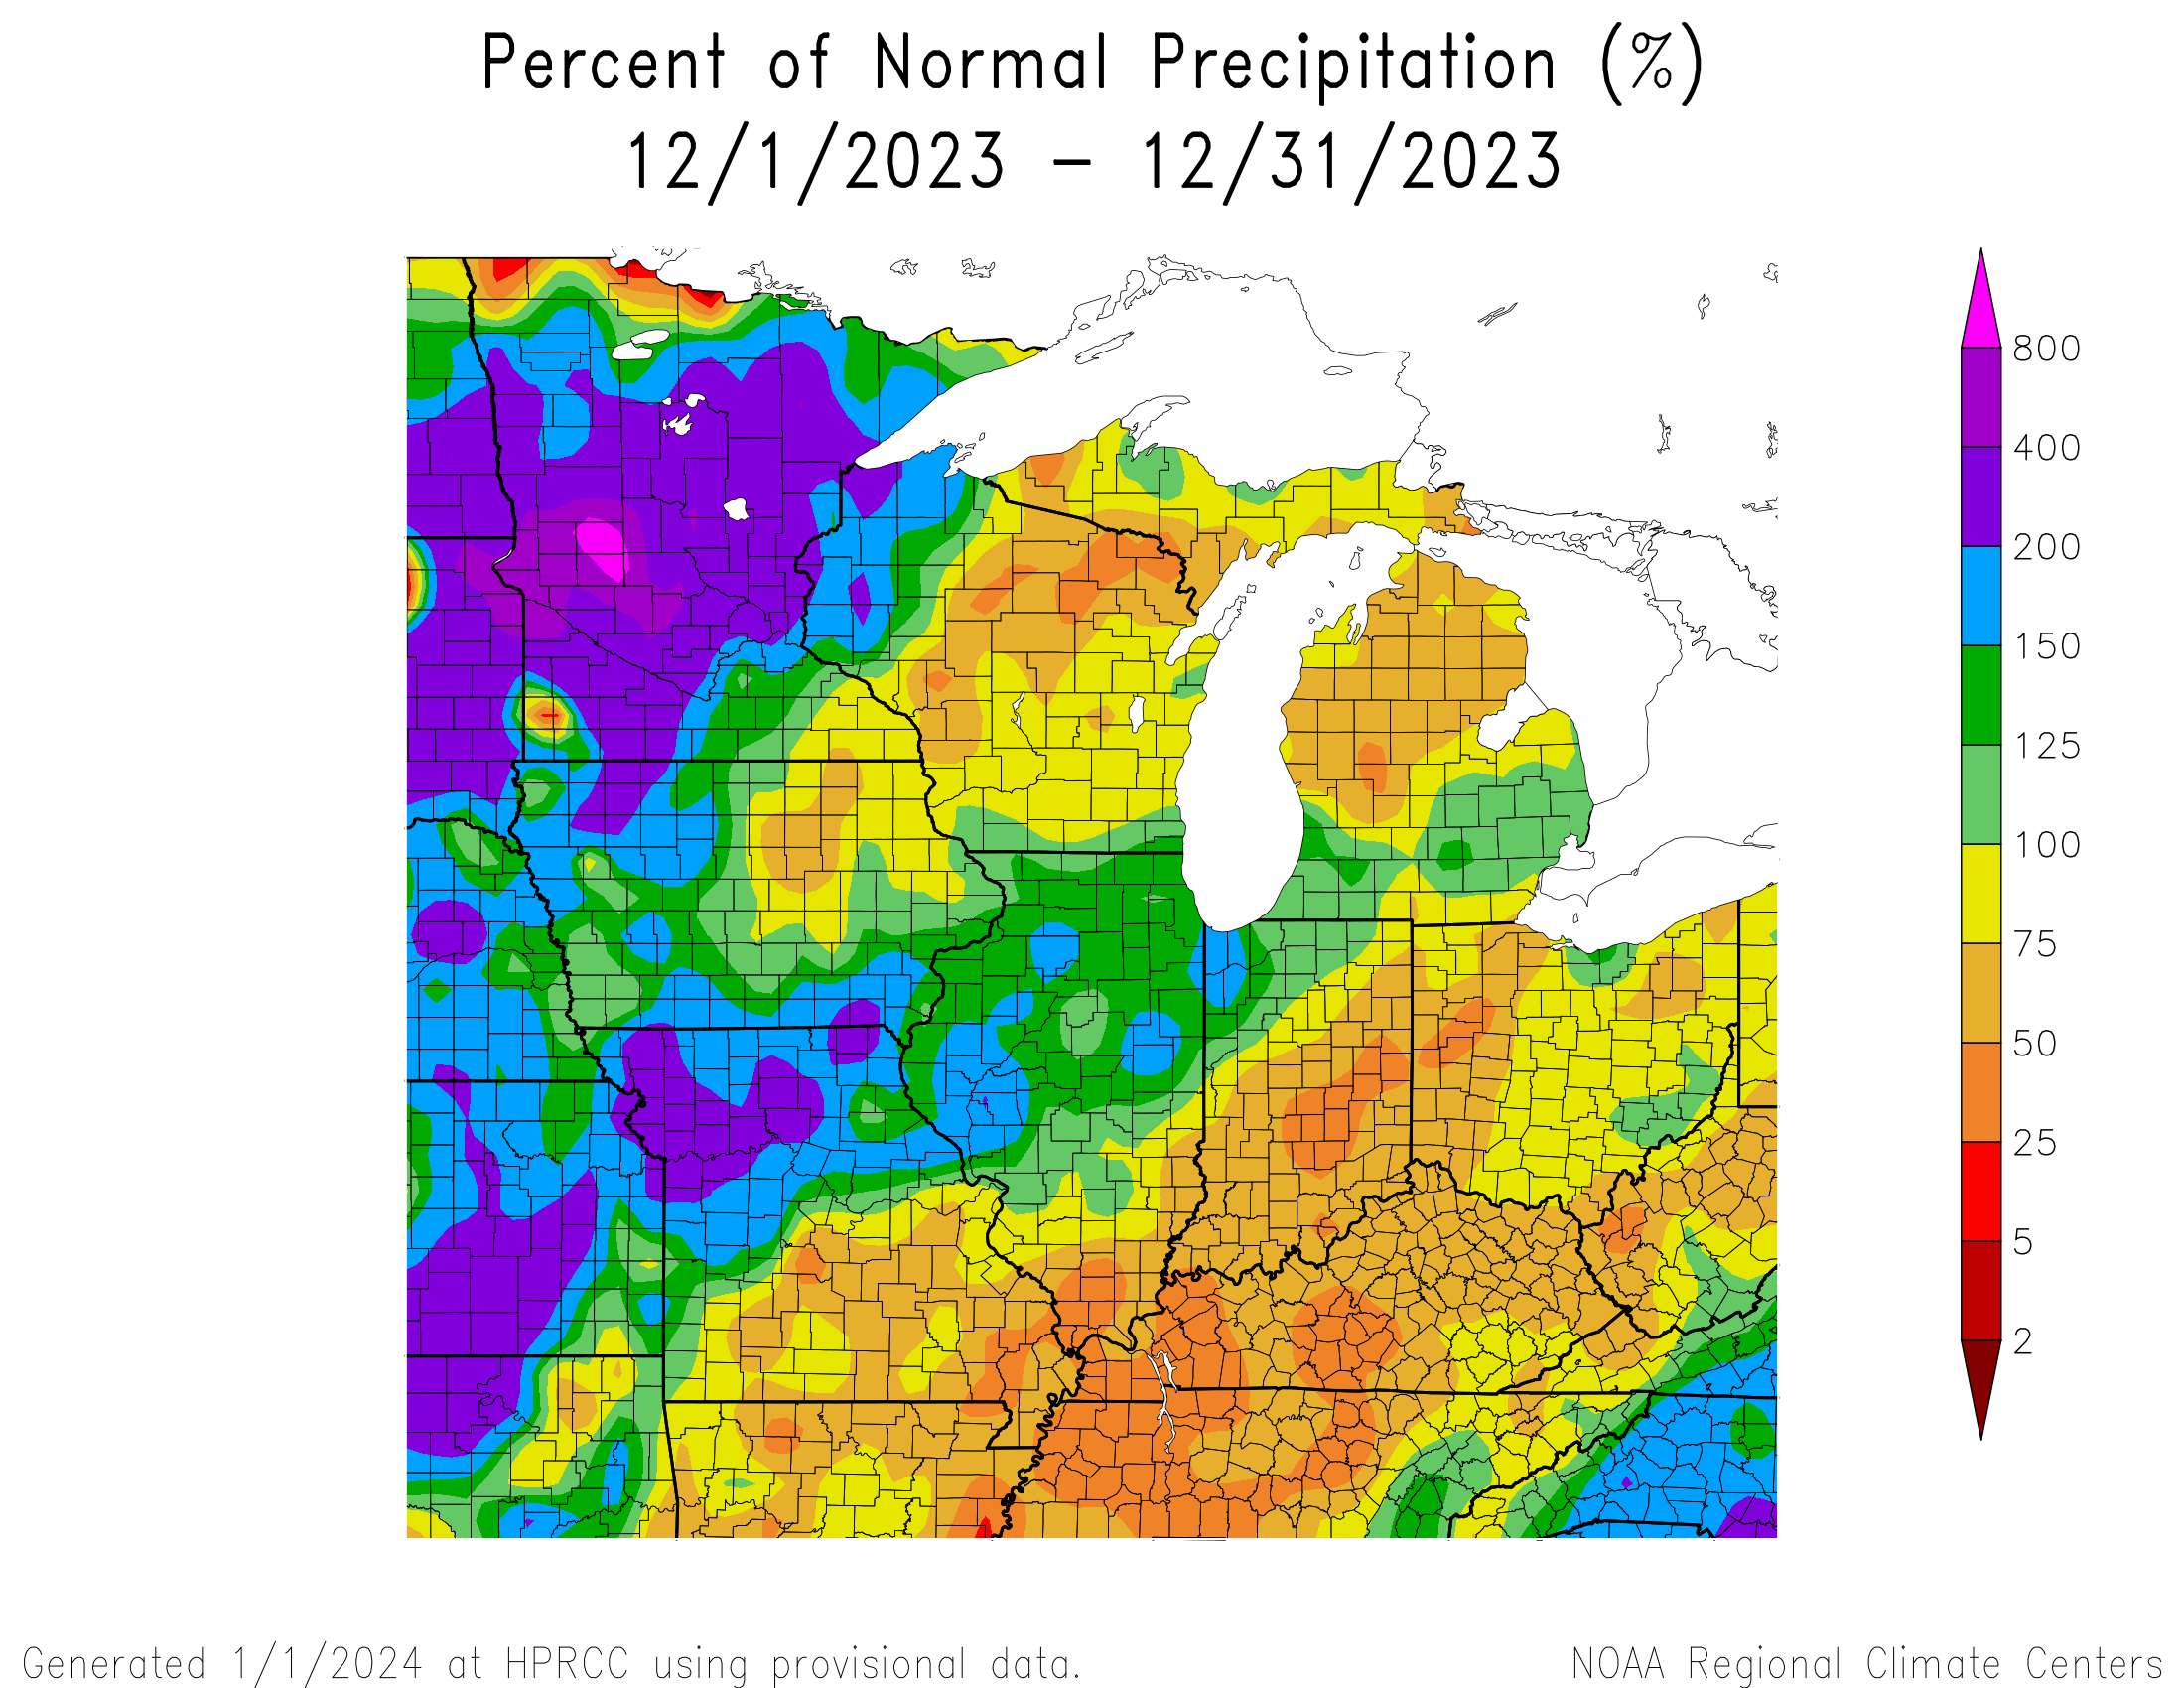
| December 2023 was about 2 to 4 degrees above normal. |
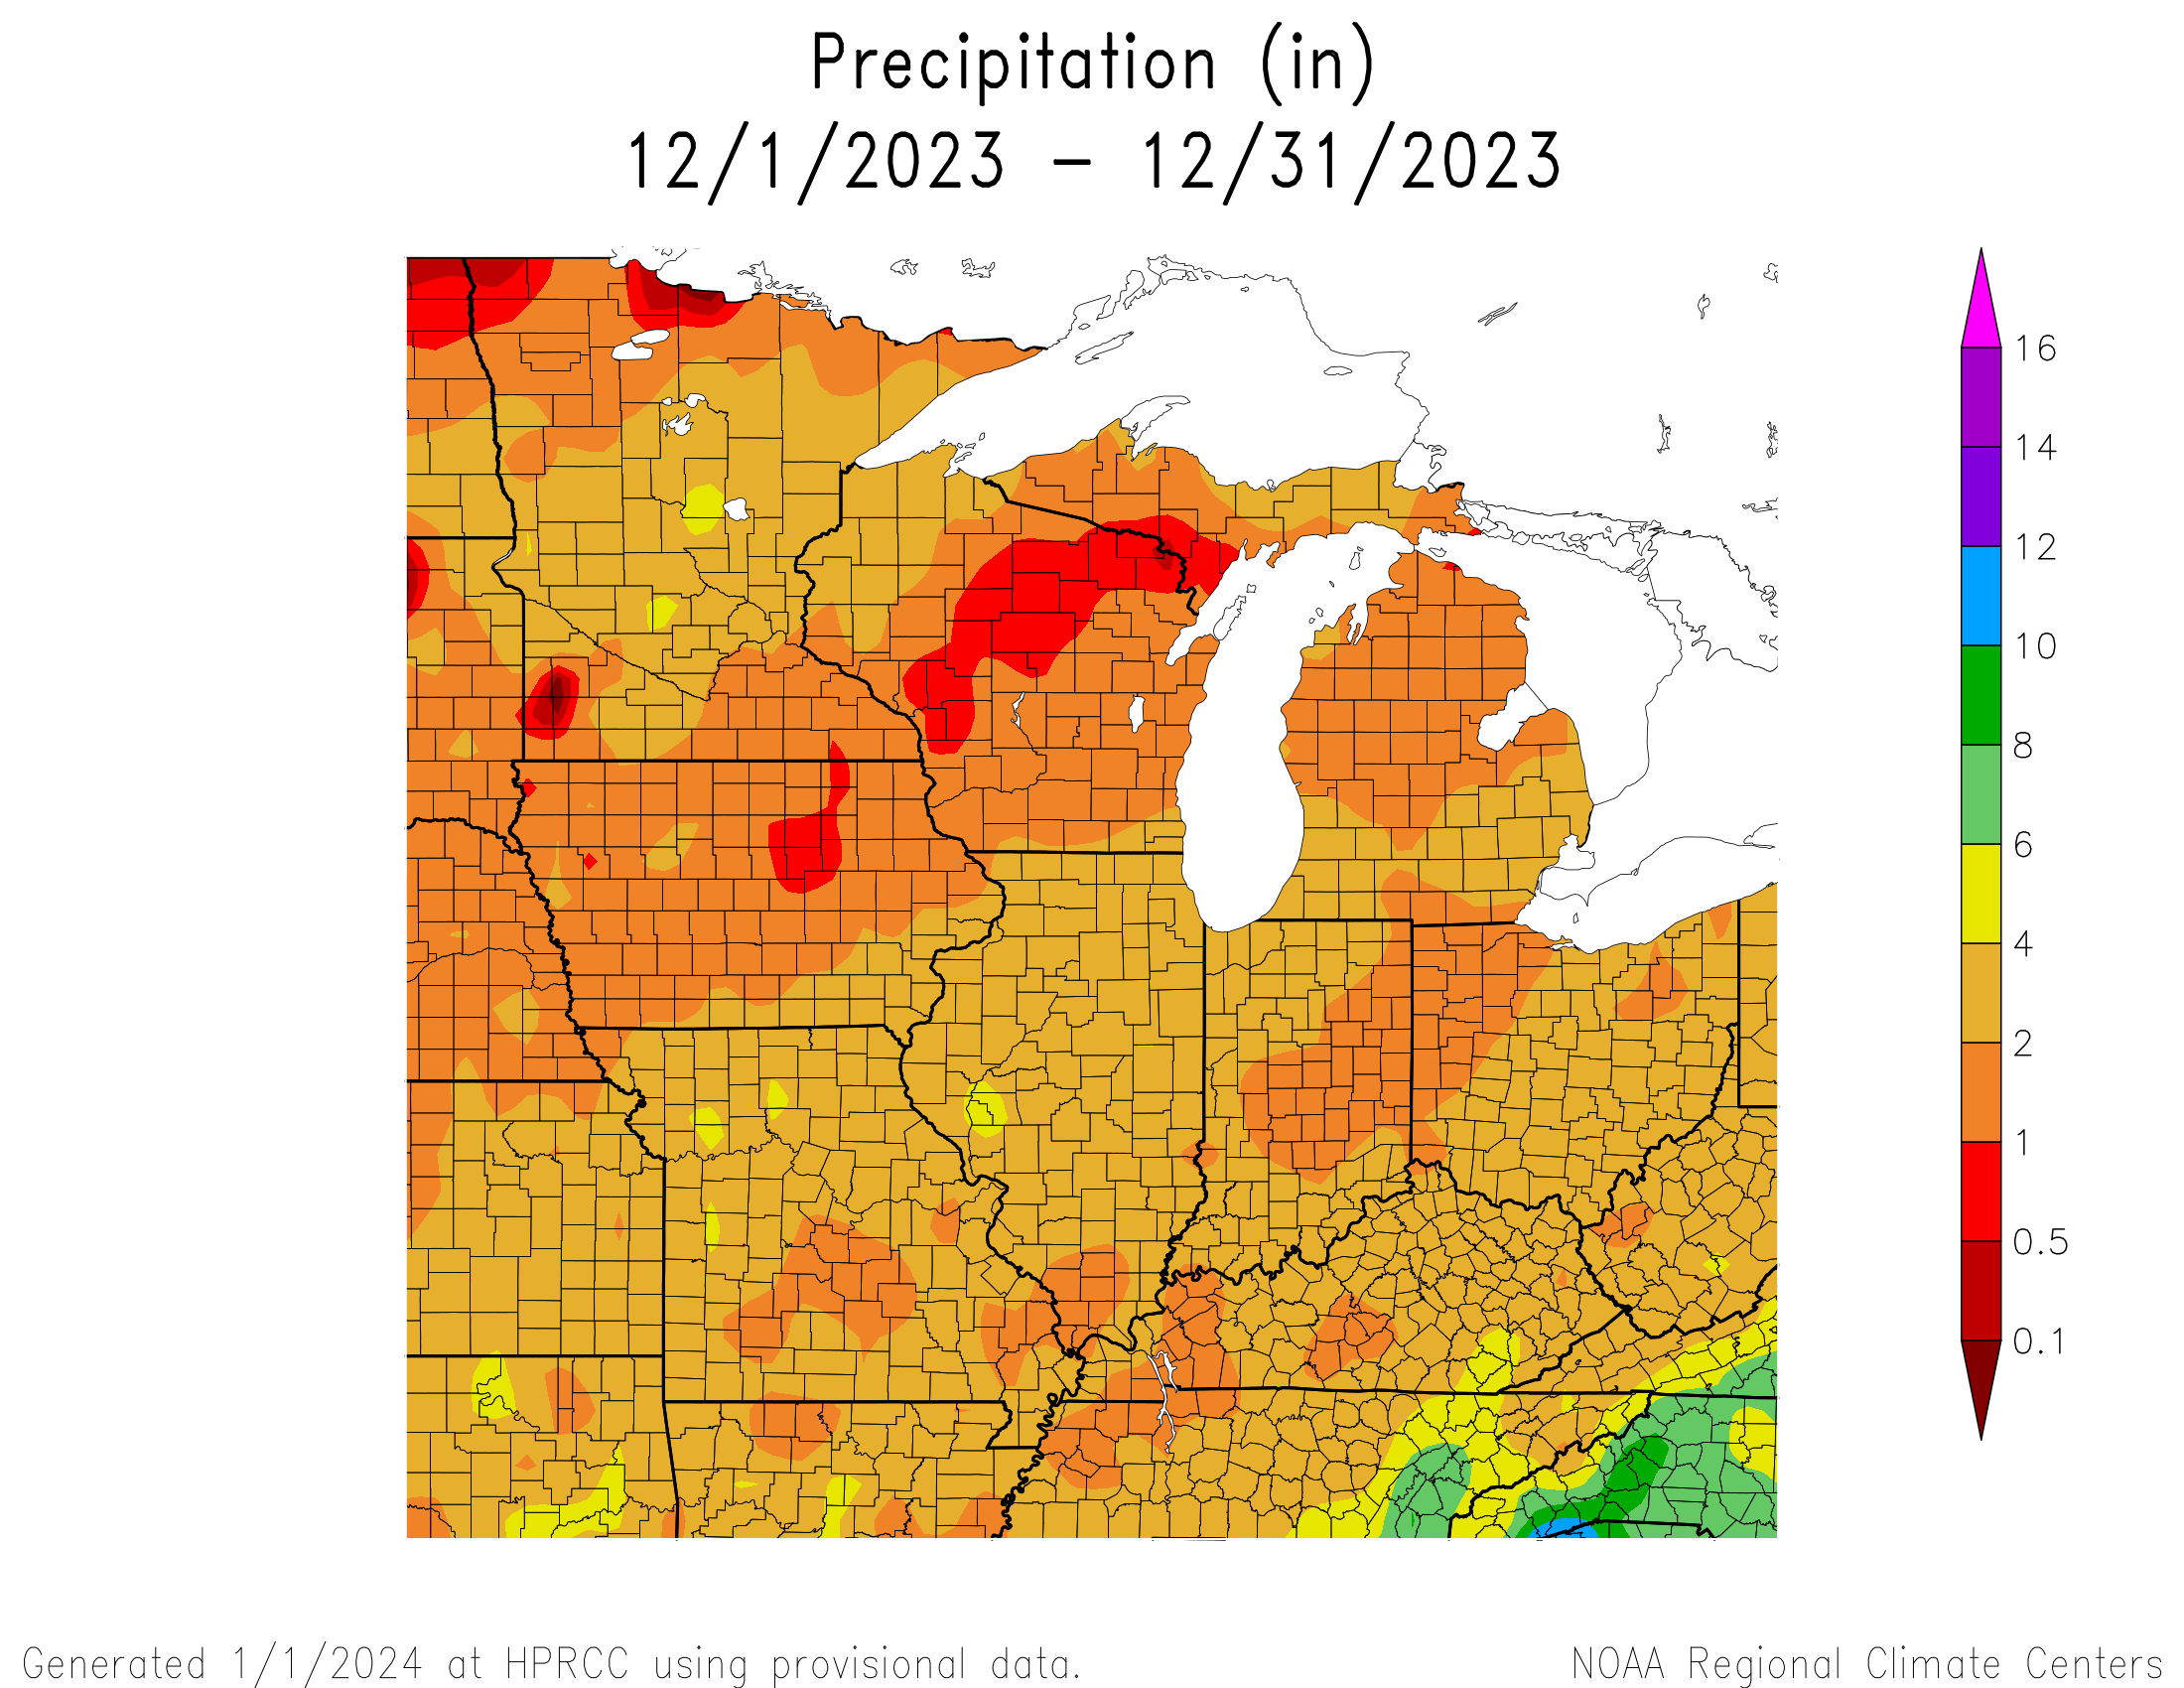
| Precipitation totals were around a quarter inch below normal, with the exception of Iowa City where precipitation was about a quarter of an inch above normal. |
| Snowfall totals were 6 to 7 inches below normal. |
| Please see Dec Records for monthly record information. |
| |
| |
| The climate maps below are courtesy of the Northeast Regional Climate Center and Midwest Regional Climate Center. |
| These maps become available on the first of the month. |
| |
|
|
Average
Temperature |
Accumulated
Precipitation |
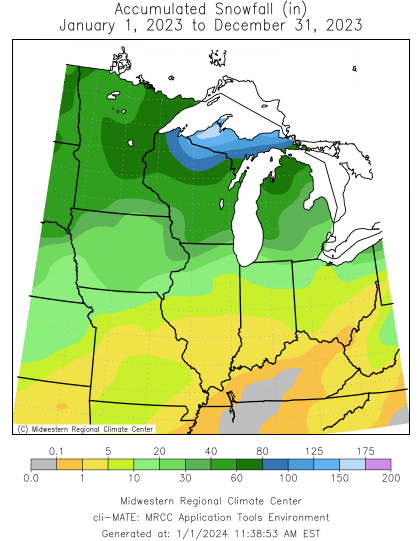
Accumulated
Snowfall |
 |
 |
 |
| |
|
|
Average
Temperature
Departure from Mean |
Accumulated
Precipitation
Percent of Mean |
Accumulated
Snowfall
Percent of Mean |
 |
 |
 |
|
| |
| |
| |
| |
| Climate/Almanac Data - Annual Normals - Annual Records |
| |
| 2023 Annual Climate |
| |
|
Site
(Click site for report courtesy of the IEM)
|
Avg
Temp |
Normal
1991-2020 |
Dept
From
Norm |
Precip
Total |
Normal
1991-2020 |
Dept
From
Norm |
Snowfall
Total |
Normal
1991-2020 |
Dept
From
Norm |
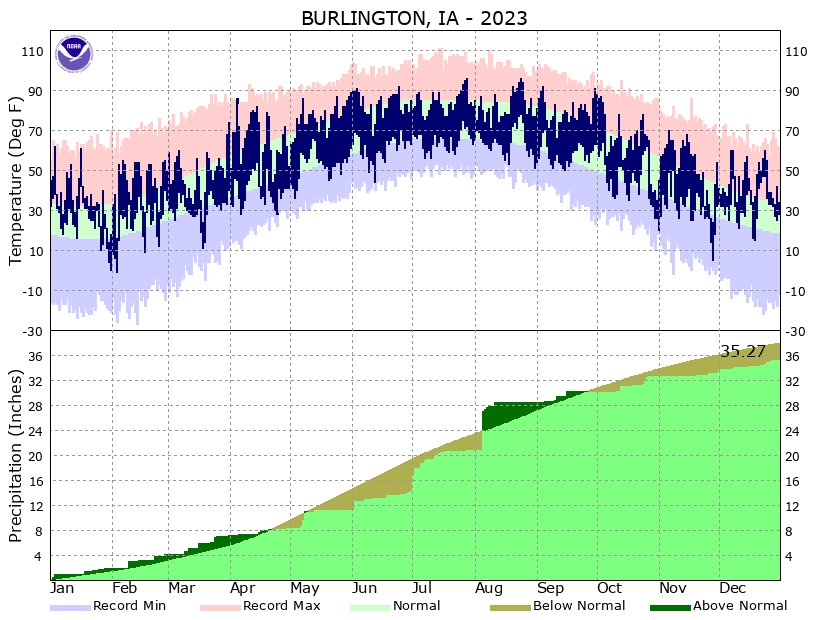
| Burlington |
xx.x° |
51.9° |
+x.x° |
38.68" |
37.86" |
+0.82" |
NA |
NA |
NA |
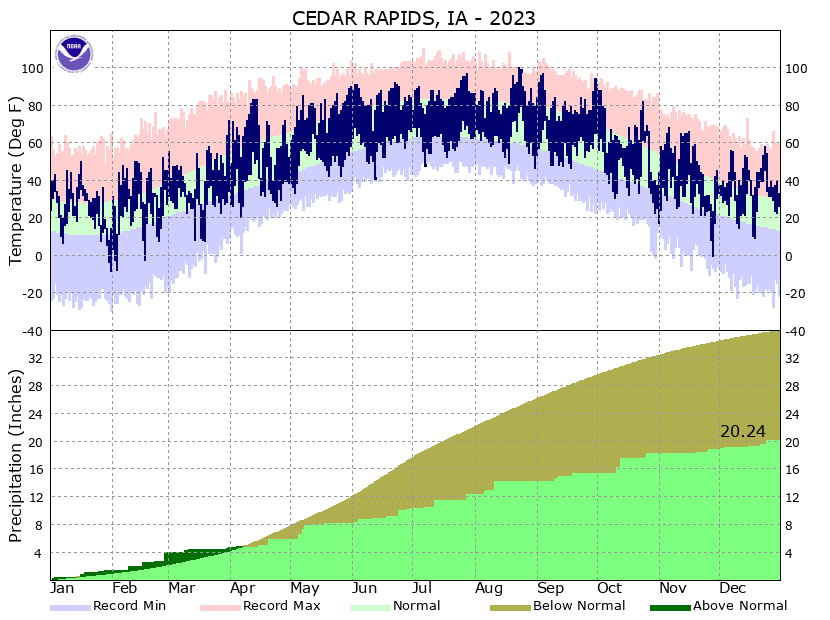
| Cedar Rapids |
xx.x° |
48.2° |
+x.x° |
37.60" |
35.91" |
+1.59" |
NA |
NA |
NA |
| Davenport |
xx.x° |
49.9° |
+x.x° |
35.53" |
36.17" |
-0.64" |
31.7" |
NA |
NA |
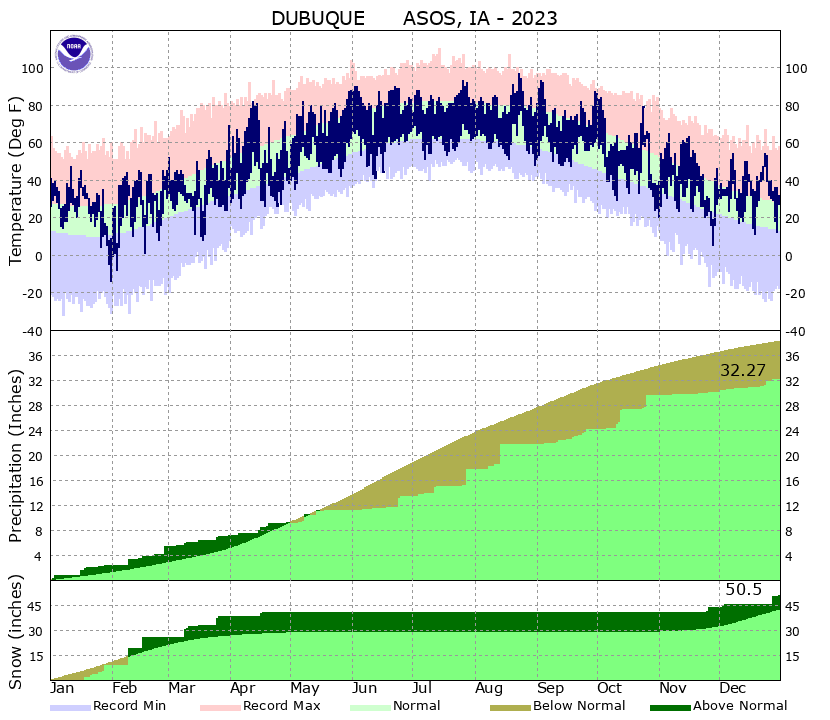
| Dubuque |
xx.x° |
47.2° |
+x.x° |
40.56" |
38.20" |
+2.36" |
40.5" |
42.5" |
-2.0" |
| Iowa City |
xx.x° |
51.0° |
+x.x° |
38.19" |
35.68" |
+2.51" |
NA |
NA |
NA |
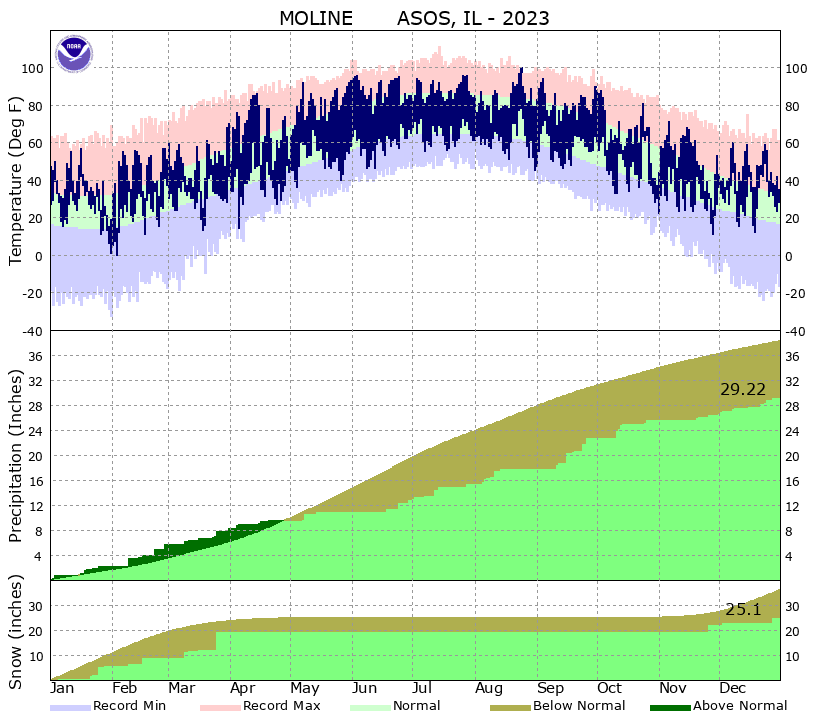
| Moline |
xx.x° |
51.2° |
+x.x° |
34.67" |
38.27" |
-3.60" |
30.6" |
36.1" |
-5.5" |
|
| The ranking is listed in parentheses (__) when within the "Top 10". |
| |
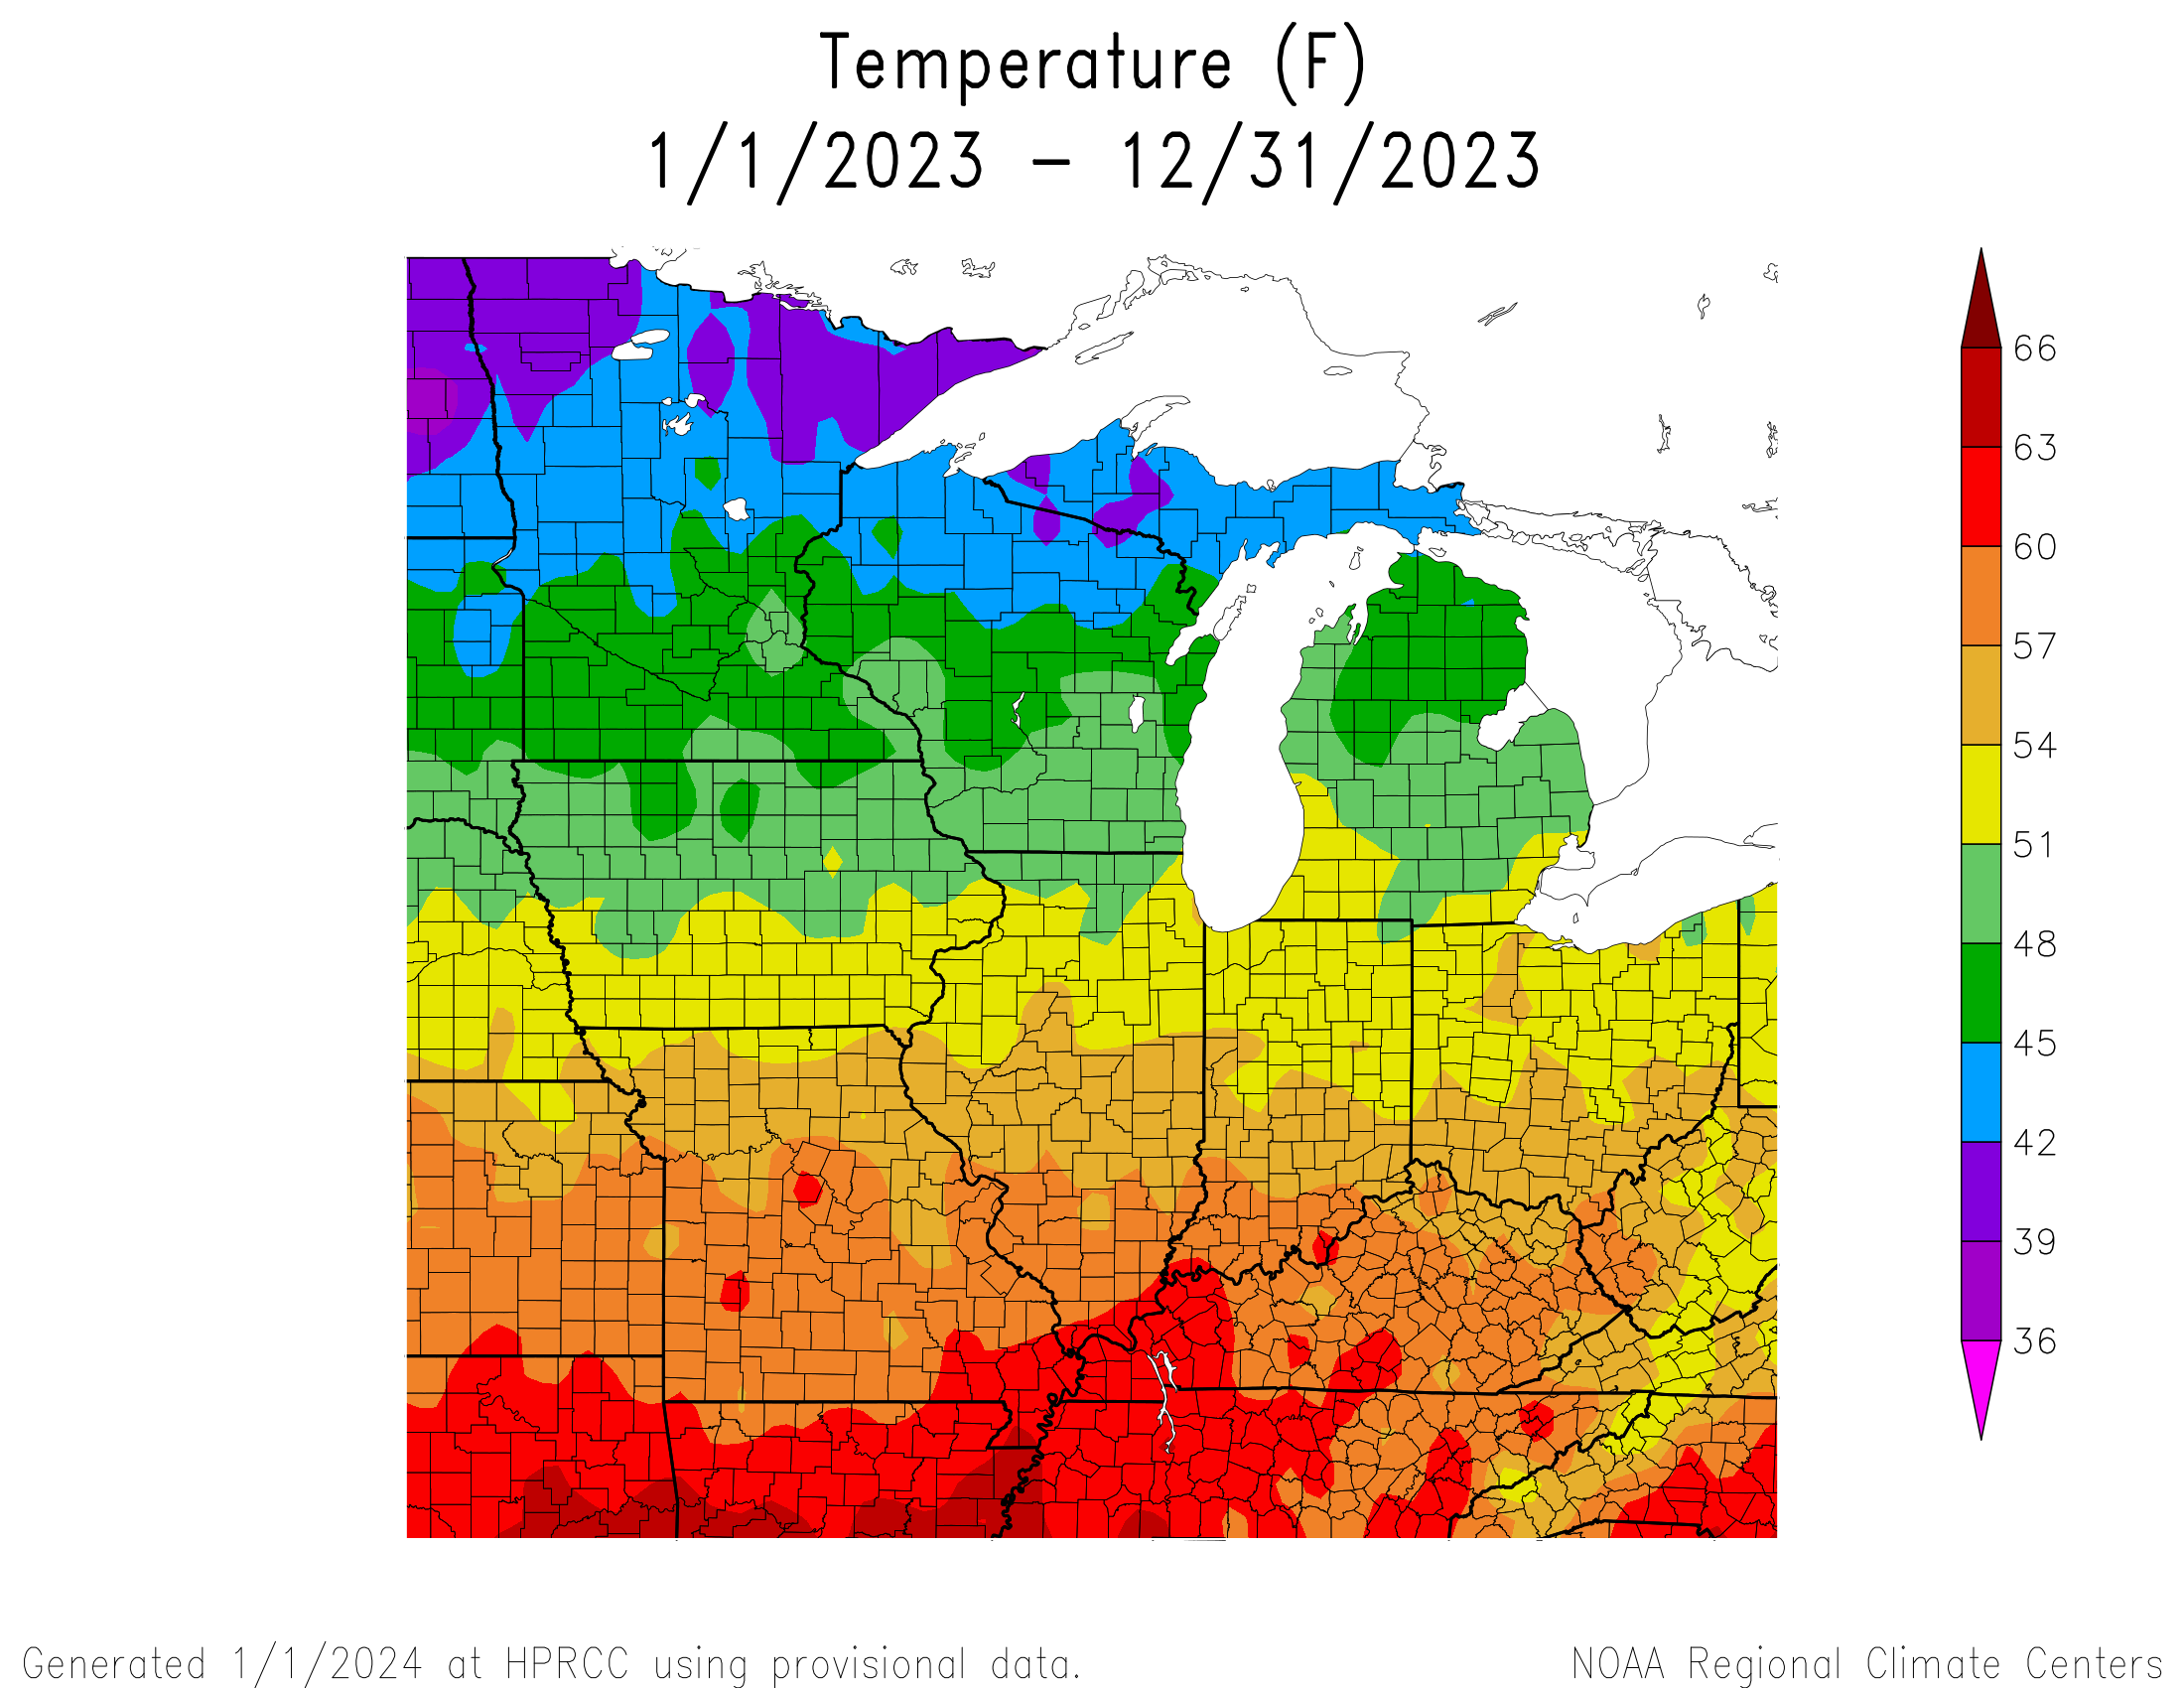
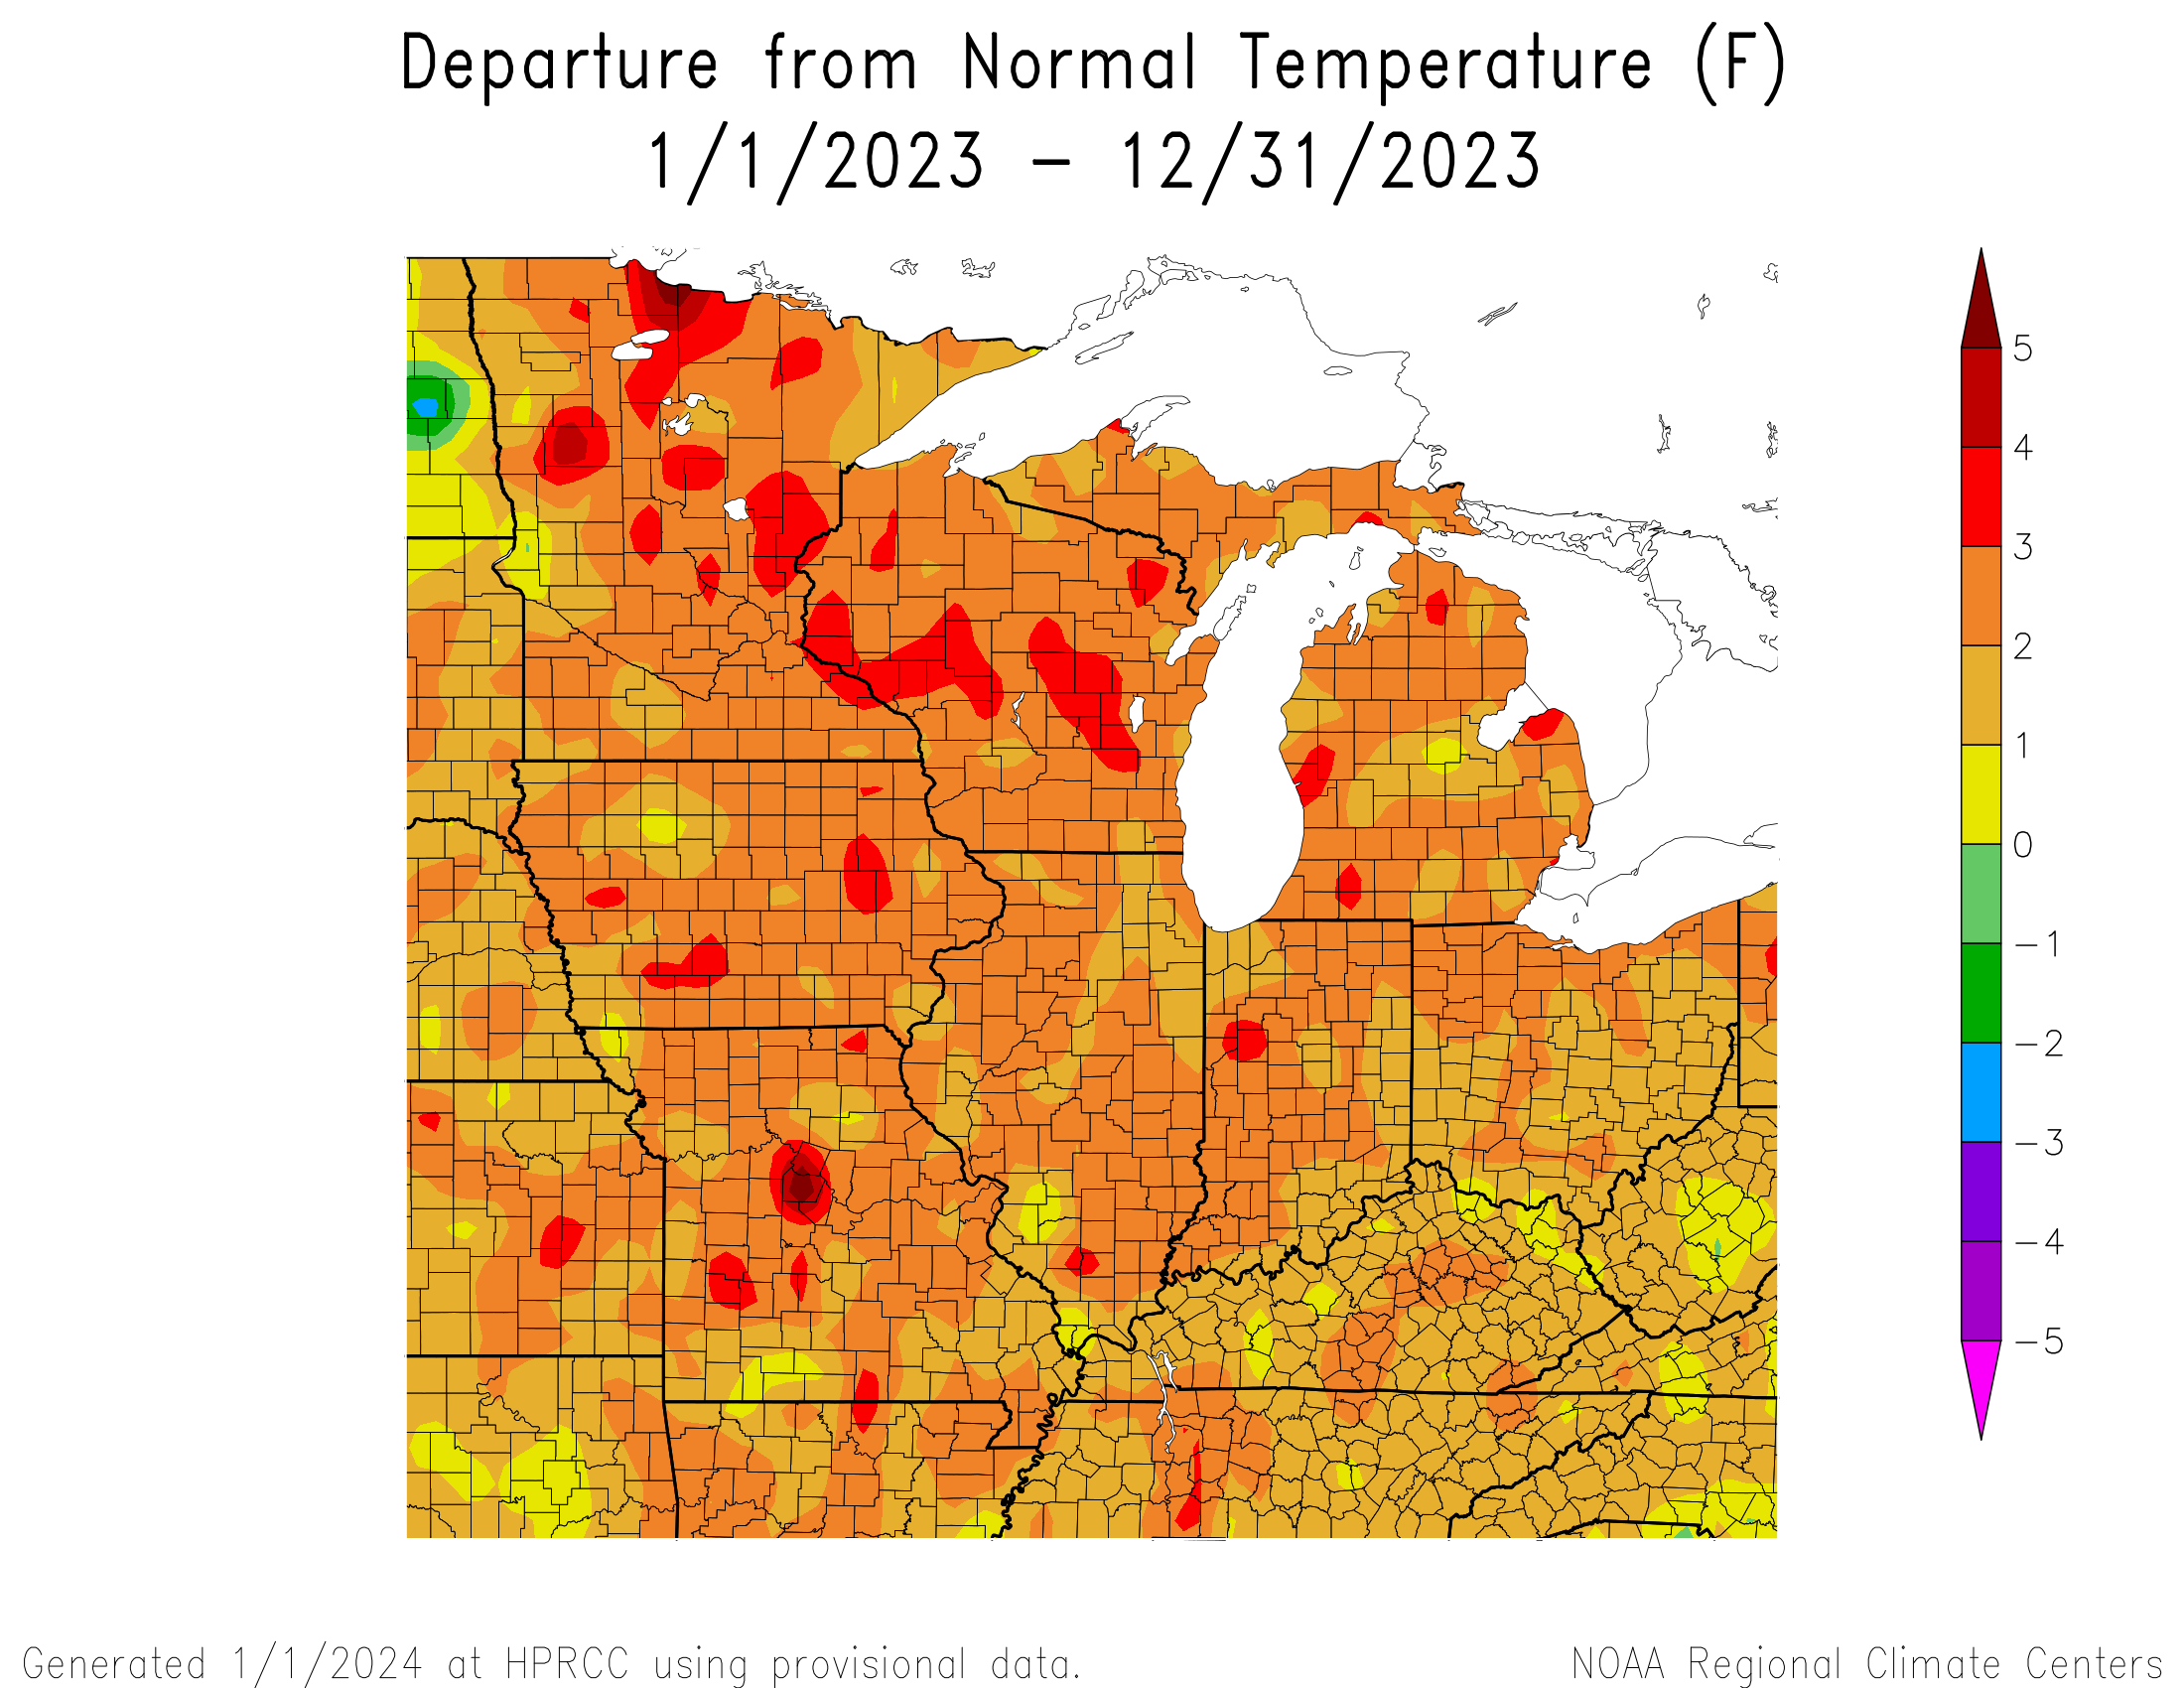
| 2023 temperatures were 2 to 4 degrees above normal. It was one of the Top 5 warmest years on record for much of the Midwest! |
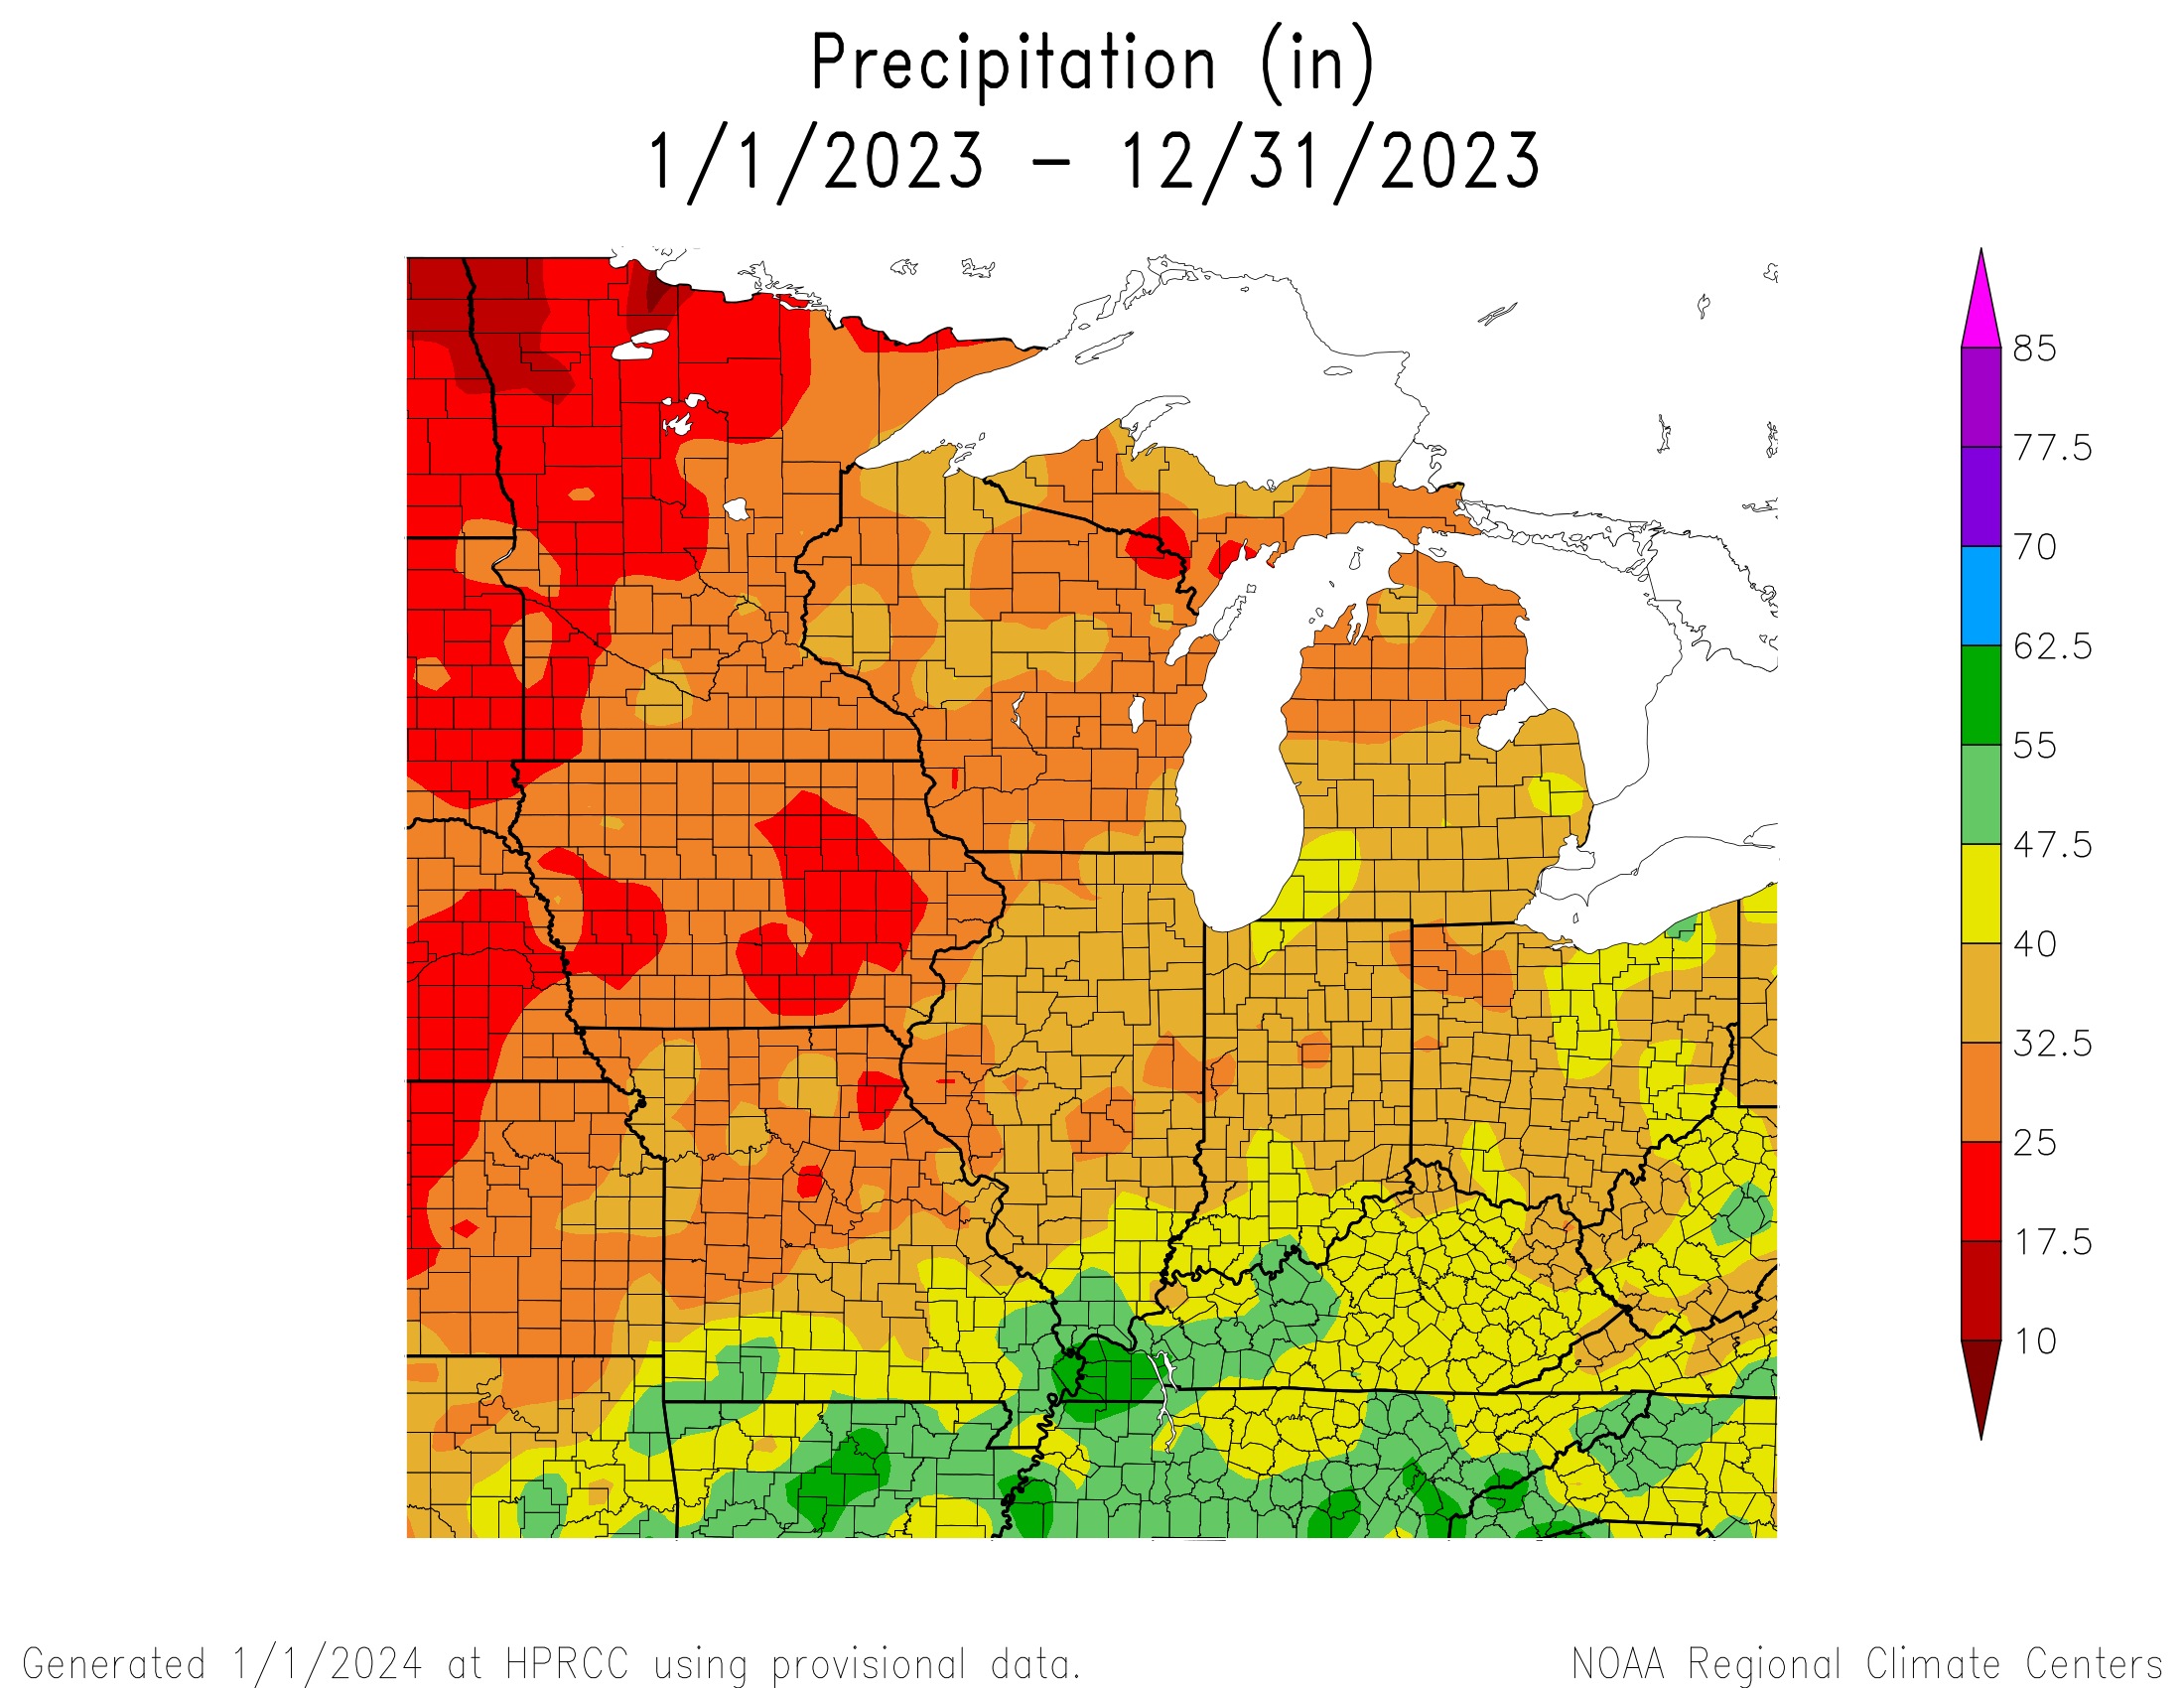
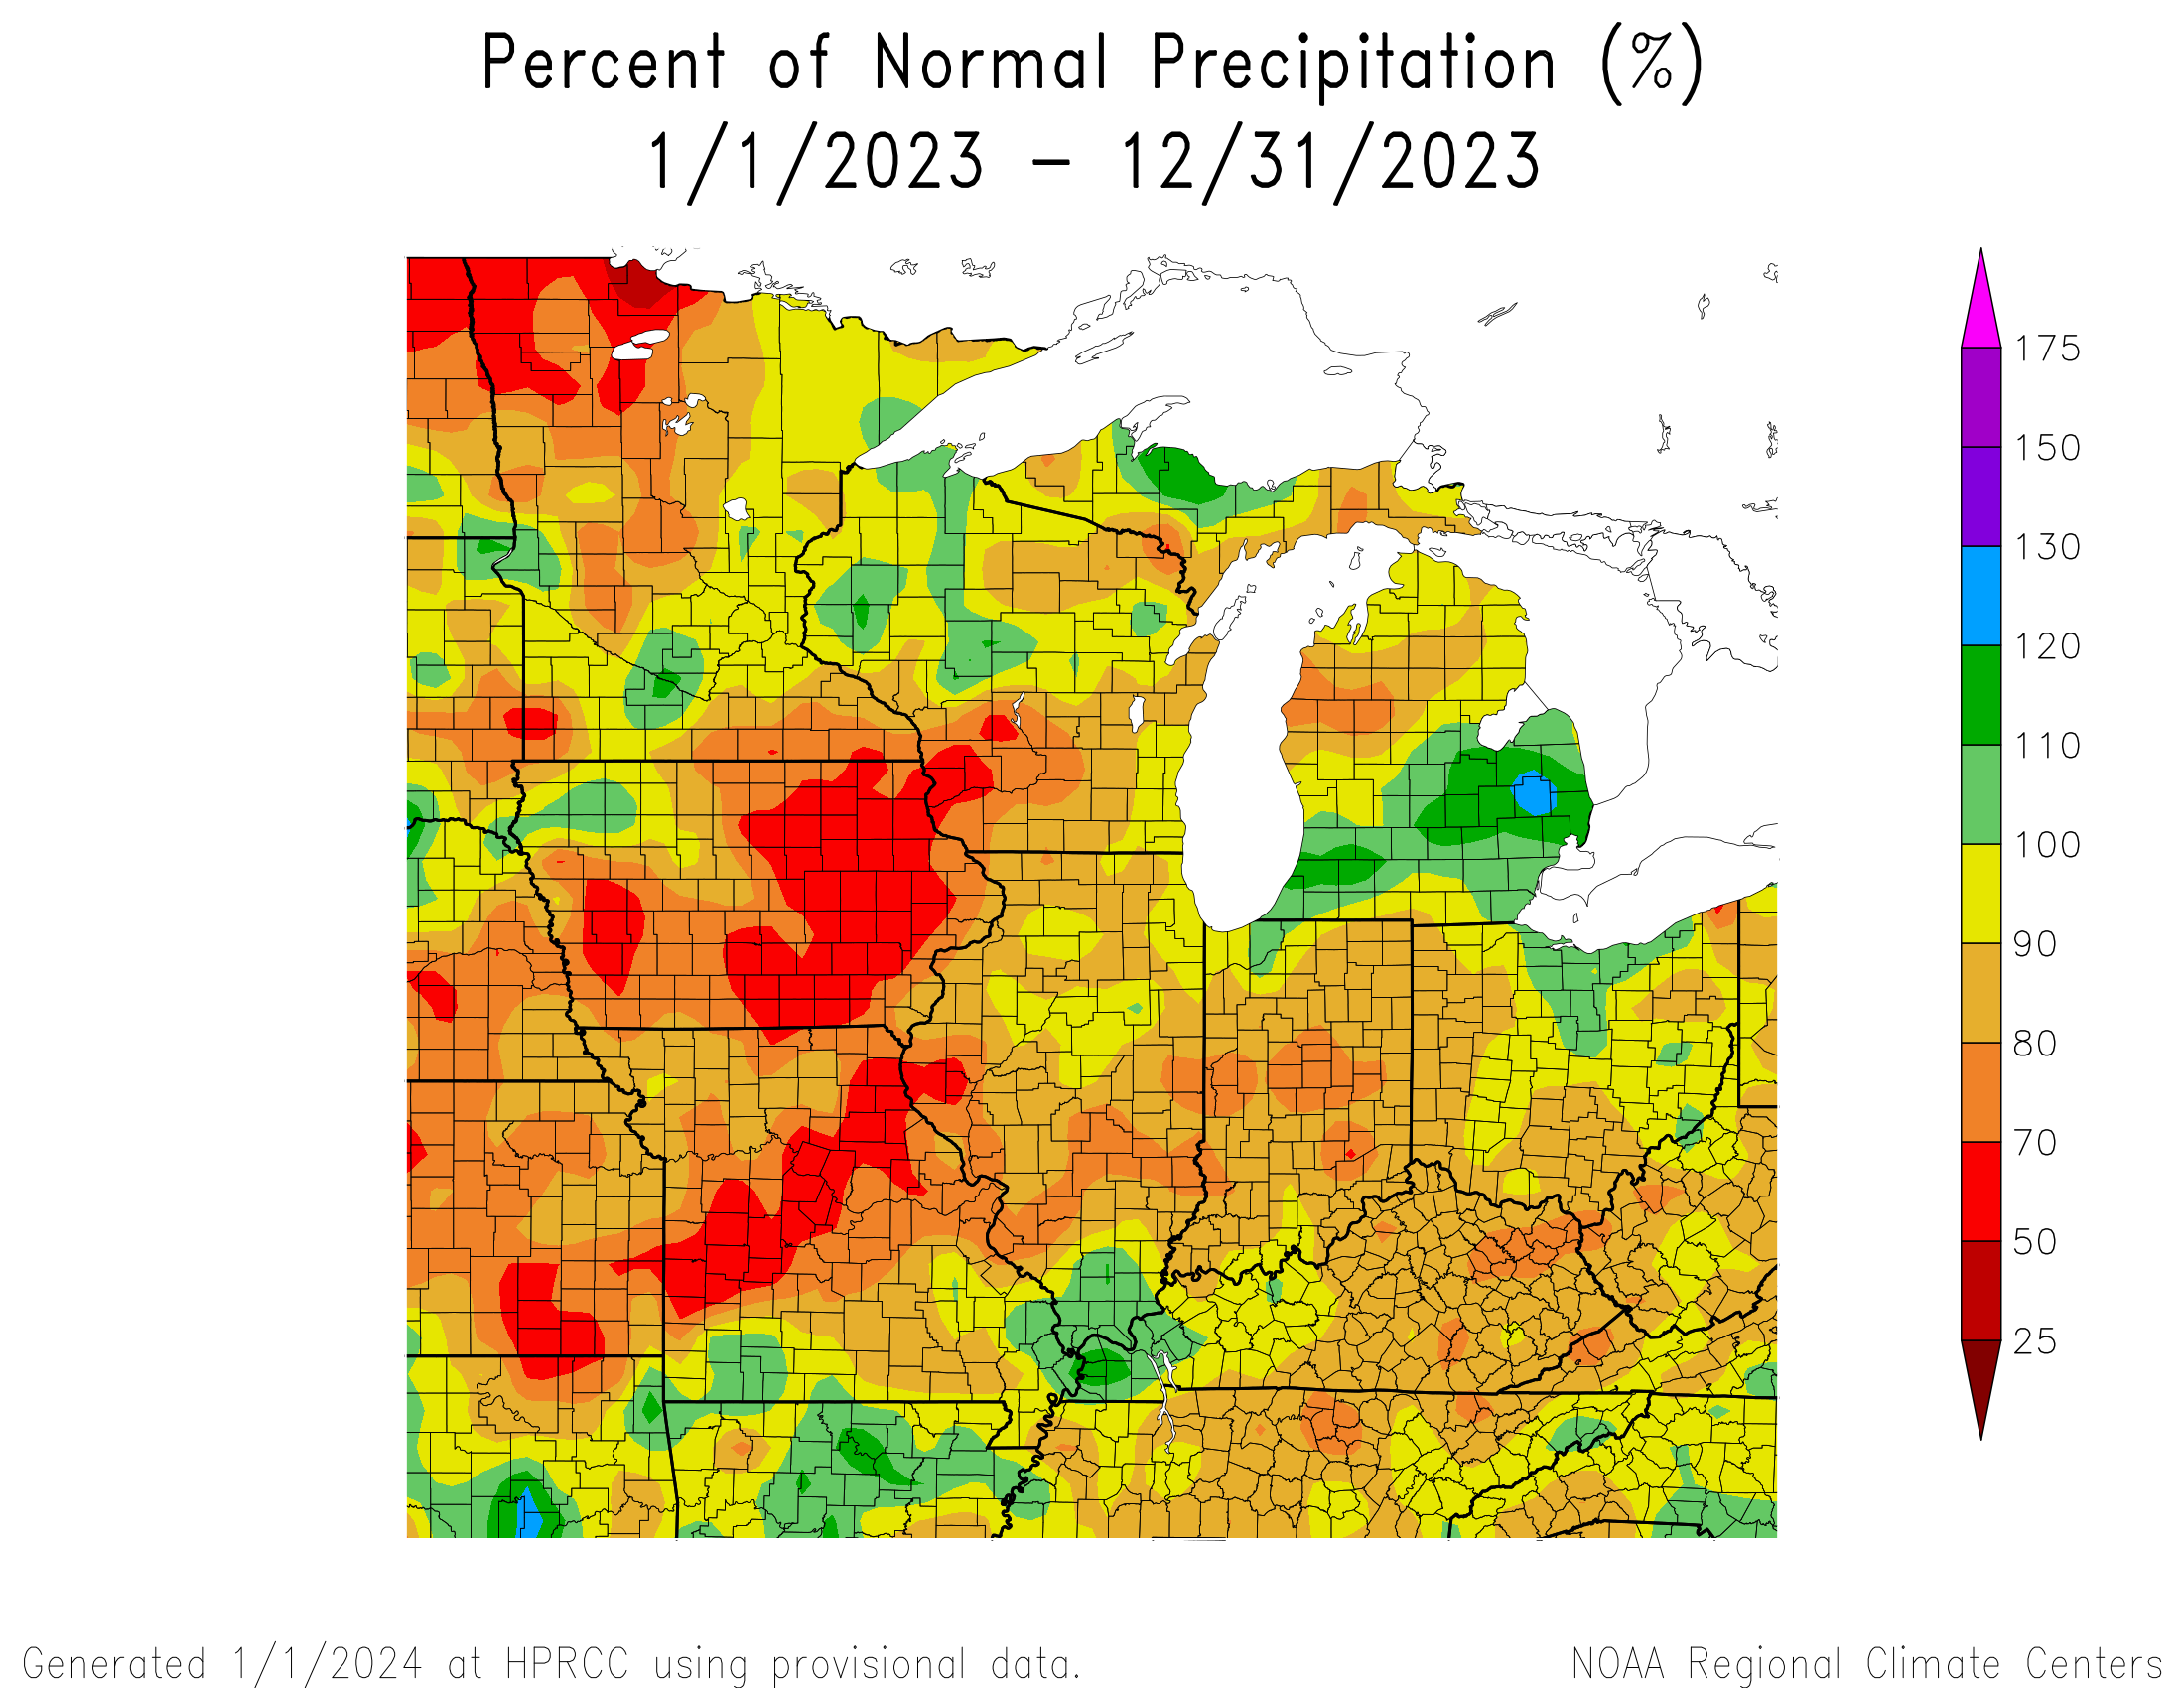
| Precipitation totals ranged from around 3.5 inches below normal to 2.5 inches above normal. |
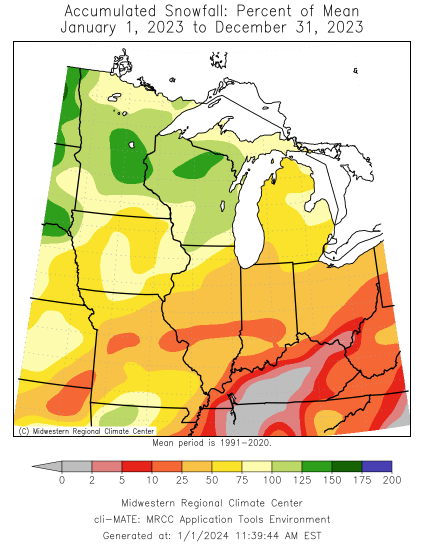
| Snowfall totals for 2023 were about 2 to 5 inches below normal. |
| Please see Annual Records for annual record information. |
| |
| |
| The climate maps below are courtesy of the Northeast Regional Climate Center and Midwest Regional Climate Center. |
| These maps will be updated on January 1. |
| |
Average
Temperature |
Accumulated
Precipitation |
Accumulated
Snowfall |
 |
 |
 |
| |
|
|
Average
Temperature
Departure from Mean |
Accumulated
Precipitation
Percent of Mean |
Accumulated
Snowfall
Percent of Mean |
 |
 |
 |
|
| |
| |
2023 Climate Graphs |
| |
| Burlington, IA |
Cedar Rapids, IA |
Dubuque, IA |
Moline, IL |
 |
 |
 |
 |
|
| |
| |
| A LOOK AHEAD |
| |
| |
January
Temperature Outlook |
January
Precipitation Outlook |
January - March
Temperature Outlook |
January - March
Precipitation Outlook |
 |
 |
 |
 |
|
| |
| |
| |
| |
| |
| |
| |
| |

