Goodland, KS
Weather Forecast Office
Kansas Tornado Information
The chart below shows the annual distribution of tornadoes in Kansas 1950-2012. Click to enlarge.

The maps below show the number of tornadoes, fatalities and injuries for each Kansas county. Click to enlarge.
| Tornadoes | Fatalities | Injuries |
.png) |
.png) |
.png) |
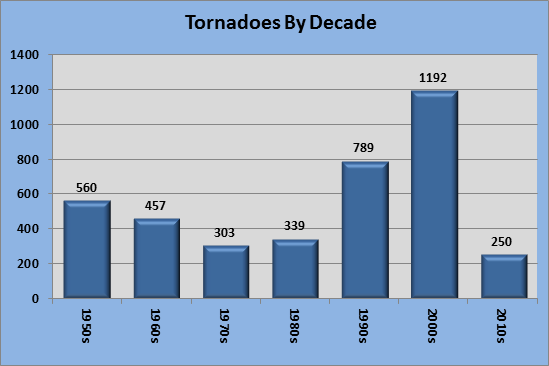
The 63-year average for 1950-2012 for Kansas is 61. The 30-yr average for 1983-2012 is 80. The 10-yr average for 2003-2012 is 112 tornadoes. Replotting the annual data in the above chart into decades gives the image below. Click to enlarge.
The chart below shows the annual distribution of tornado fatalities in Kansas 1950-2012. Click to enlarge.

The chart below shows the monthly distribution of tornadoes in Kansas 1950-2012. Click to enlarge.

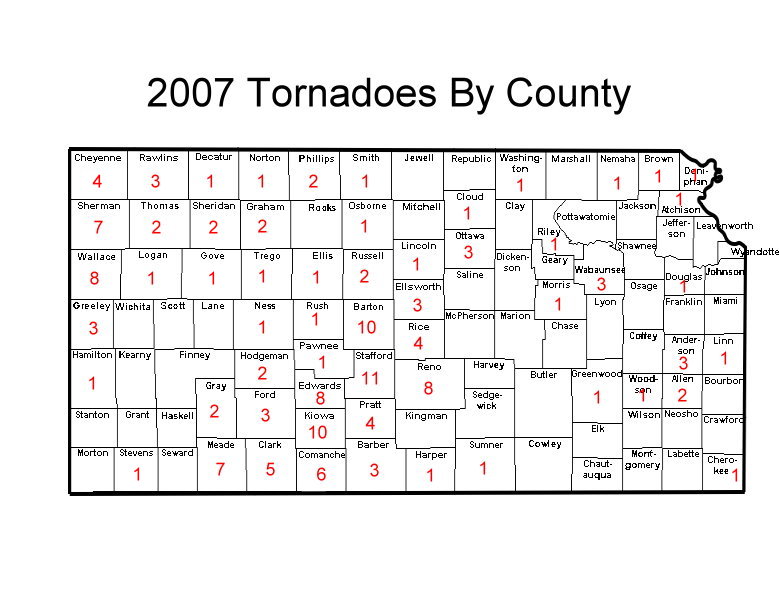
The maps below show the number of tornadoes in each county for the past six years. Click on the maps to enlarge. Soon to be added will be a link to a page of interesting facts for that year, discussing the number of weak, strong and violent tornadoes, first and last tornado of the season, longest track, most in one day, etc.
.png) |
 |
 |
 |
 |
 |
Current Hazards
Storm and Precipitation Reports
Experimental Graphical Hazardous Weather Outlook
Submit a Storm Report
Outlooks
Current Conditions
Satellite
Local Storm Reports
Observed Precipitation
Local Snowfall Reports
Observations
Snowfall Analysis
Forecasts
Activity Planner
Hourly Forecasts
Fire Weather
Forecast Discussion
User Defined Area Forecasts
Local Information
Aviation Weather
Blog
Coop Observer
Decision Support Serivces Page
Local Observations
Local RSS Feeds
Our Office
Precip Analysis
Republican River Flood of 1935
Snowfall Analysis
Social Dashboard
Text Weather Index
Today in Weather History
Weather Radio
Weather Safety Images
Winter Storm Severity Index
Local WRN Ambassadors
US Dept of Commerce
National Oceanic and Atmospheric Administration
National Weather Service
Goodland, KS
920 Armory Road
Goodland, KS 67735-9273
785-899-7119
Comments? Questions? Please Contact Us.

