
Scattered strong to severe storms, excessive rainfall, and flooding are expected across parts of the Mid-Atlantic into the Northeast today. Flood Watches are in effect. Heat will continue to impact the West today. Heat advisories are in effect for portions of the Intermountain West; and Extreme Heat Warnings are in effect for portions of Arizona and southeast California. Read More >
|
The Goodland County Warning Area encompasses 19 counties across Northwestern Kansas, Southwestern Nebraska, and Northeastern Colorado. This chart shows the number of tornadoes that were reported each year across the Goodland coverage area. For example, 55 tornadoes were reported in 2007 and only one tornado was reported in 1974. The number of tornadoes is likely an underestimate to the number of tornadoes that actually occurred. The reason for this is that some tornadoes, especially in rural areas, go unreported. In the early 1990s, a major modernization program within the National Weather Service took place, which included the deployment of Doppler radar and a more rigorous spotter training program. In addition, the number of storm chasers using video cameras and cell phones to document and report severe weather increased in the 1990s. These factors are likely responsible for the large increase in tornadoes reported since the early 1990s. |
 |
|||||||||||
|
Another way to look at the increase in tornado reports is to break down the numbers by decade. From 1950 to 1989, the number of tornadoes reported in each ten year increment ranged from 65 to 87. Since 1990, the number of tornadoes reported has dramatically increased with over 200 tornadoes reported in the 1990s and 2000s. The 2010s recorded in the bar chart only account for nine years of data (2010-2018). |
|
|||||||||||
|
Digging into the tornado reports a little further, we can also look at the average number of tornadoes reported each year within a decade. For example, in the 1950s, 87 tornadoes were reported over ten years. This averages to around nine tornadoes each year from 1950-1959. The 1990s and 2000s averaged 23-24 tornado reports per year during each ten year period. So far, the 2010s have averaged around 18 tornadoes per year. This data is a little skewed since only nine years (2010-2018) are averaged into the total. |
 |
|||||||||||
|
This chart shows the number of tornado days that occurred each year. A tornado day is defined as a day in which one or more tornadoes occurred. For example, there were four tornado days in 1950 and 13 tornado days in 1965. When comparing the number of tornadoes versus the number of tornado days that occur in a year, it is important to note that there may be a higher number of tornadoes than tornado days. This situation would result when more than one tornado occurs on the same day. For example, in 2018, there were five tornado days for the Goodland County Warning Area, however, there were 11 tornado reports. On May 28th, seven tornadoes were reported, six of which occurred in Kit Carson County and one in Graham County. |
 |
|||||||||||
|
This chart is similar to the one above and takes the number of tornado days that occurred in each decade and averages them to determine approximately how many tornado days occurred per year. For example, on average, four tornado days occurred during each year of the 1970s. Not every year will have exactly the same number of tornado days, nor the average number of tornado days. Returning to the 2018 example from above, 11 tornadoes were reported over a total of five tornado days. So far, the average number of tornado days between 2010 and 2018 is a little under seven days. |
 |
|||||||||||
|
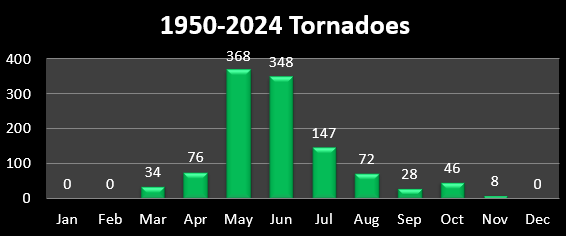
This chart shows the number of tornadoes reported each month between 1950 and 2024. Peak tornado activity for Northwestern Kansas, Southwestern Nebraska, and Northeastern Colorado occurs in May and June, and to a lesser extent July. A total of 767 tornadoes have been reported within these three months which accounts for approximately 81 percent of all reported tornadoes in the Tri-State region. While it is not impossible for a tornado to occur in the Tri-State area in the winter, it is rare. In the past 69 years, no tornadoes have been reported in December, January, or February. |
 |
|||||||||||
| This chart takes the monthly information above and breaks each month's tornado count down into a percentage of the total. Taking June as an example, 35 percent of all tornado reports received since 1950 have occurred during that month, while 30 percent have occurred in May. | 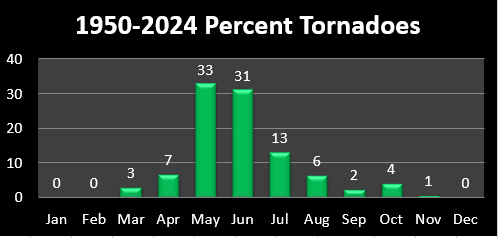 |
|||||||||||
|
The Annual Tornado Season bar chart depicts the length of each tornado season from 1950 to 2018. Each year is represented by a green bar. The years 1950 through 2018 are shown on the x-axis and dates are shown on the y-axis. Due to the small size of the chart, you’ll want to click on it for better readability. The lower end of each bar indicates the date of the first tornado for that year. The upper limit on each bar shows the last day a tornado occurred in a year. For example, in 1951, the first tornado of the year occurred in early May and the last tornado occurred in late August. In 1952, the first tornado also occurred in early May, however the season was much shorter than the 1951 season with the final tornado occurring in mid-July. The years 1974 and 1976 are not represented by bars on this chart. This is because only one tornado day was recorded in each year, and the bars did not graph well. In 1974, one tornado occurred on April 20th in Rawlins County. As of December 31, 2018, the latest day for a tornado season to begin in the Tri-State area is September 12th. On September 12th, 1976, an EF1 tornado occurred in Greeley County and a second tornado occurred in Wallace County. On average, the date of the first tornado in the Tri-State area is May 9, and the date of the last tornado is August 12. This is, however, an average and not every year is considered average. The first reported tornado of the 1992 season occurred on March 8. The 2000 season ended on October 31st with the “Halloween Outbreak” where a total of 13 tornadoes were reported across seven counties. This remains the largest, late season tornado outbreak for the Tri-State area. |
 |
|||||||||||
|
This bar chart depicts the length of each tornado season by year in an easier format to read than the above chart. Instead of showing the date of the start and end of each tornado season on the y-axis, the total number of days in each season is shown. The height of each bar indicates the length of each season with taller bars indicating longer seasons. Taking a look at the 1974 and 1976 seasons, only one tornado day occurred in each year, making these tornado seasons the shortest on record since 1950. Since 1950, the 2015 tornado season is the longest on record at 229 days. The season began on April 2 with an EF0 tornado in Cheyenne County Colorado and ended with a late season outbreak on November 16. |
 |
|||||||||||
|
The Date of First Tornado chart shows when the first tornado of each season occurred from 1950 to 2018 occurred. The x-axis has been divided into ten day increments, and the y-axis shows the total number of tornadoes occurring within a time frame. For example, the earliest start for a tornado season was between March 1 and 10 and the latest start date for a tornado season occurred between September 11 and September 20 when one tornado was reported. This occurrence in 1976 also ties the record for the shortest tornado season since 1950, at one single day. Fourteen tornadoes have been reported between May 1 and May 10. |
 |
|||||||||||
| Dr. Ted Fujita developed the F-Scale in 1971 to provide a method to rate the intensity of tornadoes. The intent of the scale was to distinguish between weak and strong tornadoes. Dr. Fujita's scale was quickly accepted by the NWS and came into wide use by the mid-1970s. Values on the scale range from F0 for tornadoes producing minimal damage, to F5 for tornadoes causing devastating damage. A rough estimate of the wind speeds responsible for the damage could then be inferred using the F scale. In February 2006, this scale was modified and is now referred to as the "EF" scale, or Enhanced Fujita Scale. Sixty four tornadoes in the historical records were not assigned a rating, perhaps due to lack of information about the tornado. These unrated tornadoes are shown in the first column and labeled EF?. |  |
|||||||||||
|
This chart converts the EF ratings from the above chart into percentages. Weak tornadoes are rated EF0 or EF1. Strong tornadoes are rated EF2 or EF 3. Violent tornadoes are rated as EF4 or EF5. According to the chart, around 84 percent of all tornadoes that have occurred in the Tri-State area have been weak. This statistic is misleading since tornado ratings are based on observed damage. Tornadoes occurring in an open field where there are very few things to damage will receive an EF0 or EF1 rating, even though the tornado may have actually been strong or violent. Consequently, a tornado occurring in an urban area may receive a higher rating due to a higher amount of damage observed. |
 |
|||||||||||
|
The Goodland County Warning Area accounts for 19 counties across three different states. This chart shows the total number of tornadoes that have occurred in each county. Kit Carson County in Colorado takes the top position for having the most tornadoes (109) occurring since 1950. Sherman County Kansas comes in a close second place with 107 tornadoes and Yuma County Colorado rounds out the top three with 91 reported tornadoes. Dundy and Hitchcock counties in Nebraska have had the fewest tornado occurrences since 1950, with 26 and 27 tornado reports respectively. Notice that there are two Cheyenne counties listed on the chart. Cheyenne County Kansas is listed on the far left side of the chart and Cheyenne County Colorado is listed between Wichita and Kit Carson counties. |
 |
|||||||||||
|
The bar chart above can be misleading because the counties are not all equal size. For example, if County A is double the size of County B, a natural conclusion would be to assume that there will be a higher number of tornadoes reported in County A. In order to equalize the playing field and remove some of the county size bias, each county’s tornado count from the above bar chart was divided by the area of the county and normalized to 1000 square miles. This shows a more even distribution of tornadoes reported across each county. Sherman County Kansas still shows a considerably higher number of tornado reports. And no, the presence of the Doppler radar in Goodland is not to blame!
Updated: January 2025 |
|
|||||||||||


