Overview
|
Multiple rounds of heavy rain and thunderstorms impacted the lower Ohio Valley April 1-6, 2025. The first significant wave consisted of severe thunderstorms producing several tornadoes during the afternoon and evening on April 2nd. Flash flooding became a greater concern during the overnight as storms trained over the same locations. Over the next few days, waves of showers and storms rode along the frontal boundary bringing lots of rain which lead to widespread flash and areal flooding. Showers and storms came through daily, until the evening of April 6th. The resultant flooding turned into historic and near-record breaking river flooding along many river basins. Widespread flash flooding occurred over almost all of the area during rounds of heavy rain April 3-6. Numerous roads were closed across multiple counties including major highways in some areas. Multiple water rescues occurred especially over central Kentucky. Some mudslides and landslides also occurred as a result of copious amounts of rainfall. Unfortunately, 3 fatalities occurred in central Kentucky due to the dangerous flooding with 7 flood fatalities total across the state. Regional Summary of April 1-6, 2025 Severe Weather and Flooding ***This webpage is under construction.*** |
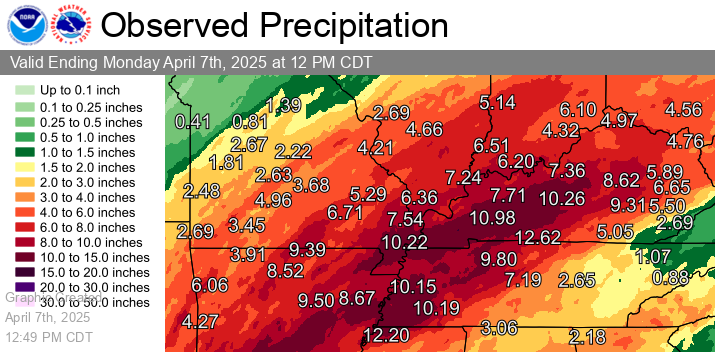 Observed Rainfall April 1-6, 2025 |
Flooding
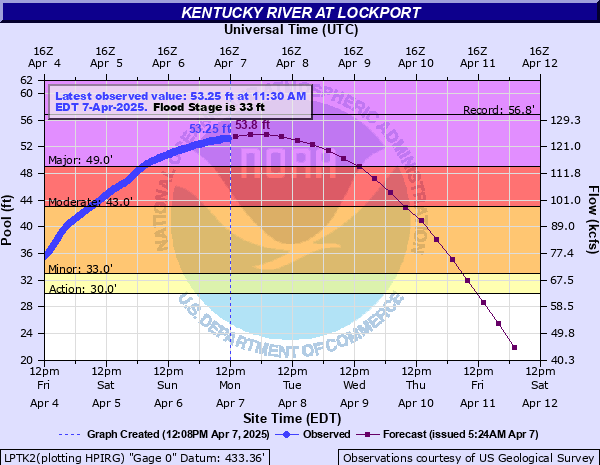
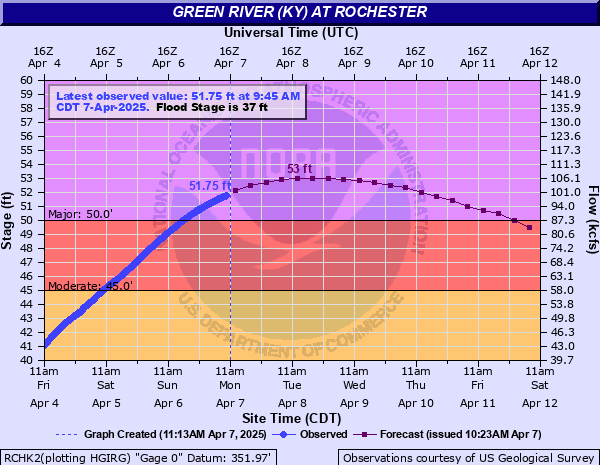
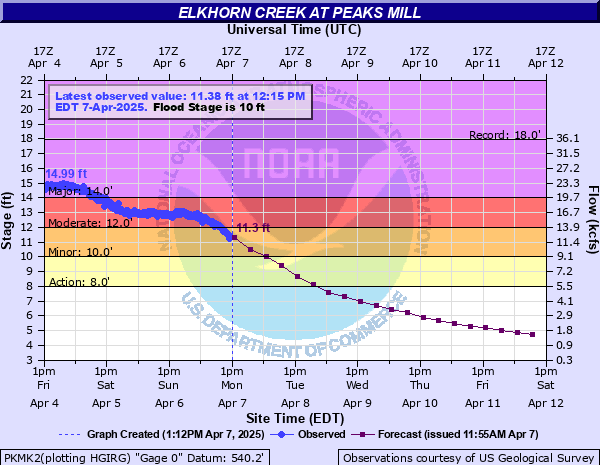
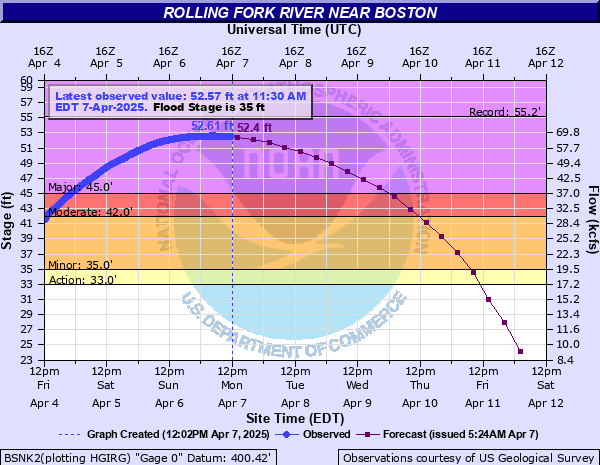
Hydrographs (Click on images to enlarge)

Major Flooding at these locations:
 |
 |
 |
 |
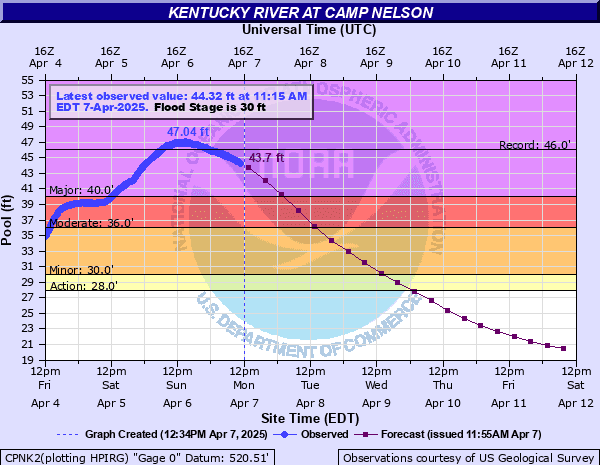
| Kentucky River - Camp Nelson, KY |
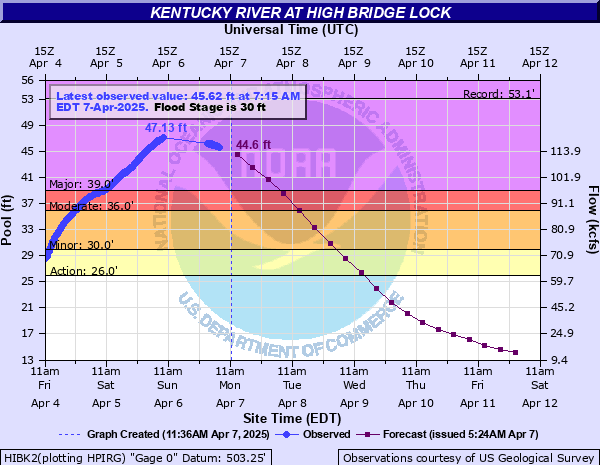
Kentucky River - High Bridge, KY |
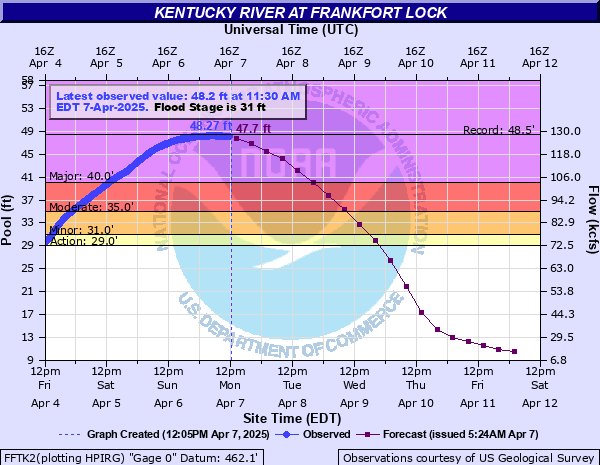
Kentucky River - Frankfort, KY |
Kentucky River - Lockport, KY |
 |
 |
 |
 |
| Green River - Woodbury, KY |
Green River - Rochester, KY |
Elkhorn Creek - Peaks Mill, KY |
Rolling Fork - Boston, KY |
Moderate Flooding at these locations:
 |
 |
 |
 |
| Ohio River - Clifty Creek, IN |
Ohio River - Louisville, KY (McAlpine Upper) | Ohio River - Louisville, KY (McAlpine Lower) | Ohio River - Cannelton, IN |
 |
 |
 |
 |
| Ohio River - Tell City, IN |
Salt River - Shepherdsville, KY |
Rough River - Dundee, KY |
Rough River - Rough River Lake, KY |
 |
 |
| Green River - Mammoth Cave, KY | Barren River - Bowling Green, KY |
Rain Reports
Click on images to enlarge:
 |
 |
| Rainfall Totals from Kentucky Mesonet | Regional Map of Rainfall Totals |
Quick links: Indiana | Kentucky
Indiana Rainfall Totals - April 1-7 (>6")
|
Name |
Station Type |
Total Precipitation |
|---|---|---|
| GALENA 4.3 ENE | CoCoRaHS | 10.04 |
| NEWBURGH 0.3 SE | CoCoRaHS | 9.55 |
| CANNELTON 6.8 NE | CoCoRaHS | 8.91 |
| NEWBURGH 1.3 ENE | CoCoRaHS | 8.75 |
| HENRYVILLE 2.6 E | CoCoRaHS | 8.62 |
| RUSHVILLE | COOP | 8.50 |
| LEOPOLD 1.7 ESE | CoCoRaHS | 8.47 |
| MILLTOWN 5.7 SSE | CoCoRaHS | 8.46 |
| EVANSVILLE 8.8 WSW | CoCoRaHS | 8.43 |
| GALENA 3.0 SE | CoCoRaHS | 8.41 |
| BOONVILLE 1S | COOP | 8.31 |
| ENGLISH 7.9 SSW | CoCoRaHS | 8.28 |
| J.T. MYERS LOCKS & DAM | COOP | 8.20 |
| TELL CITY | COOP | 8.08 |
| BOWLING GREEN 0.4 S | CoCoRaHS | 7.87 |
| CLARKSVILLE 2.3 N | CoCoRaHS | 7.83 |
| (KD9LES) GOSPORT 1.2 WNW | CoCoRaHS | 7.72 |
| NEW SALISBURY 1.2 WNW | CoCoRaHS | 7.70 |
| MILLTOWN 3.6 S | CoCoRaHS | 7.69 |
| MILLTOWN 6.1 SW | CoCoRaHS | 7.68 |
| EVANSVILLE 2.5 NE | CoCoRaHS | 7.68 |
| GREENVILLE 2.6 SSW | CoCoRaHS | 7.67 |
| FERDINAND 2.3 SSE | CoCoRaHS | 7.66 |
| SPENCER 7.0 S | CoCoRaHS | 7.63 |
| CLAY CITY 0.4 SE | CoCoRaHS | 7.63 |
| BROOKLYN 0.5 ENE | CoCoRaHS | 7.62 |
| ROCKPORT 4.0 WNW | CoCoRaHS | 7.57 |
| JEFFERSONVILLE 0.8 NW | CoCoRaHS | 7.56 |
| BOONVILLE 4.5 WSW | CoCoRaHS | 7.51 |
| JEFFERSONVILLE 1.6 ESE | CoCoRaHS | 7.41 |
| MARTINSVILLE 11.5 WNW | CoCoRaHS | 7.41 |
| BOONVILLE 1.4 N WBNL RADIO | CoCoRaHS | 7.38 |
| GOSPORT 4.2 E | CoCoRaHS | 7.33 |
| GOSPORT 4.0 WSW | CoCoRaHS | 7.33 |
| HYMERA 0.4 W | CoCoRaHS | 7.33 |
| BOONVILLE 2.4 N | CoCoRaHS | 7.30 |
| SHAKAMAK STATE PARK | COOP | 7.29 |
| CLIFTY CREEK | COOP | 7.27 |
| ELLETTSVILLE 2.7 NE | CoCoRaHS | 7.26 |
| POSEYVILLE 2.9 SSE | CoCoRaHS | 7.24 |
| SULLIVAN 0.5 SW | CoCoRaHS | 7.24 |
| BLOOMFIELD 4.5 ENE | CoCoRaHS | 7.23 |
| (KC9RPX)ELLETTSVILLE 0.5 W | CoCoRaHS | 7.22 |
| SPENCER 5.7 SE | CoCoRaHS | 7.22 |
| BLOOMFIELD 5.3 ESE | CoCoRaHS | 7.21 |
| (N9JPX)PARAGON 3.2 ENE | CoCoRaHS | 7.17 |
| NEW ALBANY 4.6 NE | CoCoRaHS | 7.15 |
| ELLETTSVILLE 5.8 SW | CoCoRaHS | 7.08 |
| MILLTOWN 3.7 WSW | CoCoRaHS | 7.07 |
| EVANSVILLE 6.7 NW | CoCoRaHS | 7.05 |
| MOUNT VERNON 10.6 ENE | CoCoRaHS | 7.05 |
| GREENFIELD 1.5 S | CoCoRaHS | 7.04 |
| NEW PALESTINE 1.2 NW | CoCoRaHS | 7.00 |
| CHARLESTOWN 2.6 N | CoCoRaHS | 7.00 |
| EVANSVILLE 5.4 NNE | CoCoRaHS | 7.00 |
Kentucky Rainfall Totals - April 1-7 (>8")
|
Name |
Station Type |
Total Precipitation |
|---|---|---|
| MAYFIELD 2N | COOP | 15.64 |
| GREENVILLE 6.2 WSW | CoCoRaHS | 15.31 |
| EDDYVILLE 2.0 NNE | CoCoRaHS | 14.99 |
| EDDYVILLE 11.5 SSE | CoCoRaHS | 14.70 |
| GRAND RIVERS 3.9 S | CoCoRaHS | 14.63 |
| EDDYVILLE 11.6 SSE | CoCoRaHS | 14.51 |
| EDDYVILLE 5S | COOP | 14.34 |
| CROFTON 3N | COOP | 14.16 |
| LEWISBURG 0.2 E | CoCoRaHS | 13.84 |
| FULTON 3.3 NE | CoCoRaHS | 13.78 |
| CROFTON 0.3 W | CoCoRaHS | 13.52 |
| EDDYVILLE 5.9 SE | CoCoRaHS | 13.50 |
| CALVERT CITY 2.5 SSW | CoCoRaHS | 13.32 |
| GREENVILLE 0.3 ESE | CoCoRaHS | 13.18 |
| BOWLING GREEN WKU | COOP | 13.11 |
| WOODBURY 4.1 SW | CoCoRaHS | 13.06 |
| CADIZ | COOP | 12.75 |
| NOLIN RIVER LAKE | COOP | 12.38 |
| SEDALIA 5.0 SE | CoCoRaHS | 12.34 |
| SONORA 2.7 SE | CoCoRaHS | 12.30 |
| HOPKINSVILLE 0.3 NW | CoCoRaHS | 12.15 |
| NEW HAVEN 6.4 NE | CoCoRaHS | 12.15 |
| FARMINGTON 5.6 S | CoCoRaHS | 12.13 |
| KUTTAWA 3.4 NW | CoCoRaHS | 12.05 |
| FULTON 5.0 W | CoCoRaHS | 12.04 |
| MILLERSTOWN 4E | COOP | 11.96 |
| RUSSELLVILLE | COOP | 11.92 |
| BOWLING GREEN | COOP | 11.88 |
| BOWLING GREEN 6.2 WSW | CoCoRaHS | 11.85 |
| BEAVER DAM 0.6 NW | CoCoRaHS | 11.49 |
| RUSSELLVILLE 5.8 NE | CoCoRaHS | 11.48 |
| RUSSELLVILLE 6.6 N | CoCoRaHS | 11.42 |
| SMITHS GROVE 0.3 SE | CoCoRaHS | 11.34 |
| RUSSELLVILLE 1.3 NNE | CoCoRaHS | 11.31 |
| BOWLING GREEN 0.7 WSW | CoCoRaHS | 11.20 |
| ELIZABETHTOWN 1.8 SE | CoCoRaHS | 11.09 |
| HARRODSBURG 10.8 NW | CoCoRaHS | 11.07 |
| ROCKFIELD 3.0 N | CoCoRaHS | 10.91 |
| MADISONVILLE 1.6 NE | CoCoRaHS | 10.68 |
| ABERDEEN | COOP | 10.67 |
| PARIS | COOP | 10.61 |
| BOWLING GREEN WARREN COUNTY AP | WBAN | 10.48 |
| HERNDON 5S | COOP | 10.45 |
| ELIZABETHTOWN 6.5 N | CoCoRaHS | 10.42 |
| KEVIL 4.6 NW | CoCoRaHS | 10.39 |
| ELIZABETHTOWN 7.9 ENE | CoCoRaHS | 10.32 |
| SPRINGFIELD 1.7 N | CoCoRaHS | 10.22 |
| AUBURN 0.3 SW | CoCoRaHS | 10.20 |
| KNOB LICK 4S | COOP | 9.95 |
| ROCHESTER FERRY | COOP | 9.90 |
| ELIZABETHTOWN 2.3 N | CoCoRaHS | 9.79 |
| LEXINGTON-FAYETTE 6.3 S | CoCoRaHS | 9.76 |
| HANSON 2.2 NE | CoCoRaHS | 9.70 |
| DANVILLE 1.2 NE | CoCoRaHS | 9.63 |
| MARION 1 SSW | COOP | 9.60 |
| LIBERTY 1.1 SE | CoCoRaHS | 9.59 |
| MCDANIELS | COOP | 9.57 |
| TRENTON 2.3 SSW | CoCoRaHS | 9.54 |
| NICHOLASVILLE 1.2 SE | CoCoRaHS | 9.44 |
| BARDSTOWN 4.6 NW | CoCoRaHS | 9.43 |
| BRADFORDSVILLE 8.5 ENE | CoCoRaHS | 9.41 |
| GLASGOW 2.1 NE | CoCoRaHS | 9.41 |
| OLMSTEAD 2.9 N | CoCoRaHS | 9.37 |
| HENDERSON 0.4 SSW | CoCoRaHS | 9.36 |
| CORNERS | COOP | 9.35 |
| BOWLING GREEN 4.3 S | CoCoRaHS | 9.30 |
| LAWRENCEBURG 5.2 S | CoCoRaHS | 9.24 |
| GUTHRIE 0.8 WNW | CoCoRaHS | 9.17 |
| CALHOUN 6.4 E | CoCoRaHS | 9.17 |
| LEBANON 5.6 E | CoCoRaHS | 9.17 |
| PADUCAH 1.3 W | CoCoRaHS | 9.14 |
| DIX DAM | COOP | 9.11 |
| PADUCAH 8.5 WSW | CoCoRaHS | 9.10 |
| SHEPHERDSVILLE 3.2 ENE | CoCoRaHS | 9.04 |
| MASONVILLE 6.0 SSE | CoCoRaHS | 8.96 |
| CALHOUN 4ENE | COOP | 8.91 |
| CALHOUN 6.2 N | CoCoRaHS | 8.80 |
| LAWRENCEBURG 9.0 WNW | CoCoRaHS | 8.80 |
| WEST PADUCAH 3.1 SSW | CoCoRaHS | 8.72 |
| FRANKFORT 3.3 NE | CoCoRaHS | 8.69 |
| LEXINGTON 4.3 W | CoCoRaHS | 8.66 |
| KEVIL 5.7 NNW | CoCoRaHS | 8.64 |
| LEXINGTON 1.7 SSE | CoCoRaHS | 8.63 |
| FRANKFORT 3NE | COOP | 8.63 |
| UTICA 5.4 ESE | CoCoRaHS | 8.61 |
| WARSAW MARKLAND DAM | COOP | 8.60 |
| STEPHENSPORT 8.0 N | CoCoRaHS | 8.60 |
| FOX CHASE 1.4 W | CoCoRaHS | 8.58 |
| OAK GROVE 4.6 NW | CoCoRaHS | 8.56 |
| BEREA 1.9 SE | CoCoRaHS | 8.56 |
| HENDERSON 4.5 S | CoCoRaHS | 8.54 |
| MASONVILLE 0.8 ENE | CoCoRaHS | 8.52 |
| FRANKFORT 5.0 SW | CoCoRaHS | 8.47 |
| UTICA 0.0 W | CoCoRaHS | 8.47 |
| SHEPHERDSVILLE 5NE | COOP | 8.42 |
| LEXINGTON 6.6 S | CoCoRaHS | 8.41 |
| REYNOLDS STATION 2.5 SSW | CoCoRaHS | 8.40 |
| GEORGETOWN 1.2 N | CoCoRaHS | 8.37 |
| LEXINGTON 4.5 SSW | CoCoRaHS | 8.35 |
| LOUISVILLE 8.3 ESE | CoCoRaHS | 8.31 |
| SCOTTSVILLE 4.9 NE | CoCoRaHS | 8.29 |
| MASONVILLE 0.7 NW | CoCoRaHS | 8.28 |
| SCOTTSVILLE 5.5 N | CoCoRaHS | 8.27 |
| BEREA 3.2 W | CoCoRaHS | 8.25 |
| FRANKFORT 1.8 ENE | CoCoRaHS | 8.25 |
| OWENSBORO 4.4 ESE | CoCoRaHS | 8.24 |
| DANVILLE | COOP | 8.18 |
| WEST PADUCAH 2W | COOP | 8.18 |
| LEXINGTON 3.7 WSW | CoCoRaHS | 8.18 |
| PADUCAH BARKLEY REGIONAL AP | WBAN | 8.16 |
| Paducah Area | ThreadEx | 8.16 |
| GEORGETOWN 7.2 ENE | CoCoRaHS | 8.15 |
| MASONVILLE 0.1 SSE | CoCoRaHS | 8.15 |
| LEXINGTON BLUE GRASS ARPT | WBAN | 8.14 |
| Lexington Area | ThreadEx | 8.14 |
| SCOTTSVILLE 1.6 NE | CoCoRaHS | 8.09 |
| LAWRENCEBURG 0.4 NNW | CoCoRaHS | 8.06 |
| FRANKFORT CAPITAL CITY AP | WBAN | 8.05 |
| FRANKFORT 1.5 ENE | CoCoRaHS | 8.03 |
| BRADFORDSVILLE 6.8 S | CoCoRaHS | 8.03 |
| LEXINGTON 5.1 ESE | CoCoRaHS | 8.02 |
| GEORGETOWN 1.0 NW | CoCoRaHS | 8.01 |
Records
|
Rainfall Records |
|||
|
New 4 Day Rainfall Record at Bowling Green, KY - 10.04" Old Record: 9.67" ending May 2/3/4, 2010 |
|||
|
More than 2" of rain fell Three Consecutive Days in a Row at Louisville & Bowling Green, KY. This has never happened at Louisville and has only happened one other time at Bowling Green (Jan 21-23, 1937). |
|
River Locations within their Top 3 Highest Recorded River Crests* |
|||
|
Site |
April 2025 Peak Crest (Date) |
Preliminary Rank of April 2025 Crest |
Record Crest (Date) |
|
47.04 ft (April 6) |
1 |
46.02 ft (May 3, 2010) |
|
|
47.13 ft (April 6) |
3 |
53.10 ft (December 8, 1978) |
|
|
53.50 ft (April 7) |
3 |
56.85 ft (January 26, 1973) |
|
|
48.27 ft (April 7) |
2 |
48.47 ft (December 10, 1978) |
|
|
53.3 ft (April 8) |
3 |
61.60 ft (January 27, 1937) |
|
* All river data is preliminary at this time.
Quick links: Kentucky River | Rolling Fork | Rough River | Green River
Ohio River
| Louisville, KY April 8, 2025 Courtesy of Ben Childers Photography |
Louisville, KY April 9, 2025 Courtesy of Live Storms Media |
| Louisville, KY April 8, 2025 (West side near Shawnee Golf Course) Courtesy of WLKY News |
Louisville, KY April 8, 2025 (Shippingport Island) Courtesy of WLKY News |
| Louisville, KY April 8, 2025 (Harrods Creek) Courtesy of Aerial Photography Louisville |
Louisville, KY April 7, 2025 (Coxs Park area) Courtesy of Aerial Photography Louisville |
| Westpoint, KY April 9, 2025 approx. 8:40-9:07 am EST NWS Louisville Drone Survey |
Madison, IN April 8, 2025 approx. 2:30-3:00 pm EST Hanover Beach, IN April 9, 2025 approx. 1:00-1:30 pm EST Courtesy of Jefferson County, IN EMA |
| Utica, IN April 7, 2025 Courtesy of Ben Childers Photography |
Utica & New Albany, IN April 8, 2025 Courtesy of Mosier Works |
| Charlestown, IN April 10, 2025 Courtesy of Clark County Emergency Management and Clark County Sheriff's Office |
Jeffersonville/Clarksville/New Albany, IN April 8, 2025 Courtesy of Roger Turpen |
| Cannelton, IN April 8, 2025 approx. 3:00-6:00 pm CDT Courtesy of Construction Engineering Solutions and Construction Technology Solutions |
Tell City, IN April 8, 2025 approx. 3:00-6:00 pm CDT Courtesy of Construction Engineering Solutions and Construction Technology Solutions |
| Troy, IN April 8, 2025 approx. 3:00-6:00 pm CDT Courtesy of Construction Engineering Solutions and Construction Technology Solutions |
| Frankfort, KY April 7, 2025 Courtesy of Frankfort Police Department |
Lockport, KY April 8, 2025 approx. 11:18-11:42 am EST NWS Louisville Drone Survey |
| Coming Soon! (source) |
Coming Soon! (source) |
| Dundee, KY April 9, 2025 approx. 9:37-9:47 am CST NWS Louisville Drone Survey |
Hartford, KY April 9, 2025 approx. 10:29-10:33 am EST NWS Louisville Drone Survey |
| Woodbury, KY April 10, 2025 approx. 8:56-10:02 am CST NWS Louisville Drone Survey |
Rochester, KY April 10, 2025 approx. 10:49-11:42 am CST NWS Louisville Drone Survey |
Photos
.jpg) |
 |
 |
 |
| Frankfort, KY | Morgantown, KY | Ohio River at Tell City | Hawesville, KY |
 |
 |
 |
 |
| US 68 in Jessamine County, KY (KYWXChaser859 on X) |
Louisville, KY (Joel Schipper, WDRB) |
Kentucky River at Lockport | Russell County, KY |
Environment
The mid to upper level pattern consisted of broad southwesterly flow across the Ohio and Tennessee Valley's in between a large scale trough across the western U.S. and ridging located along the southeast coast.
 |
 |
 |
 |
| 500mb chart - 7 PM April 2 | 500mb chart - 7 PM April 3 | 500mb chart - 7 PM April 4 | 500mb chart - 7 PM April 5 |
A cold front was located to our west on the afternoon of April 2nd. It would then make passage and become positioned to our south on the 3rd before lifting back north into western Kentucky and the Missouri bootheel on the 4th. The boundary would shift south of our area again on the 5th.
 |
 |
 |
 |
| Mean Sea Level Pressure - 4 PM April 2 | Mean Sea Level Pressure - 1 AM April 4 | Mean Sea Level Pressure - 7 PM April 4 | Mean Sea Level Pressure - 1 PM April 5 |
Low level moisture transport was quite anomalously through the 4 day period. The 850mb front remained draped over the region from April 3-5, even while the surface front largely remained south of the area during these periods.
 |
 |
 |
 |
| 850mb Moisture Transport - 4 PM April 2 | 850mb Moisture Transport - 7 PM April 3 | 850mb Moisture Transport - 7 PM April 4 | 850mb Moisture Transport - 2 PM April 5 |
Precipitable water values ranged from 1.5 to 1.9" through the period, which was greater than the 99th percentile for this time of the year. This allowed thunderstorms to be very efficient rainfall producers as they continued to train across the same areas.
 |
 |
 |
 |
| Precipitable Water - 7 PM April 2 | Precipitable Water - 1 AM April 4 | Precipitable Water - 1 AM April 5 | Precipitable Water - 4 PM April 5 |
These are just a few of the numerous mesoscale precipitation discussions that were in effect across our region during this 4 day period.
 |
 |
 |
 |
| WPC Mesoscale Precipitation Discussion on April 2 | WPC Mesoscale Precipitation Discussion on April 3 | WPC Mesoscale Precipitation Discussion on April 4 | WPC Mesoscale Precipitation Discussion on April 5 |
Service
Our office started messaging the heavy rain potential a week before the event unfolded. Forecast rainfall amounts were in the 6 to 8" range 5 days before the event began and then continued to trend upwards into the 8-10" range over central Kentucky.
 |
 |
| Forecast Graphic issued by NWS Louisville the morning of March 29th | Forecast Graphic issued by NWS Louisville the morning of March 31st. |
The Weather Prediction Center outlooked our region in a moderate risk for excessive rainfall on April 2nd. This was followed by 3 straight days where a moderate-high risk excessive rainfall outlook was in effect for some part of our forecast area from April 3-5.
 |
 |
 |
 |
| WPC Day 1 Excessive Rainfall Outlook valid for April 2 | WPC Day 1 Excessive Rainfall Outlook valid for April 3 | WPC Day 1 Excessive Rainfall Outlook valid for April 4 | WPC Day 1 Excessive Rainfall Outlook valid for April 5 |
NWS Louisville also did multiple conference calls and video briefings leading up to and during this historic event. Below are recordings of some of those briefings:
| April 2, 2025 6am Briefing | April 2, 2025 4pm Briefing |
| April 4, 2025 930am Briefing | April 5, 2025 9am Briefing |
Additional
Kentucky Impacts
How rare was this rainfall event?

 |
Media use of NWS Web News Stories is encouraged! Please acknowledge the NWS as the source of any news information accessed from this site. |
|


 Weather Story
 Weather Map
 Local Radar