 |
2011:
WEATHER OF WEST TEXAS |
 |
|
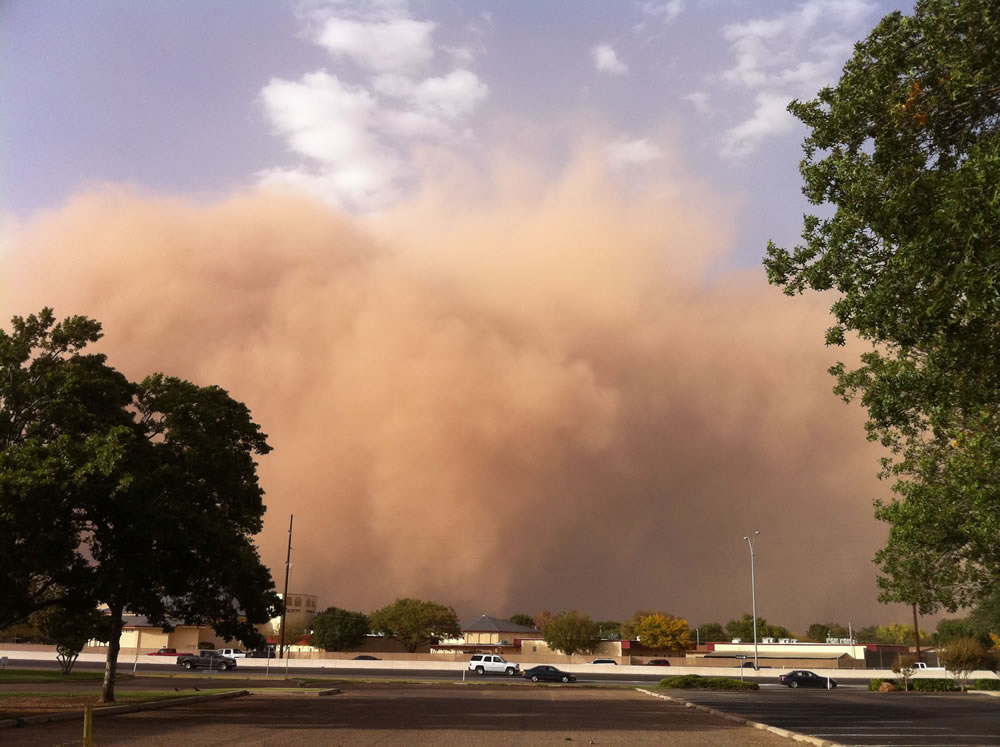
Haboob moving through Lubbock -
17 October 2011 |
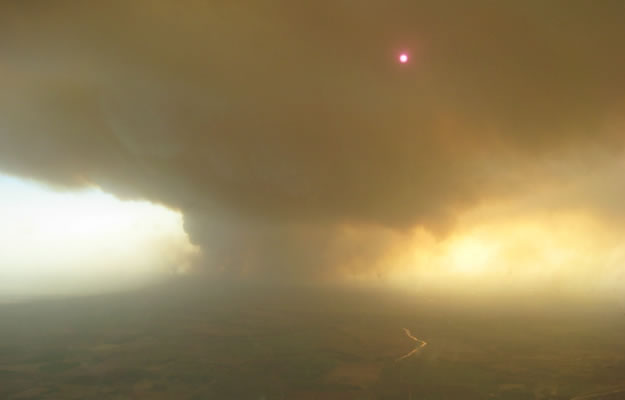
Swenson Wildfire - 7 April 2011 |
|
|
The year-long drought was further exacerbated by an extremely hot summer, making for an oppressive feedback loop. Both Lubbock and Childress recorded a record 100 straight days with highs at or above 90°F, from May 27th through September 3rd. Childress also recorded an amazing 50 straight days at or above the century mark, from June 22nd through August 10th. These incredible temperatures, not surprisingly, resulted in both Lubbock and Childress having their hottest summers on record. The extremely dry and hot conditions caused many crops to fail and resulted in a major hardship for farmers and ranchers alike across most of the southern plains. In addition, the drought, followed on the heels of a wet 2010, was the perfect sequence of events for an extreme year in fire weather. When winds increased and the relative humidity plunged, abundant drought-stressed plants (grasses, shrubs and trees) provided a receptive source for wildfires. The wildfire season kicked off in earnest February 27th, when one large rapidly moving fire threatened the town of Matador. Numerous other large and long burning wildfires visited the region well through the spring months. The background drought also had a hand in a very impressive dust storm, known as a haboob, which raked the area on October 17th. The hot and dry conditions baked the soil and caused much of the ground cover to die or go dormant, exposing plentiful amounts of topsoil. Then, on the 17th, a strong cold front with winds well in excess of 50 mph plunged southward across the South Plains. The strong winds lofted copious amounts of topsoil and sent a wall of dust racing southward over the Caprock. Although haboobs are not uncommon in this area, they are often associated with strong thunderstorm outflows. However, this haboob was more reminiscent of the Dust Bowl days when dry cold fronts propelled walls of dust across the plains.
|
||
|
|
|
This map displays the 2011 year precipitation totals. The map was created with data gathered from the NWS Cooperative observers and the West Texas Mesonet. Click on the map to view a full-sized version.
|
The above map shows that less than 10 inches of total rainfall was commonplace for much of the region this drought-stricken year. Several locations across the southwest South Plains into the northern Permian Basin received less than 3 inches of rain for the entire year. The "wet" spot in 2011 was over the southeast Texas Panhandle into the northern Rolling Plains where double digit rain totals were observed. The map below shows the percentage of precipitation that fell in 2011 versus an average year. The percentage ranges from about 65% in the southeast Texas Panhandle to only about 18 percent across parts of Gaines and Dawson counties! Almost all of NWS Lubbock's forecast area was under 60%, with a majority under 40 percent of average.
|
|
| This map shows the 2011 rainfall as a percent of the 30-year normal rainfall (1971-2000). Also plotted is the rainfall observed, in inches, at each collection site. Please click on the map to view a full-sized version. If you would like to see the precipitation as a departure from normal please CLICK HERE. |
Below are some statistics from 2011 for Lubbock:
The year of 2011 will go down in the books as being the driest year on record and second warmest year on record. It took until May 11 for the rain gauge to collect over one inch of rain, and another four months (during the typical wettest part of the year) to push the yearly rain totals over two inches. This included a June, on average the wettest month of the year, with no measurable precipitation. The rain (and snow) finally began to fall more regularly in the late fall and early winter months. In fact, December 2011 was the first (and only) month to finish with precipitation above normal.
Lubbock recorded an astounding (and record) 48 100-degree days in 2011, including a stretch of 9 in a row in early August and 7 in a row in late June. In addition, the mercury exceeded the 90-degree mark 131 times (previous record was 122 times, set in 1956), including 100 straight days from late May into early September (previous record was 81 straight days, set in 1934). The highest temperature of the year was 112 degrees, recorded on June 26th. This was the second hottest day ever observed in Lubbock since records began in 1911. The all-time record is 114 degrees, set on June 27th, 1994.
On the other extreme, the coldest temperature recorded for the year was a bone-chilling 2 degrees on February 2nd. Additionally, six other days in early February saw lows in the single digits, thanks to two blasts of Arctic air. This led to a cold first half of February, though the pendulum swung the other way for the second half of the month and didn't look back after that.
Twenty-one record highs were tied or set in 2011: 85 degrees on February 16th; 90 degrees on March 17th; 92 degrees on April 2nd; 94 degrees on April 3rd; 97 degrees on April 29th; 97 degrees on May 9th; 104 degrees on May 28th and 29th; 105 degrees on June 13th; 108 degrees on June 16th; 107 degrees on June 19th; 110 degrees on June 25th; 112 degrees on June 26th; 102 degrees on August 5th and 6th; 103 degrees on August 9th; 104 degrees on August 10th; 103 degrees on August 28th; 104 degrees on August 30th; 97 degrees on September 29th; and 76 degrees on December 31st. No record lows were set in 2011, though many record high minimums were tied or eclipsed.
|
LUBBOCK
|
Average High
|
Average Low
|
Precip (inches)
|
|
January
|
57.0
|
22.5
|
0.06
|
|
February
|
58.5
|
25.0
|
0.43
|
|
March
|
72.9
|
38.2
|
0.35
|
|
April
|
82.5
|
48.3
|
0.00
|
|
May
|
87.0
|
54.5
|
0.26
|
|
June
|
100.8
|
70.9
|
0.00
|
|
July
|
99.2
|
72.9
|
0.05
|
|
August
|
99.2
|
72.7
|
0.34
|
|
September
|
86.2
|
57.4
|
1.25
|
|
October
|
76.9
|
47.8
|
1.34
|
|
November
|
64.3
|
37.1
|
0.26
|
|
December
|
47.0
|
28.9
|
1.52
|
|
Annual
|
77.7 (4th warmest)
|
48.1
|
5.86 (record)
|
|
Normal
|
74.3
|
47.0
|
19.12
|
|
Departure
|
+3.4
|
+1.1
|
-13.26
|
The top portion of the graph below shows the daily high and low temperature and precipitation distribution for 2011 at Lubbock Preston Smith International Airport. Aside for a short stretch in January, the first part of February, portions of May and much of December, when temperatures are near or below average, most of the remainder of the year is marked by temperatures at or well above normal. Particularly striking is the June through August period in which temperatures are well above normal with no notable breaks in the heat.
 |
| (Top) Plot of the maximum and minimum temperatures (connected by a black line) observed at the Lubbock Preston Smith International Airport in 2011. Also plotted are the respective normals (green - range of average highs and lows) and record highs (red) and record lows (blue) for each date. Units are in degrees Fahrenheit. (Bottom) Plot of the rain accumulation (green), in inches, observed at the Lubbock Preston Smith International Airport in 2011. Also plotted is the distribution of the average rainfall (brown). Click on the graph for a larger view. |
The lower portion of the graph above shows how slow precipitation was to accumulate at Lubbock in 2011. The first half of the year was nearly flat-lined, with only a slight upward trend through the last several months as a number of bouts of light to moderate precipitation impacted Lubbock. Overall, 2011 easily finished as the driest year on record (5.86 inches total) at Lubbock, shattering the previous record that was in place since 1917 (8.73 inches).
 |
| The graph above shows a 10-day running mean of the average daily temperature at Lubbock as a departure from the 1981-2010 normals. Click on the graph for a larger view. |
The above graph shows the departure of the average daily temperature at Lubbock from the 30-year average. A 10-day running mean is used to smooth out the individual daily fluctuations. This graph clearly illustrates how much of 2011 was much above average.
 |
2011 EXTREME WEATHER EVENTS
|
 |
|
Radar view of a thunderstorm over Lubbock - |
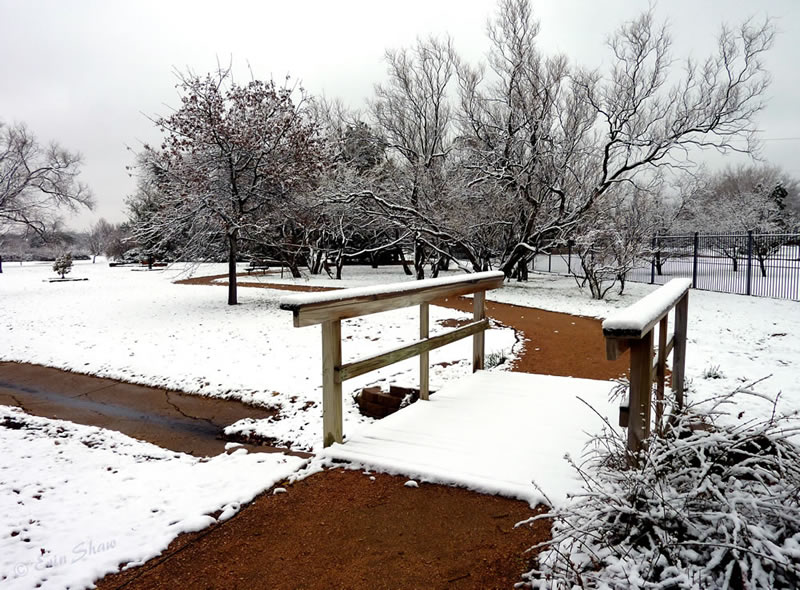
Christmas Snow in Lubbock -
25 December 2011 |
The hot and drought-stricken year of 2011 produced a relative dearth in severe weather, with an overall lack of showers and thunderstorms visiting the area. However, as the map below shows, a number of high impact weather-related events (in addition to the drought and heat) did affect the region in 2011.
In addition, 4 tornadoes were observed across to the Lubbock County Warning Area (CWA) in 2011. Of the 4 tornadoes, all were very brief and did little or no damage. All but one of the tornadoes were of the landspout (non-mesocyclone) variety. The one supercell that produced a brief tornado in the Lubbock CWA in 2011 occurred on March 19th to the northeast of Abernathy (Hale County). The remaining brief and weak landspout tornadoes occurred: April 26th west of Baileyburo (Bailey County); August 6th northwest of Newlin (Hall County); and August 25th east of Wolfforth (Lubbock County).
|
|
|
Map displaying many of the more notable weather impacts to the region in 2011. Click on the image for a bigger view. |
MONTHLY 2011 HIGHLIGHTS:
| JANUARY: |
| FEBRUARY : |
| MARCH: |
| APRIL: |
| MAY: |
| JUNE: |
| JULY: |
|
AUGUST:
|
| SEPTEMBER: |
| OCTOBER: |
| NOVEMBER: |
| DECEMBER: |


 Follow us on YouTube