Middle Atlantic RFC
River Forecast Center
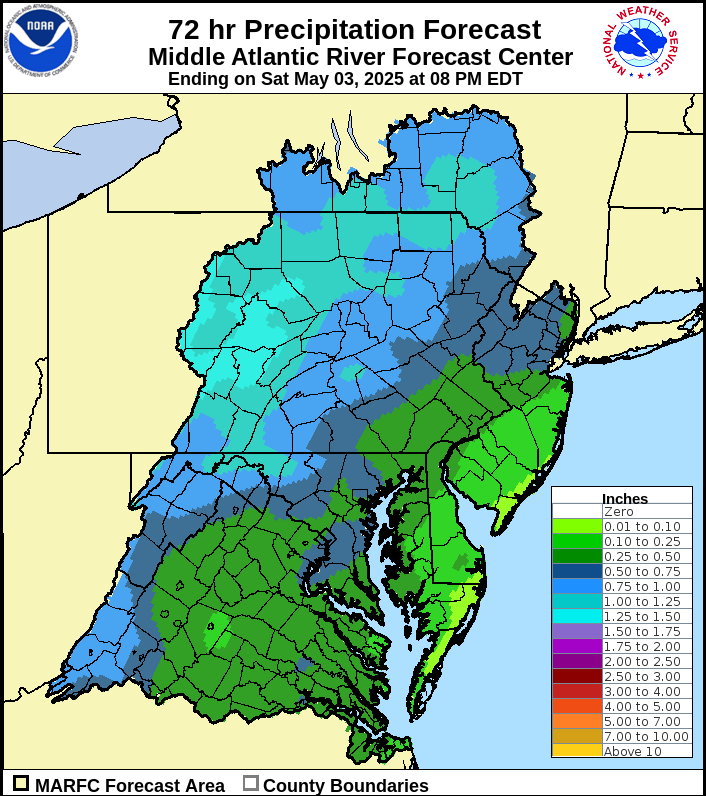
Gridded Precipitation ForecastsClick on images to enlarge |
||
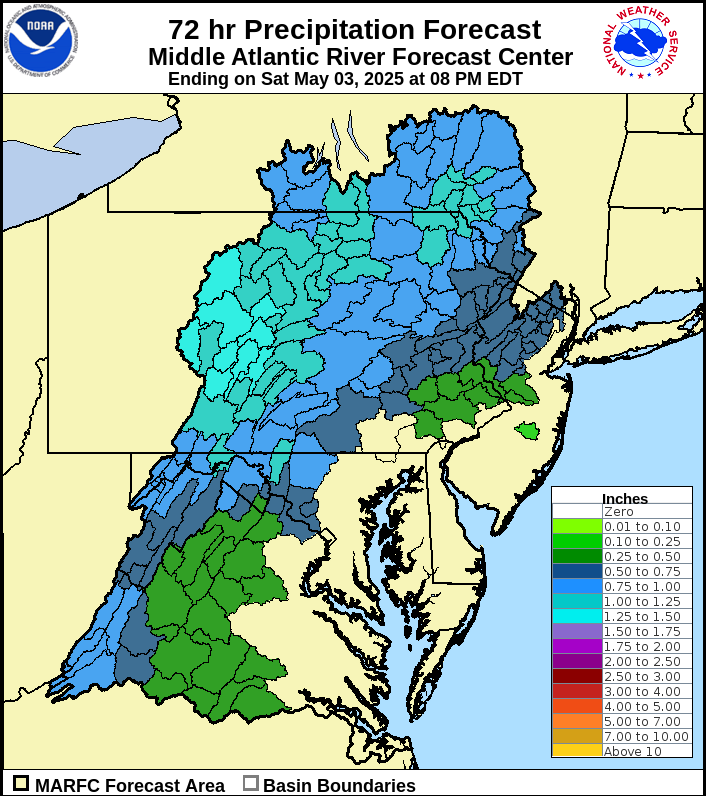
| 72 Hour Total | ||
 |
||
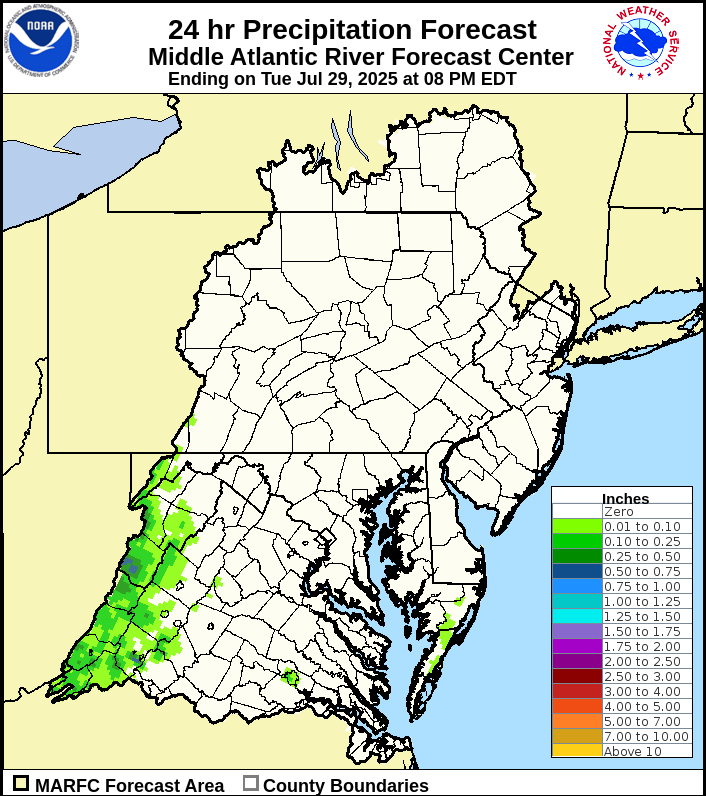
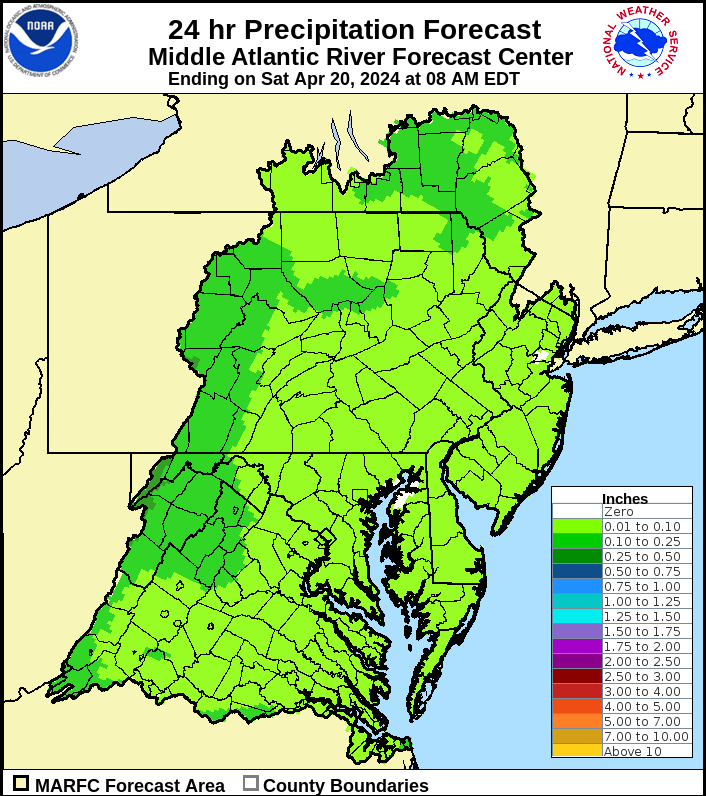
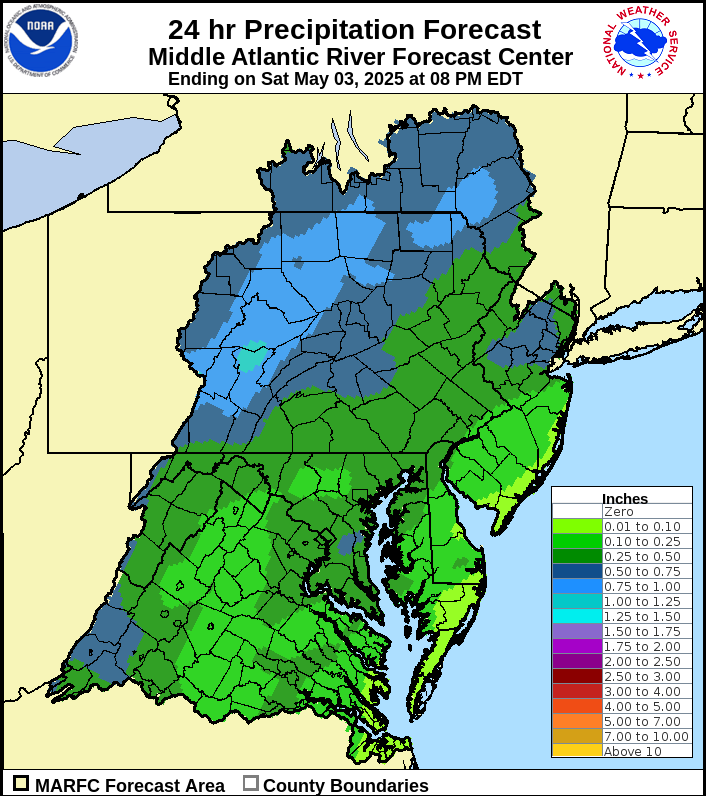
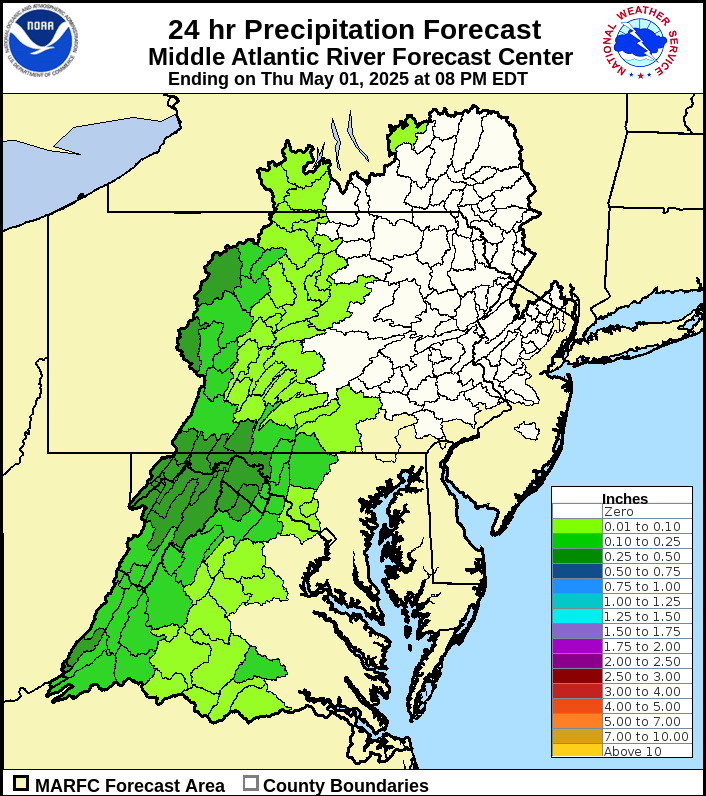
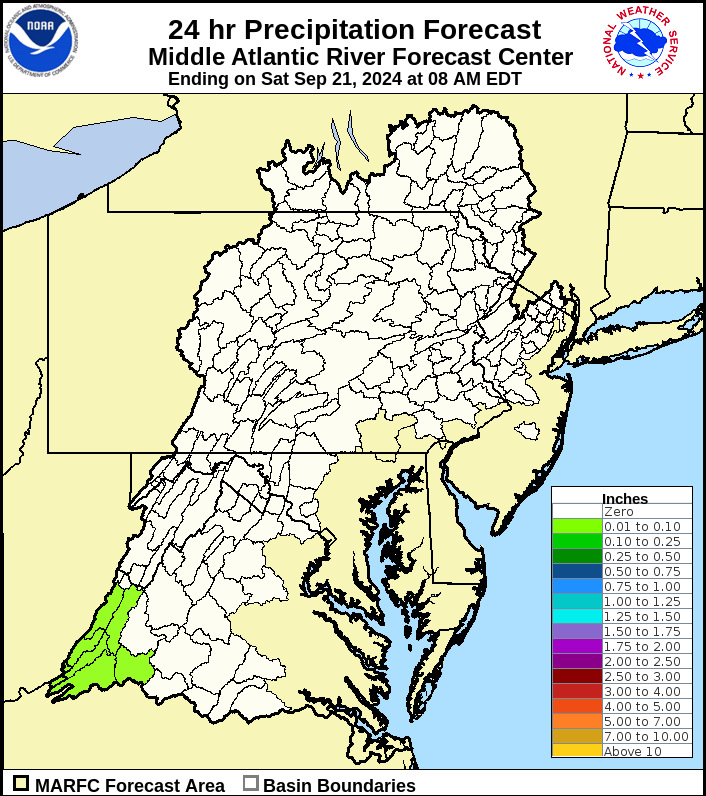
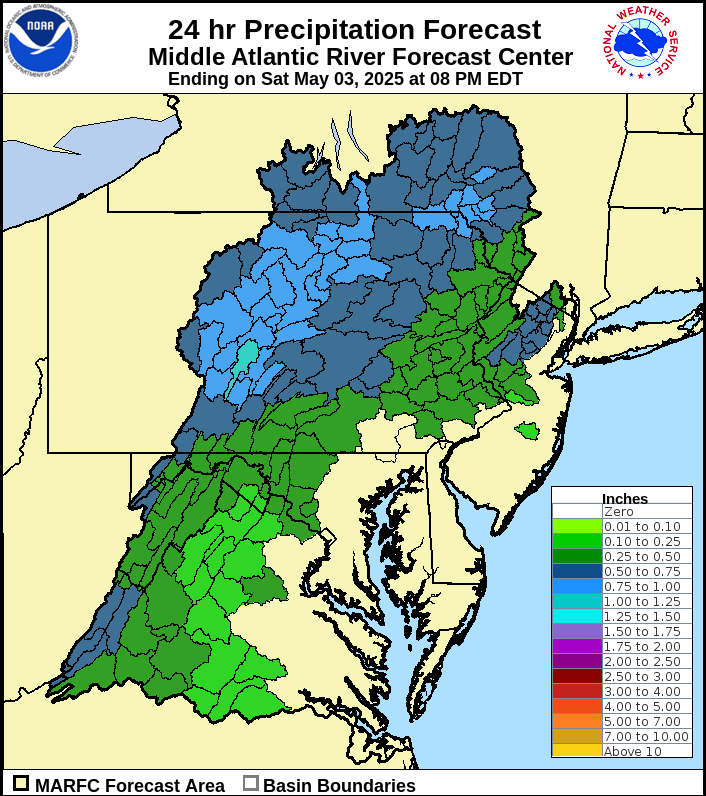
| Day One Total | Day Two Total | Day Three Total |
 |
 |
 |
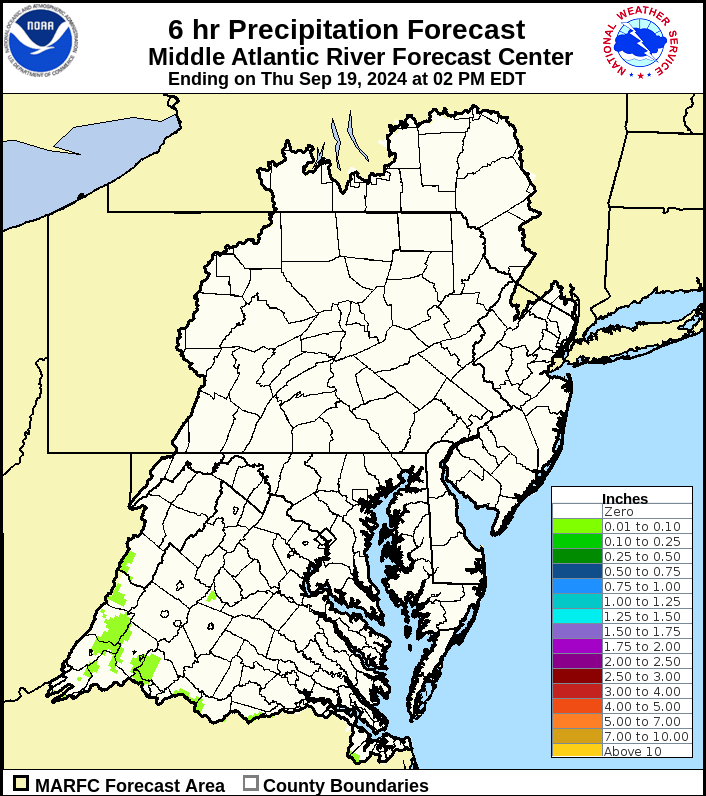
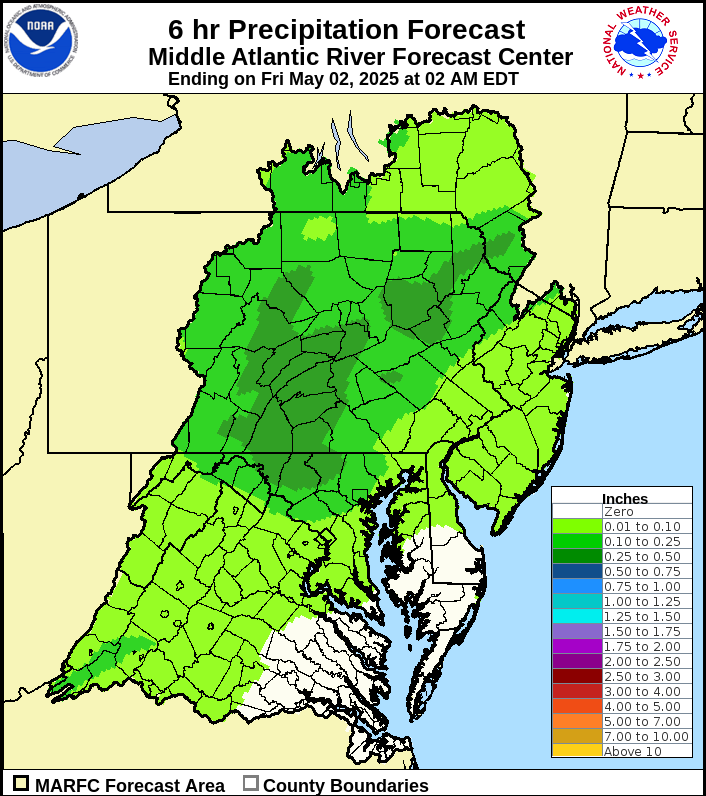
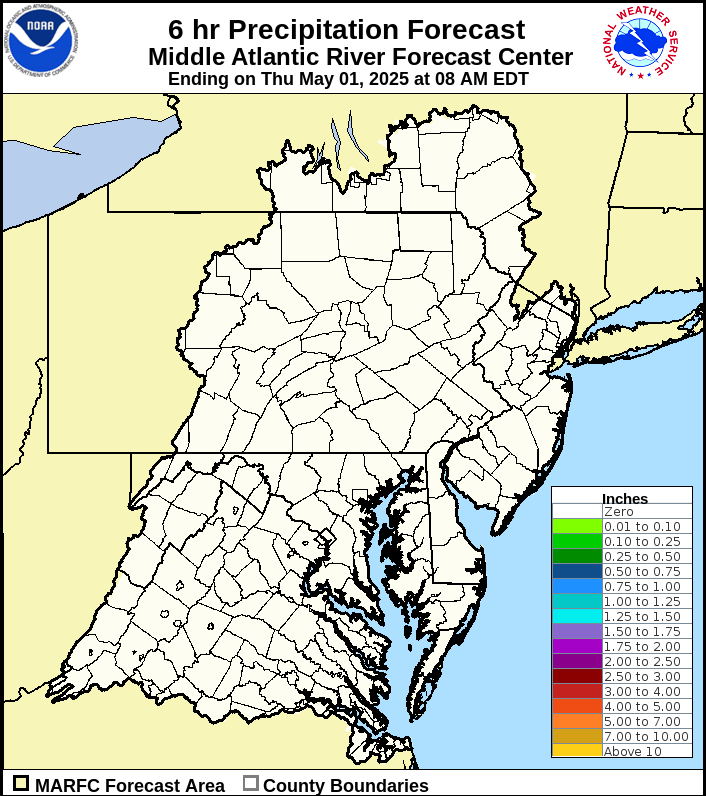
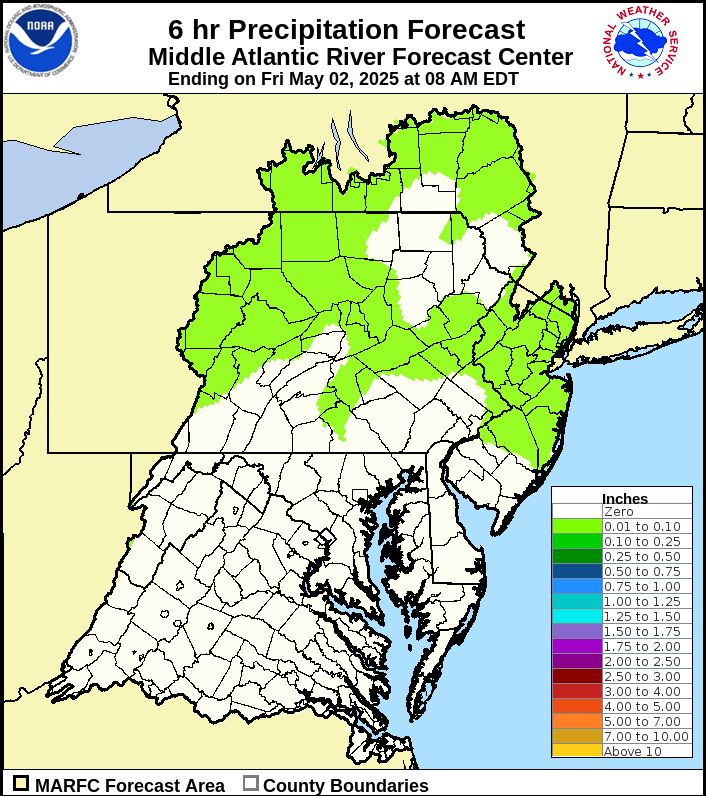
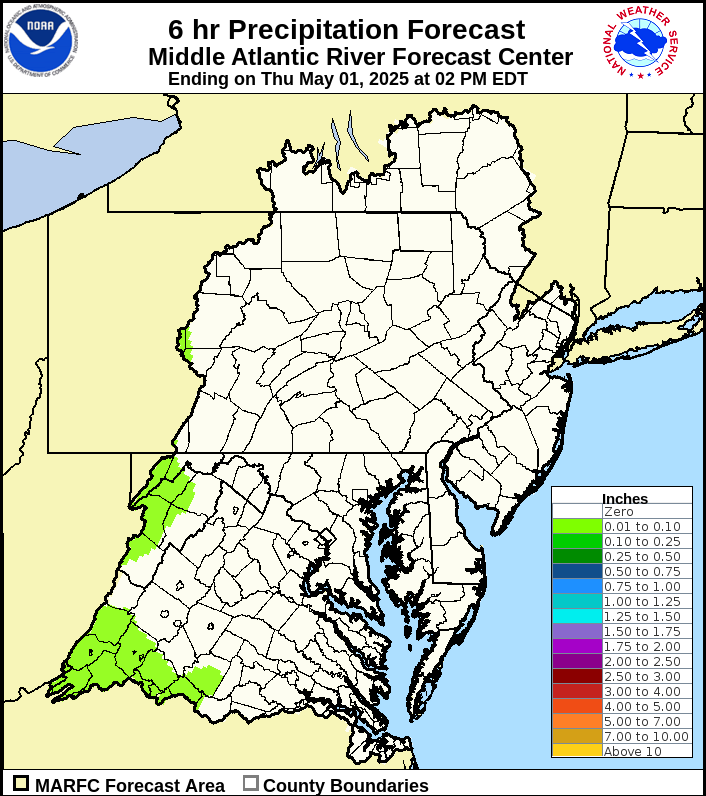
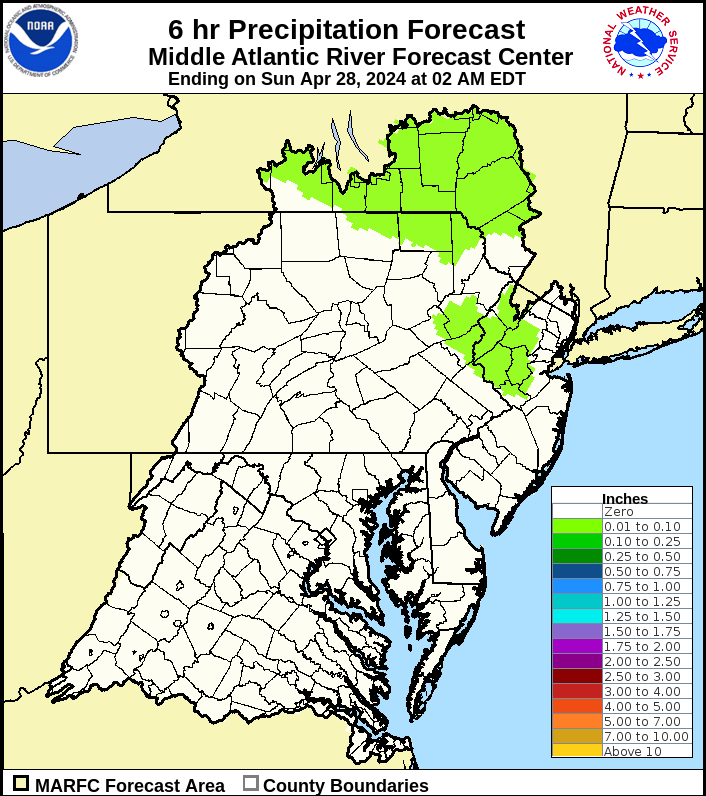
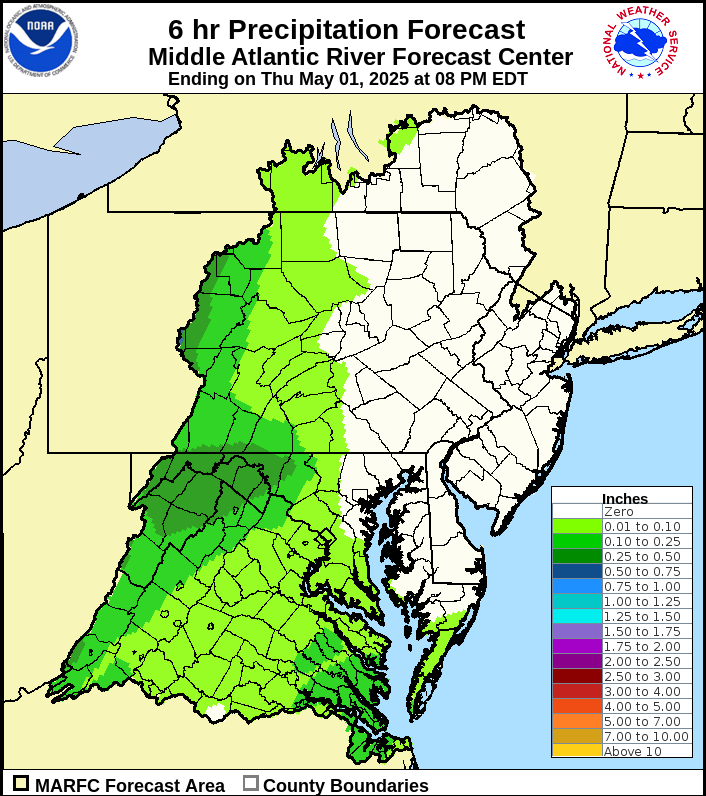
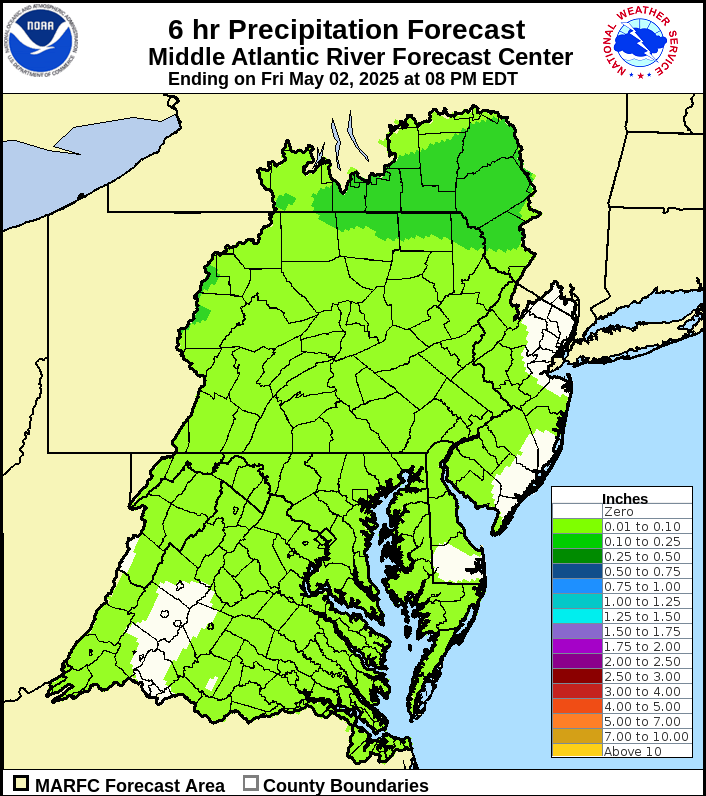
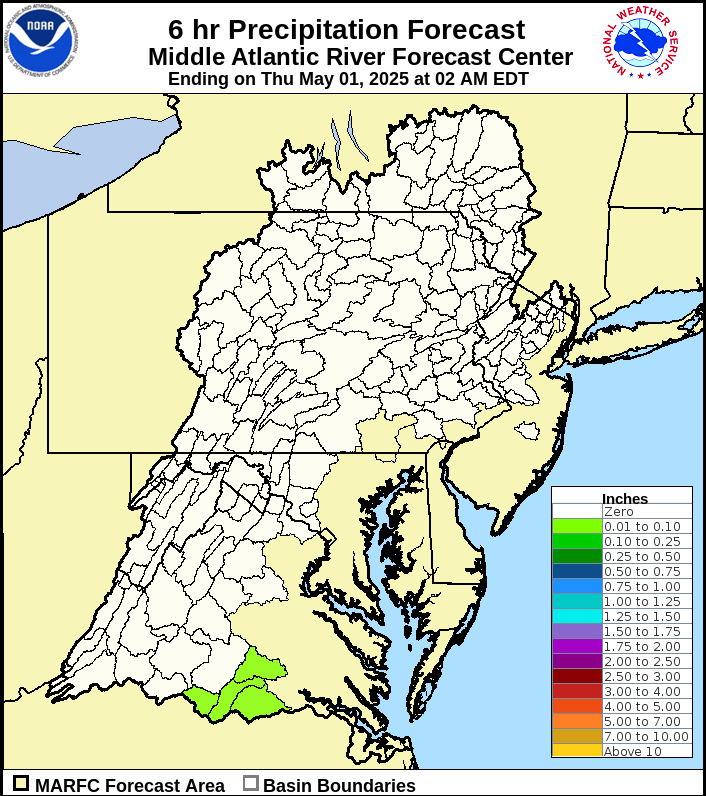
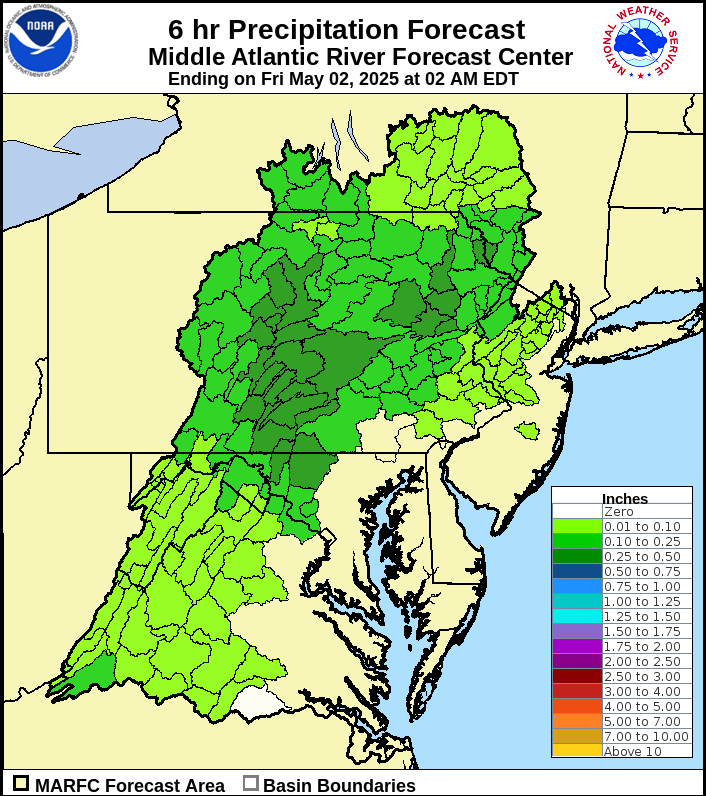
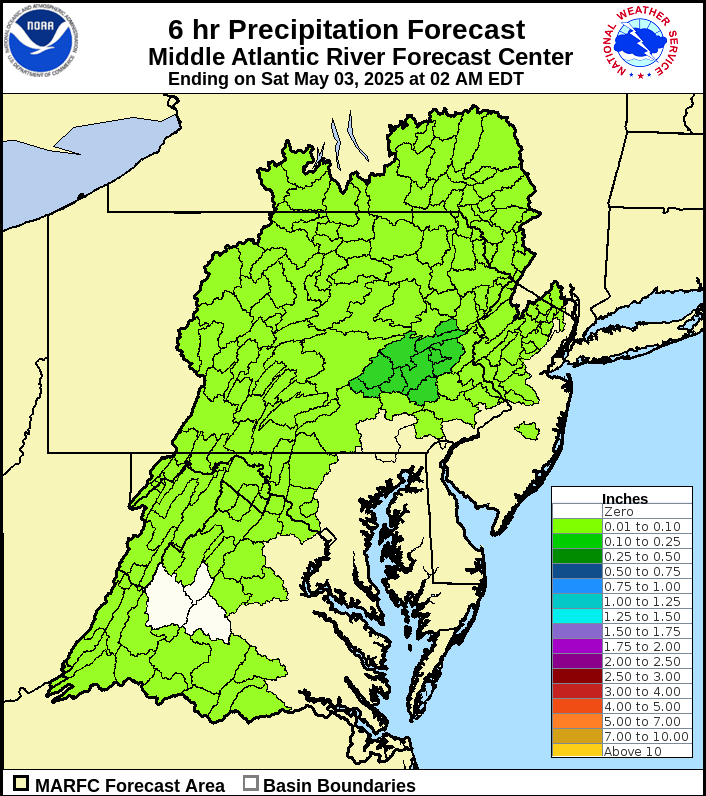
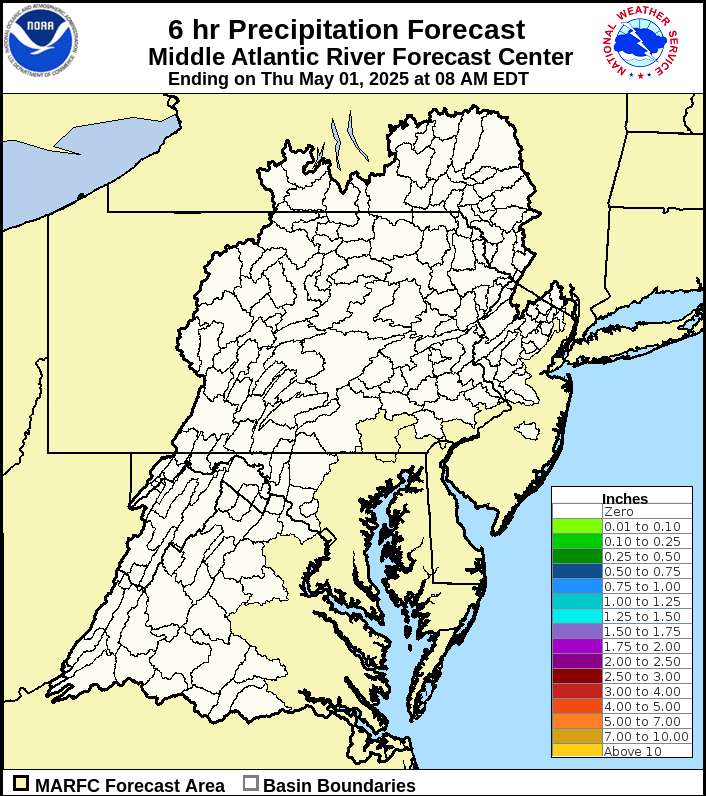
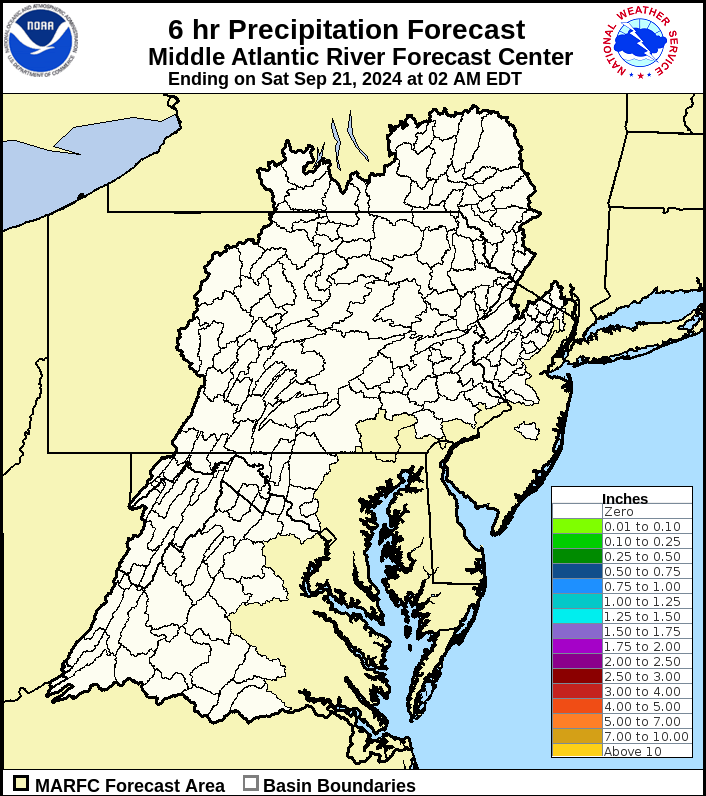
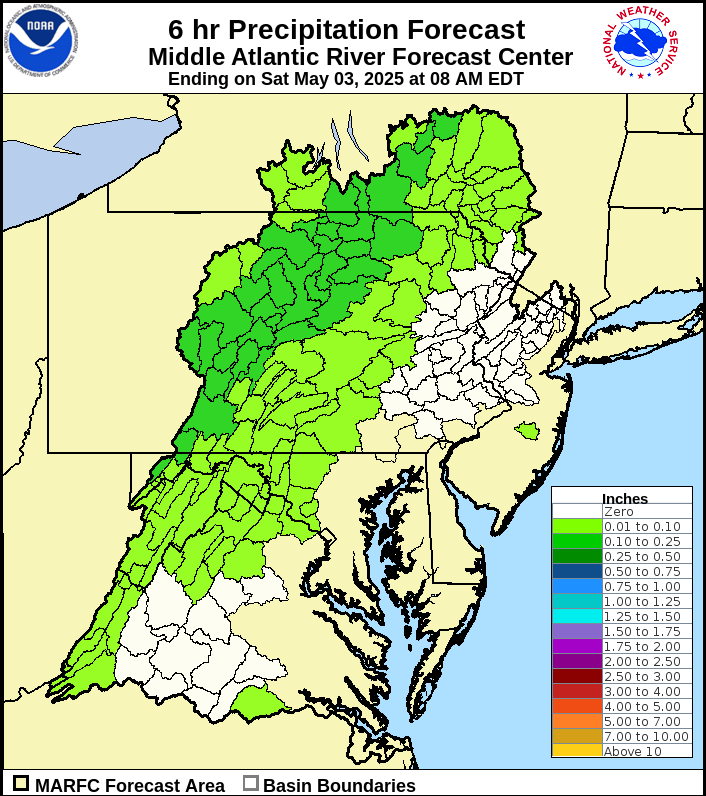
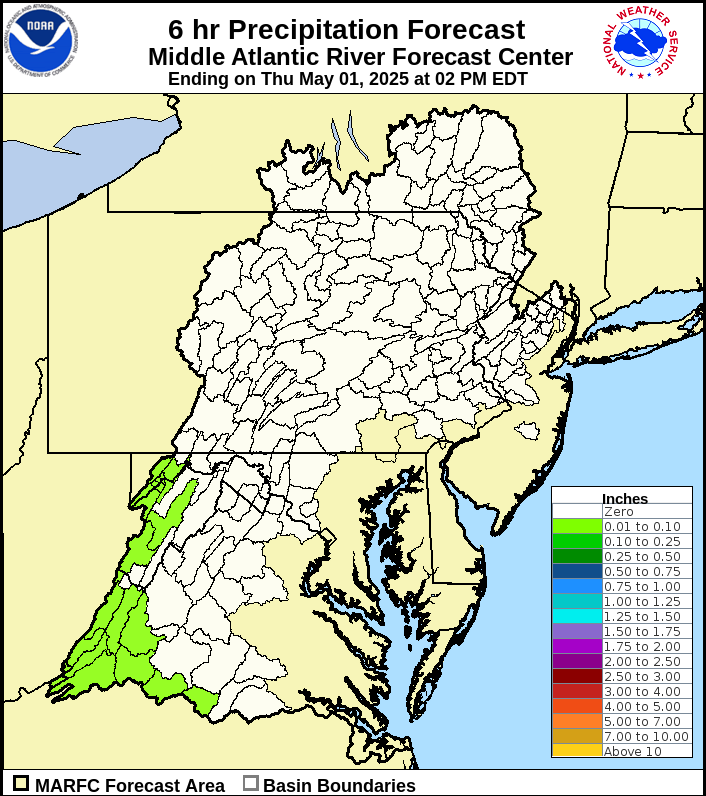
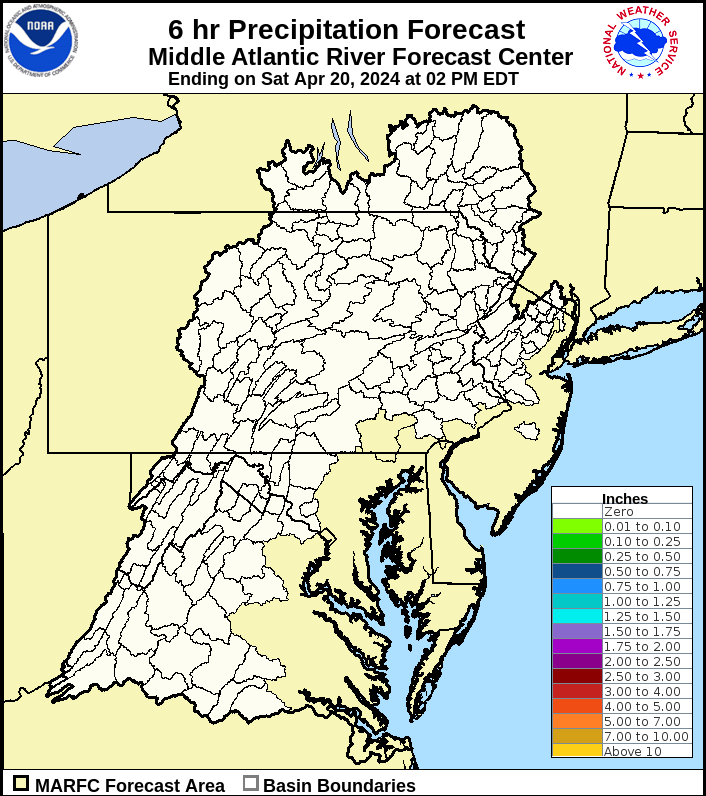
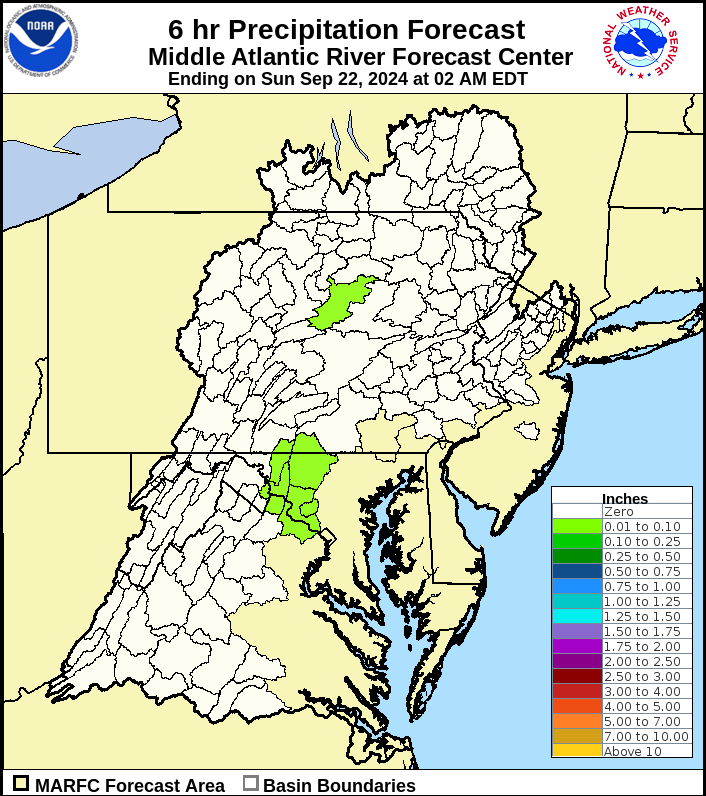
| Six Hour Totals | ||
 |
 |
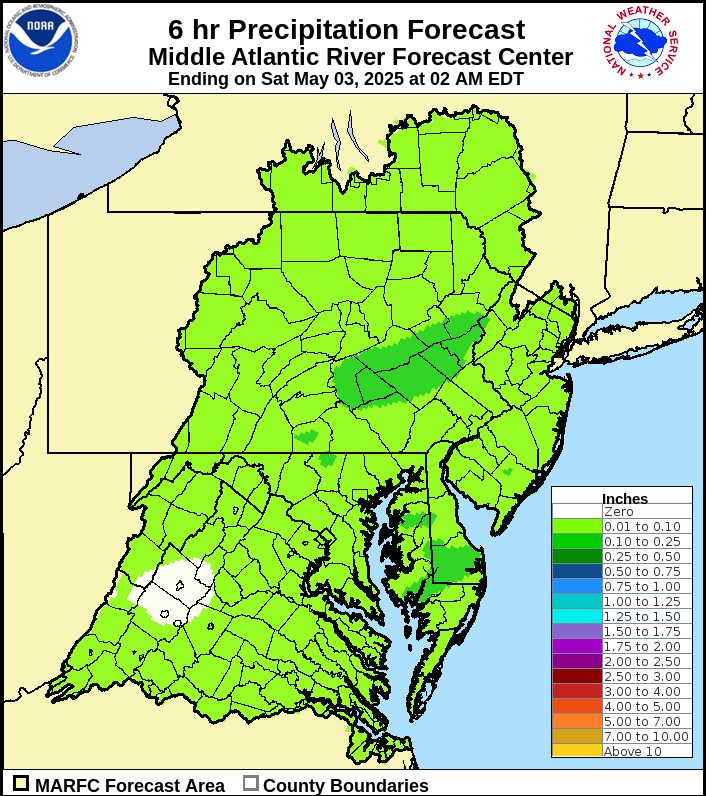 |
| Ending 2 AM, June 30 | Ending 2 AM, July 1 | Ending 2 AM, July 2 |
 |
 |
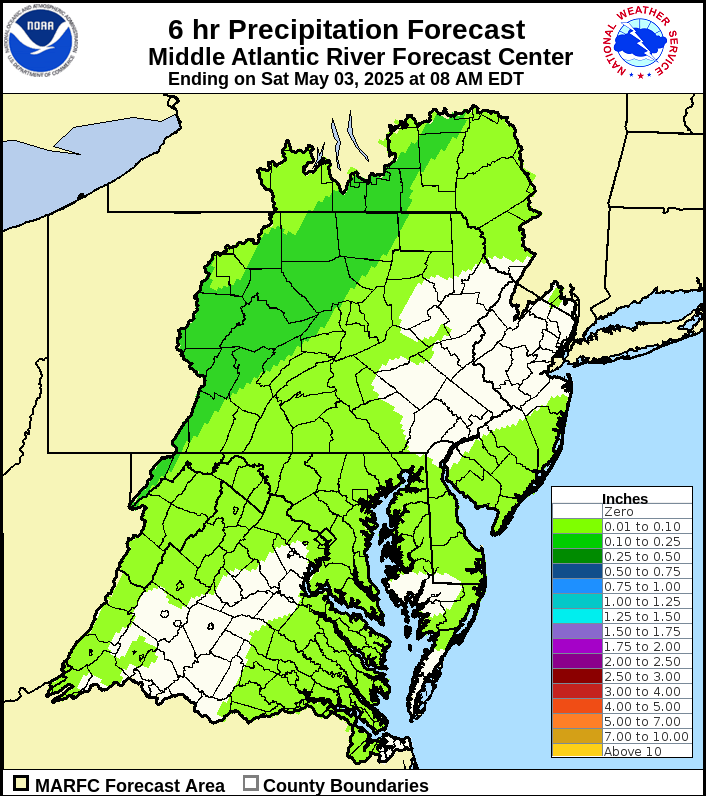 |
| Ending 8 AM, June 30 | Ending 8 AM, July 1 | Ending 8 AM, July 2 |
 |
 |
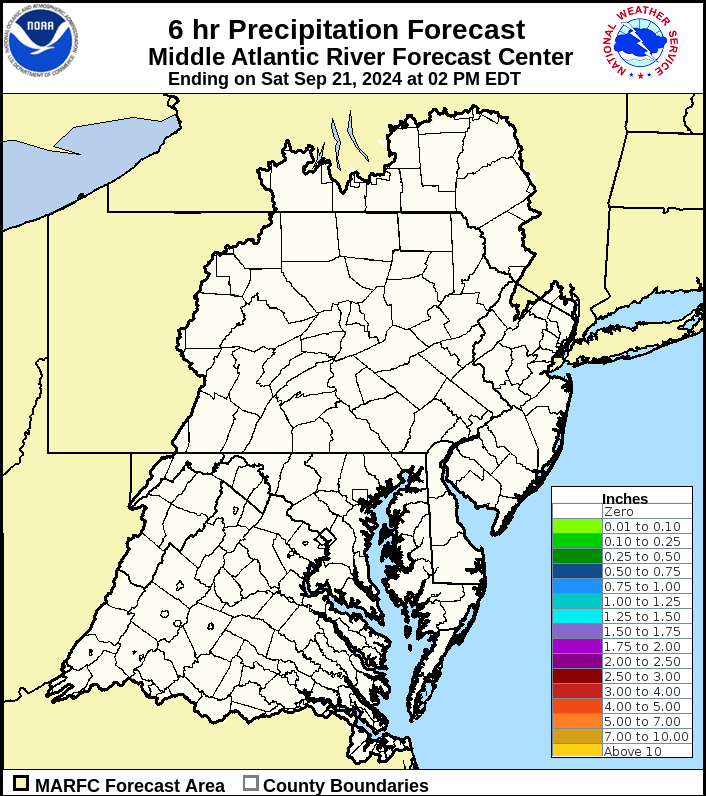 |
| Ending 2 PM, June 30 | Ending 2 PM, July 1 | Ending 2 PM, July 2 |
 |
 |
 |
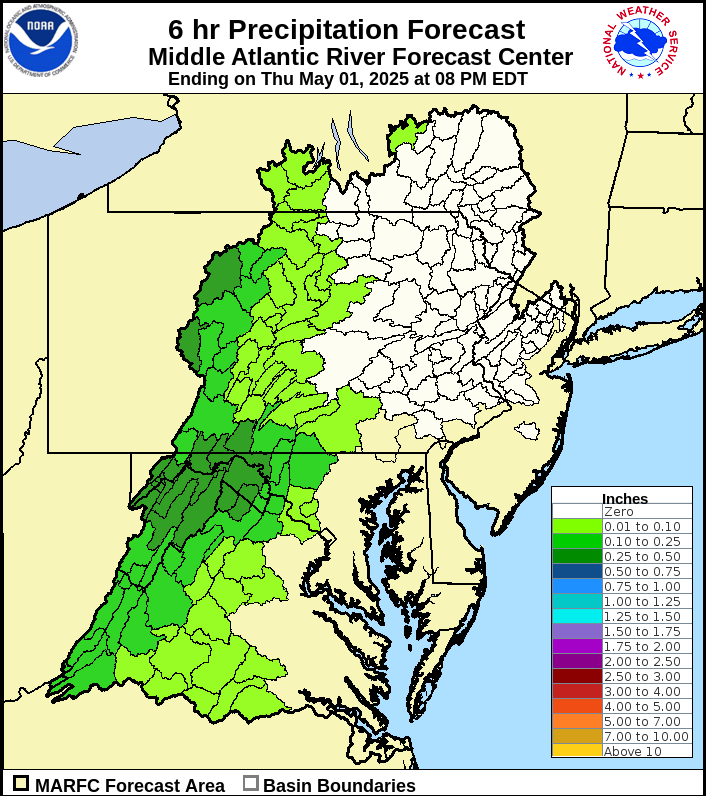
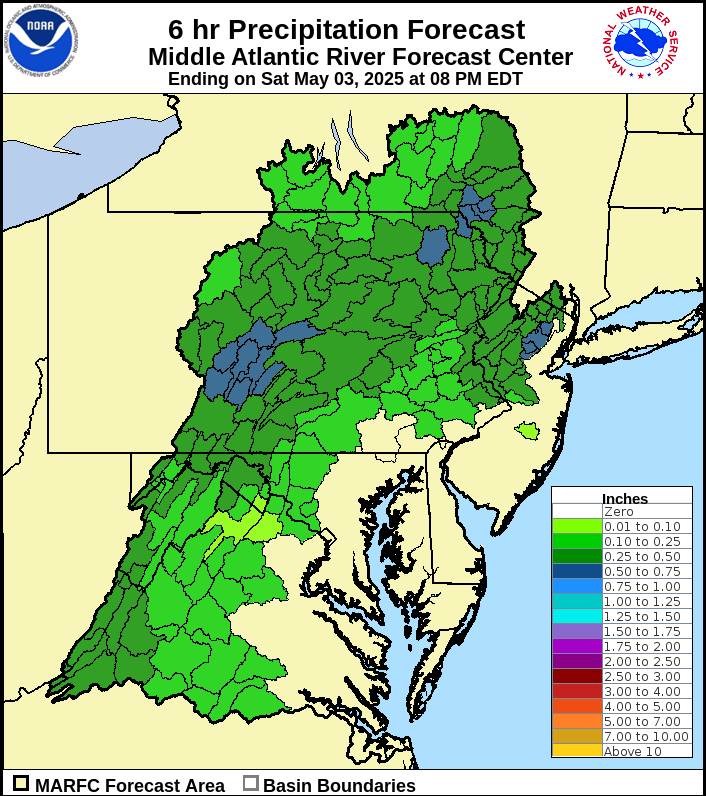
| Ending 8 PM, June 30 | Ending 8 PM, July 1 | Ending 8 PM, July 2 |
Basin Average Forecast Precipitation MapsClick on images to enlarge |
||
| 72 Hour Total | ||
 |
||
| Day One Total | Day Two Total | Day Three Total |
 |
 |
 |
| Six Hour Totals | ||
 |
 |
 |
| Ending 2 AM, June 30 | Ending 2 AM, July 1 | Ending 2 AM, July 2 |
 |
 |
 |
| Ending 8 AM, June 30 | Ending 8 AM, July 1 | Ending 8 AM, July 2 |
 |
 |
 |
| Ending 2 PM, June 30 | Ending 2 PM, July 1 | Ending 2 PM, July 2 |
 |
 |
 |
| Ending 8 PM, June 30 | Ending 8 PM, July 1 | Ending 8 PM, July 2 |
US Dept of Commerce
National Oceanic and Atmospheric Administration
National Weather Service
Middle Atlantic RFC
328 Innovation Boulevard
Suite 330
State College, PA 16803
814-954-6408
Comments? Questions? Please Contact Us.

