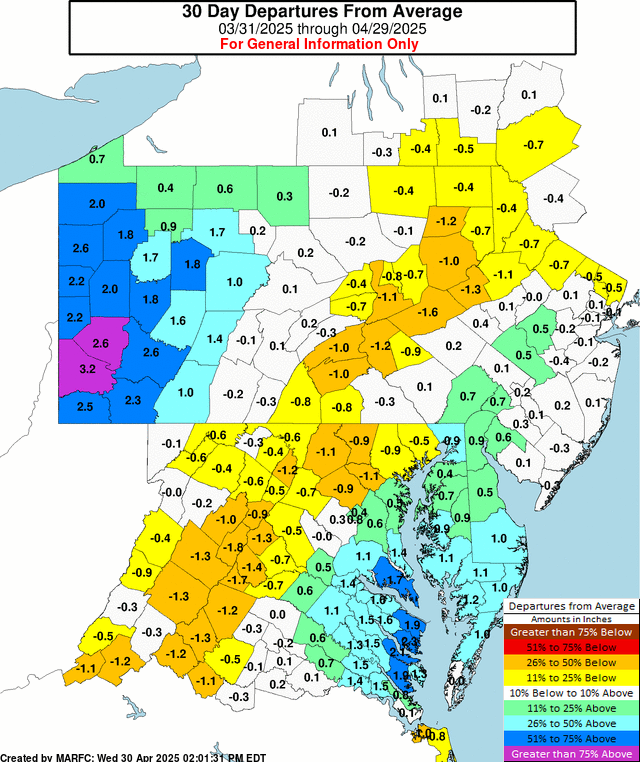
30 Day Precipitation Departures From Average Calculated by MARFC:
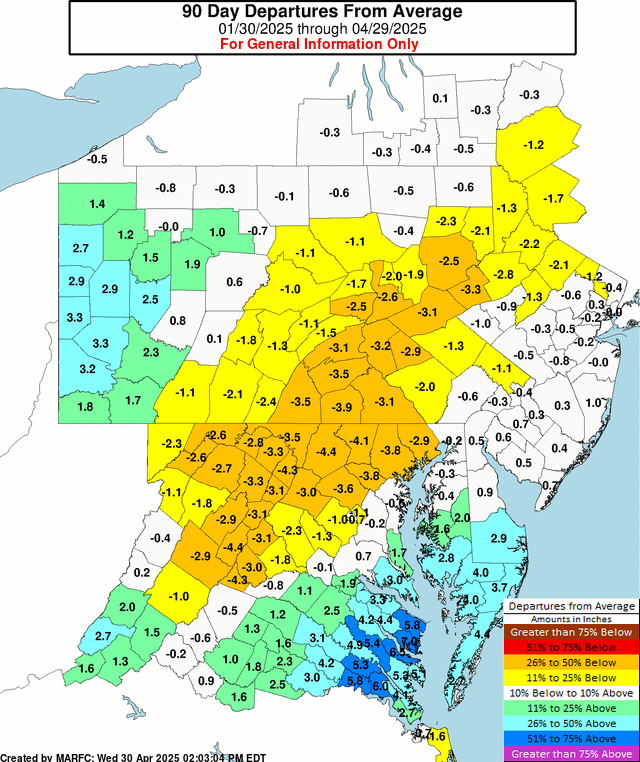
90 Day Precipitation Departures From Average Calculated by MARFC:
Year to Date Precipitation Departures From Average Calculated by MARFC:
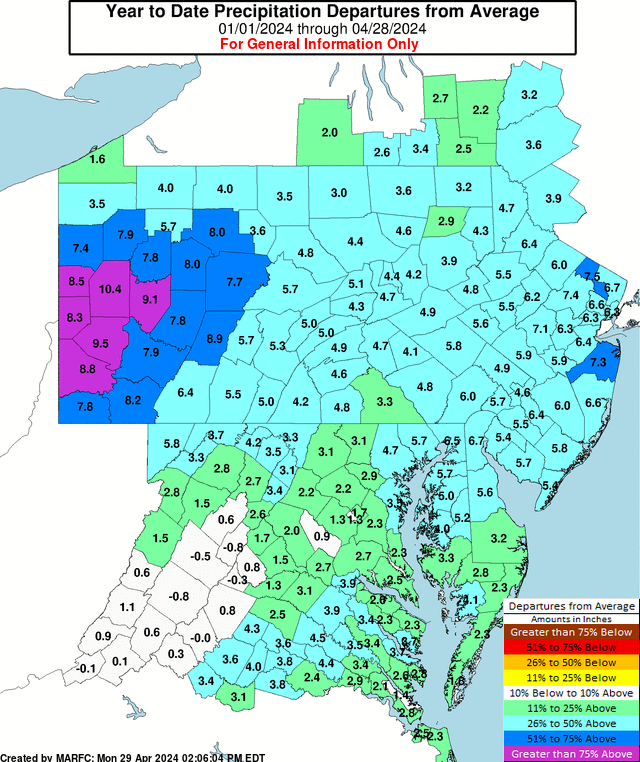
MARFC Precipitation Departure Maps are available for a variety of time spans.
MARFC Observed Precipitation Maps are available to show the most recent precipitation amounts for time spans of the past 72 hours.
Northeast Regional Climate Center precipitation maps are also available for a variety of time spans and on a larger geographic scale.
National AHPS Precipitation Maps are available for a national perspective.
30 Day Temperature Departures From Normal

Northeast Regional Climate Center temperature maps are available for a variety of time spans.
FOR THE MOST CURRENT AND UP-TO-DATE INFORMATION, PLEASE VISIT THE NATIONAL HURRICANE CENTER.
The Tropical Weather Outlook for the next 48 hours:

The Tropical Weather Outlook for the next 7 days:

Note: If there are areas in yellow, then these areas are experiencing abnormally dry, but not quite drought, conditions. See below for additional drought related links.

For drought information at any time, use these links:
National Integrated Drought Information System
Drought Information Statements
United States Drought Information
Most Recent Palmer Drought Index
NASA GRACE-Based Shallow Groundwater Drought Indicator
Delaware River Basin Commission Drought Information
New York City Delaware River Basin Reservoirs
For drought information and watch/warning/emergency declarations on a statewide level:
Maryland Drought Information and Current Status
New Jersey Drought Information
New York Current Drought Conditions
Pennsylvania Drought Monitoring
Cooperating Agencies:
Delaware River Basin Commission
Interstate Commission on the Potomac River Basin
Susquehanna River Basin Commission
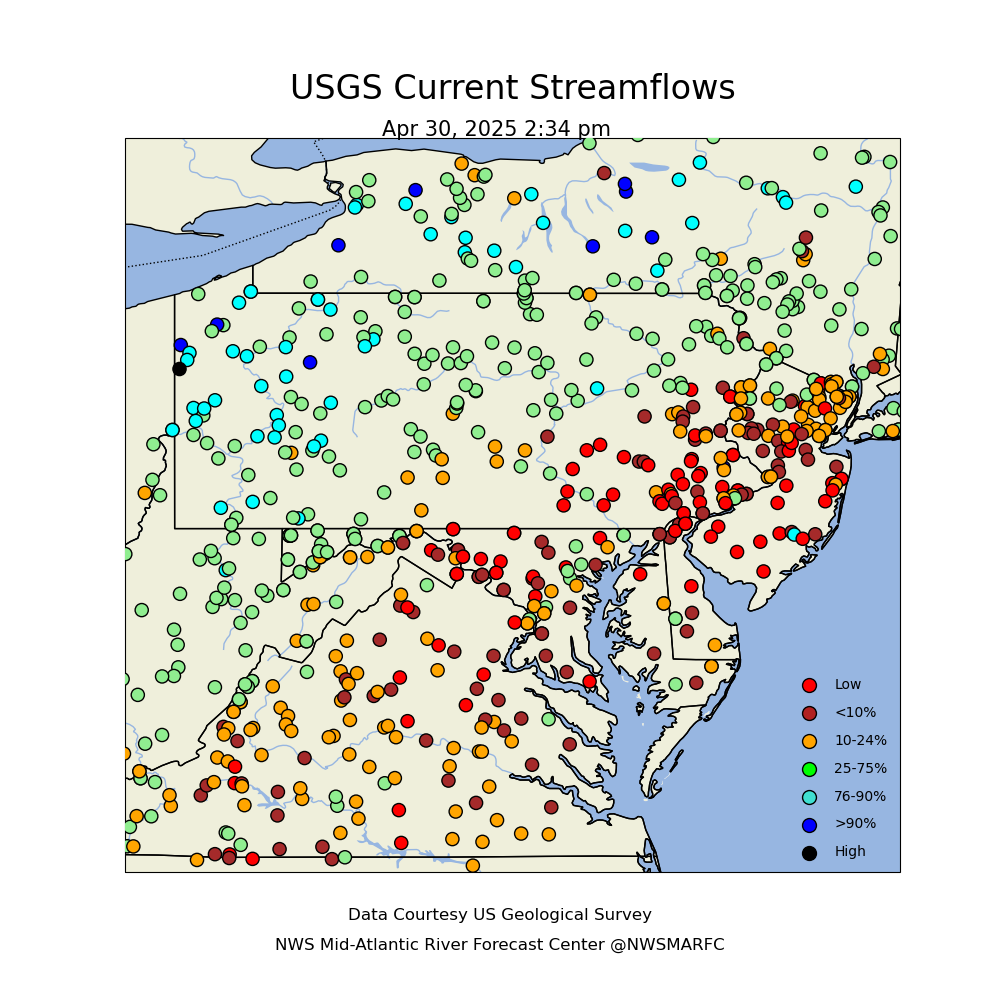
USGS Streamflow Information (click on image for additional information).
USGS Groundwater Information
USGS Groundwater Data for sites across the nation is available at waterdata.usgs.gov
U.S. Geological Survey Real Time Data
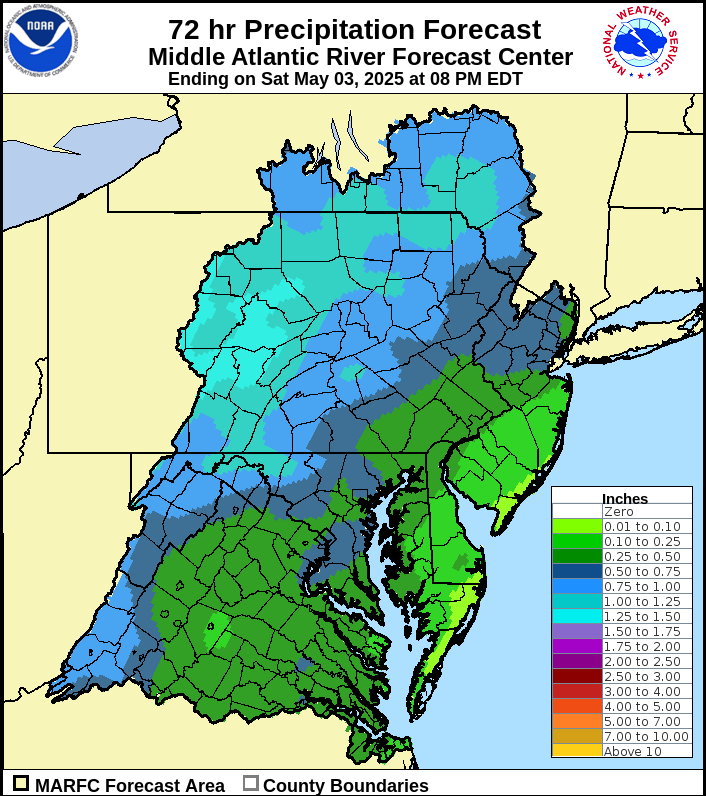
The MARFC Precipitation Forecast for the next 72 hours:
Weather Prediction Center Precipitation Outlook for the next 5 days:

The Climate Prediction Center 6 to 10 Day Outlook:


The Climate Prediction Center 8 to 14 Day Outlook:


The 30 Day Precipitation and Temperature Outlooks from the Climate Prediction Center:


The 90 Day Precipitation and Temperature Outlooks from the Climate Prediction Center:


Check out Global Weather Patterns to see weather patterns on a larger scale.
The water resources and supplies outlook is "fair" for northern areas in the Mid-Atlantic region but "poor" for southern areas where long-term drought persists. 7/24/26
As summer continues, scattered showers and thunderstorms can be expected from time to time. In general, this type of rainfall can be hit or miss. While there has been some recovery in precipitation departures as compared to average over the last month or so, longer term precipitation deficits below average continue for much of the Mid-Atlantic region over the past 3 months and beyond.
While varying degrees of drought persist across the Middle Atlantic region, there has been some gradual improvement in drought conditions in recent weeks across southern and eastern portions of the region as depicted in the weekly U.S. Drought Monitor. Of note, a smaller area of severe to extreme drought conditions continues across central VA as well as across central to southern DE and the eastern shore of MD. A smaller area of severe drought also remains across southern NJ and into nearby southern PA and MD. Future precipitation outlooks indicate that near to slightly above normal precipitation is expected over the next couple of weeks.

