| Severe Weather & Flooding of April 29-30, 2014 |
Severe weather and flooding impacted the forecast area once again on April 29-30, 2014. Figure 1 shows all of the severe weather and flooding reports that were received by this office, as well as any warnings that were in effect. As can be seen in the figure, most of the severe and flooding occurred in the Florida Panhandle and Southeast AL. There were also two tornadoes confirmed Jackson County, FL and will be discussed in detail below. Click for a detailed summary of severe weather and flooding reports.

Figure 1. Map showing warning polygons and observed reports of severe weather and flooding that occurred on April 29-30, 2014. Polygons for tornado warnings (red), severe thunderstorm warnings (yellow), flood warnings (green) and special marine warnings (purple) are shown. Rain symbols indicate areas that reported in excess of 3 inches of rain. The waves indicate flooding reports. Tornado, wind and wind damage icons are also included.
Jackson County EF1 Tornadoes
Two tornadoes were confirmed by NWS survey teams in Jackson County, FL. An EF1 tornado touched down in Irwin County about 4 miles south of Ocilla, GA, and was on the ground for about 10 minutes. Figure 2 shows the approximate tracks of two tornadoes that touched down in the county within minutes of one another. Figure 3 shows a home that was severely damaged by a tree that was split apart by one of the tornadoes.
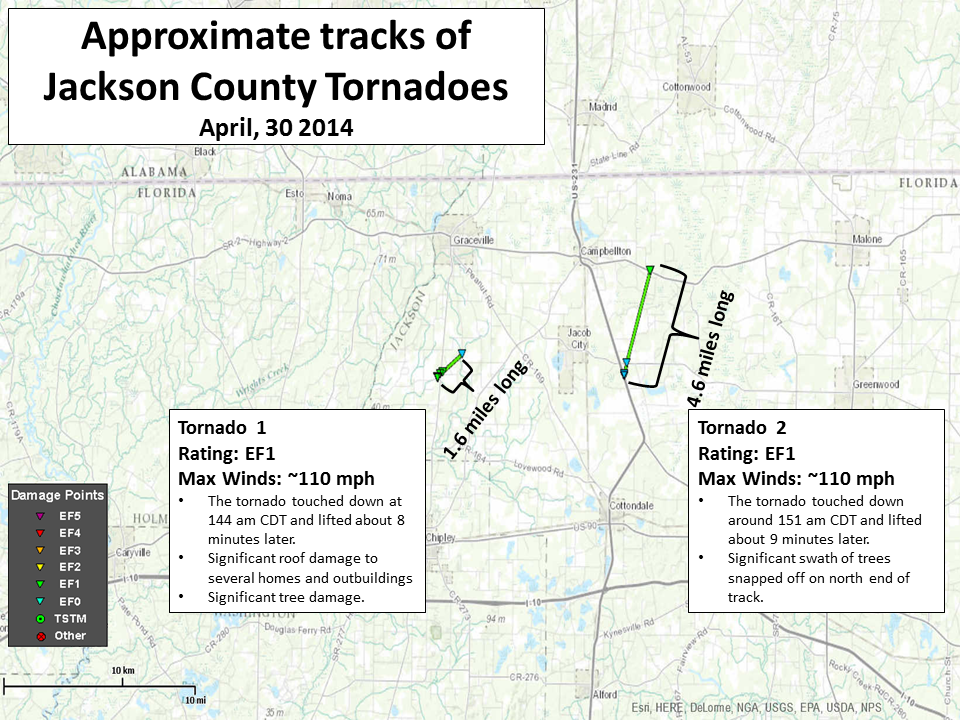
Figure 2. Map showing the approximate track of two EF1 tornadoes that touched down in Jackson County, FL, on April 30, 2014. Click here for the KML File.

Figure 3. A home in Jackson County that was severely damaged by an EF1 tornado on April 30, 2014.
Figures 4 and 5 show 4-panel images from the KEOX radar valid 0647 UTC and 0656 UTC 30 April 2014, respectively. Notice in Figure 4 that there is very little indication in the reflectivity and storm-relative velocity data that a tornado was on the ground. The warning forecaster actually warned based on a small area of minimum values in the dual pol correlation coefficient (CC) product in the previous volume scan. The damage from this first tornado occurred near the circle on the left. The In Figure 5, there is more apparent rotation in the storm with a TVS indicated. A Tornado Debris Signature (TDS) was evident in CC data in the next volume scan. Damage from this tornado occurred at the location of the right-most black circle.
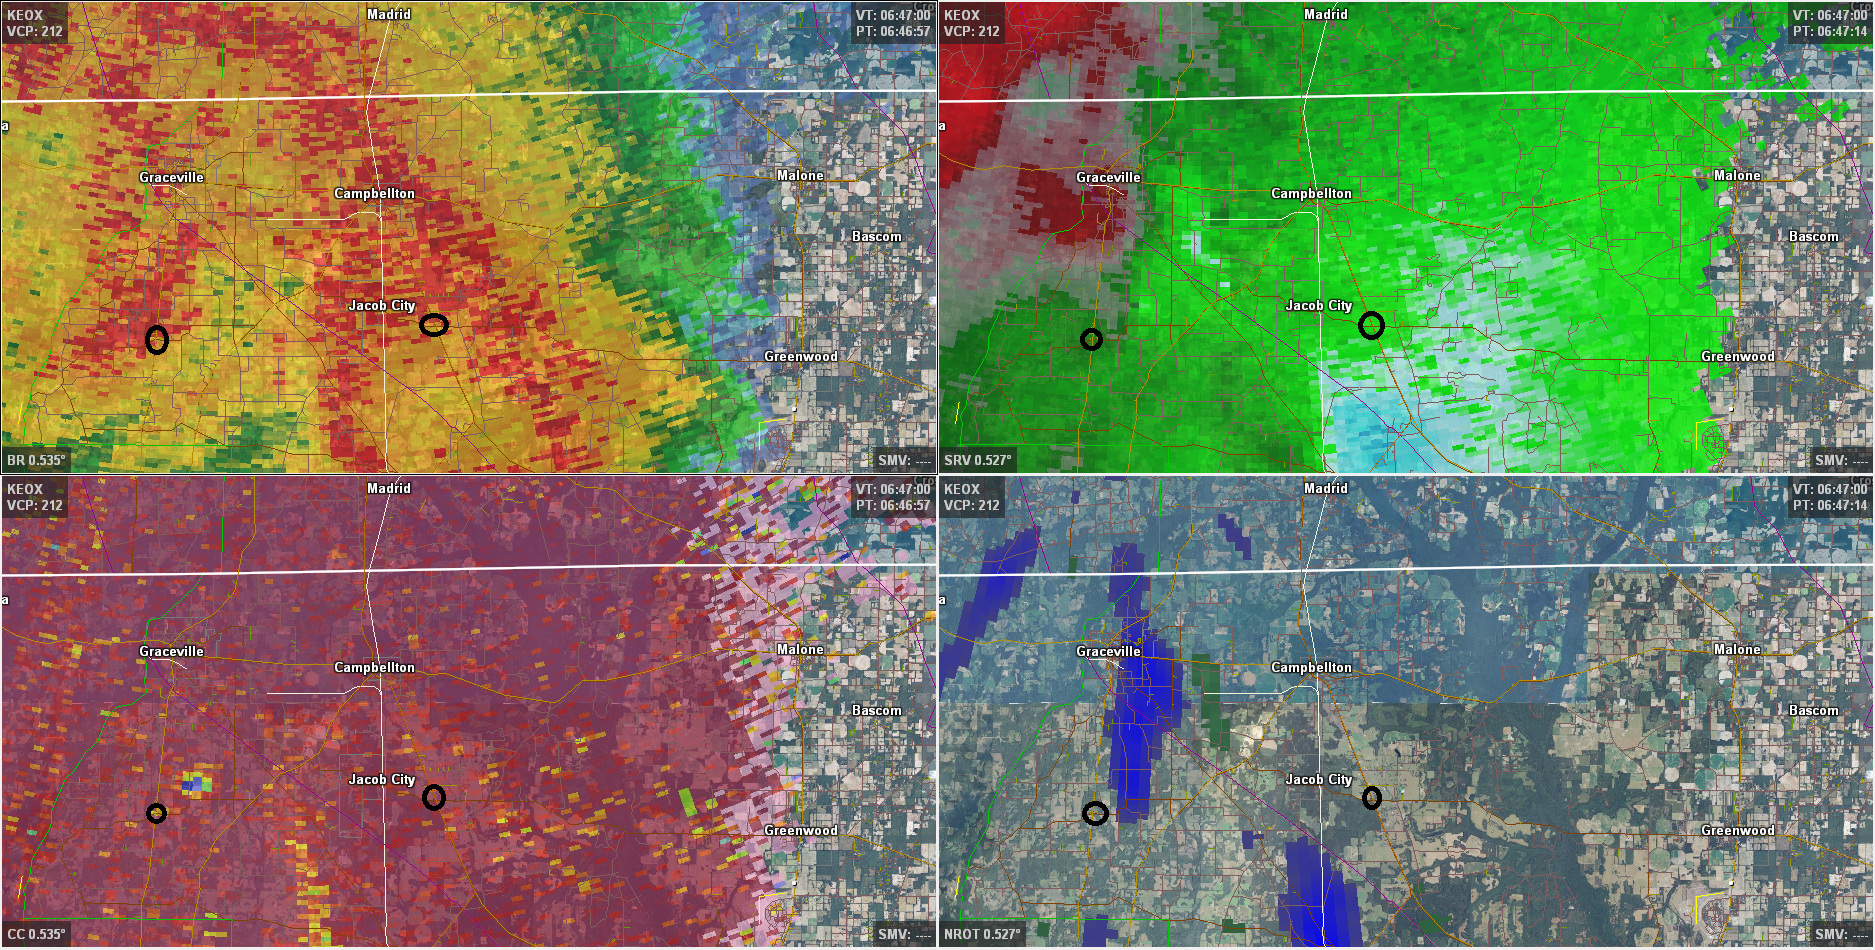
Figure 4. A 4-panel image from the Ft. Rucker, AL (KEOX) radar valid 0647 UTC 30 April 2014. Clockwise from top left, the images depict base reflectivity, storm-relative velocity, rotational velocity and correlation coefficient, all on the 0.5-degree slice Click the image for a larger view.

Figure 5. A 4-panel image from the Ft. Rucker, AL (KEOX) radar valid 0656 UTC 30 April 2014. Clockwise from top left, the images depict base reflectivity, storm-relative velocity, rotational velocity and correlation coefficient, all on the 0.5-degree slice. Click the image for a larger view.
Flooding
As can be seen in Figure 6 (below), a large portion of the forecast area received over 3 inches of rain in a 24-hour period with western portions of the Florida Panhandle receiving well in excess of 10 inches. Areas from Mobile to Pensacola had devastating flash flooding from this event. While less rain fell further to the east, amounts were still excessive in our forecast area with a flash flood emergency issued by this office for Walton County, only the second such product ever issued by WFO Tallahassee. Some of these rainfall totals are listed in our local storm report. Figure 7 shows cars stranded in flood waters in Walton County. Figure 8 shows a building that partially sunk into a sink hole caused by the excessive rainfall in Walton County. Runoff from the excessive rain caused some fast-responding rivers, such as the Shoal River near Mossy Head, FL (Figure 9) to rapidly overflow their banks. The Chipola River near Altha, FL (Figure 10) did the same. Larger rivers took longer to respond with the Choctawhatchee River near Bruce-Ebro (Figure 11) eventually reaching major flood stage. Further to the east, the Lower Suwannee River (not pictured) is not forecast to drop completely below flood stage until mid May.

Figure 6. 24-hour rainfall ending at 1200 UTC April 30, 2014.
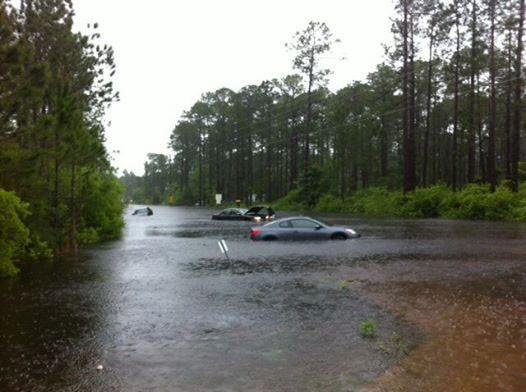
Figure 7. Cars stranded in flood waters in Walton County, FL on April 30, 2014. Photo submitted by Walton County Sheriff's Office to WMBB-TV.
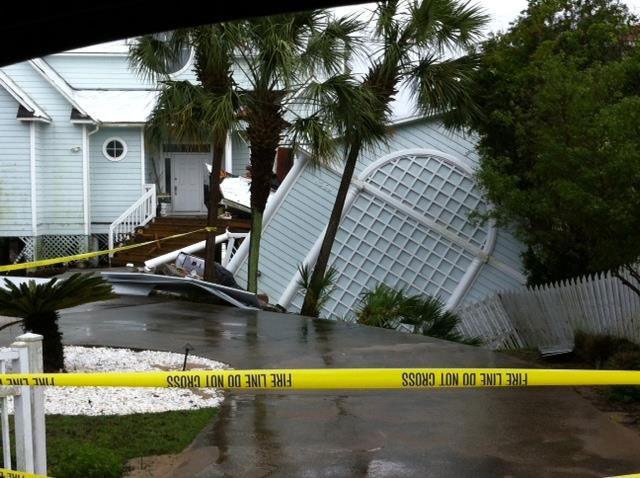
Figure 8. A portion of a home was undermined as the underlying dune was washed out by the excessive rainfall in Walton County, FL on April 30, 2014. Photo submitted by Walton County Sheriff's Office to WMBB-TV.

Figure 9. Hydrograph showing the observed flood crest on the Shoal River near Mossy Head, FL on April 30, 2014.

Figure 10. Hydrograph showing the predicted flood crest on the Chipola River near Altha, FL on May 3, 2014.

Figure 11. Hydrograph showing the predicted flood crest on the Choctawhatchee River near Bruce-Ebro, FL on May 5, 2014.
This page was authored by Mark Wool. The map of storm reports and warning polygons was created by Don Van Dyke. The tornado track map and associated kml file was created by Parks Camp.


 Follow us on YouTube