This is YOUR National Weather Service (NWS) Forecast Office in Tallahassee, Florida. The facility you are about to tour is a result of some ten years of planning and a year and a half of construction. A few pictures were taken during the construction phase and are available at the end of the tour. The office was dedicated on April 19, 2002.
As can be seen on the sign below, the NWS is one of the line offices of the National Oceanic and Atmospheric Administration (NOAA), which is itself a part of the Department of Commerce. During the tour we will take you through our office, showing various tools that forecasters use, such as doppler radar, weather balloons, and sophisticated computers.
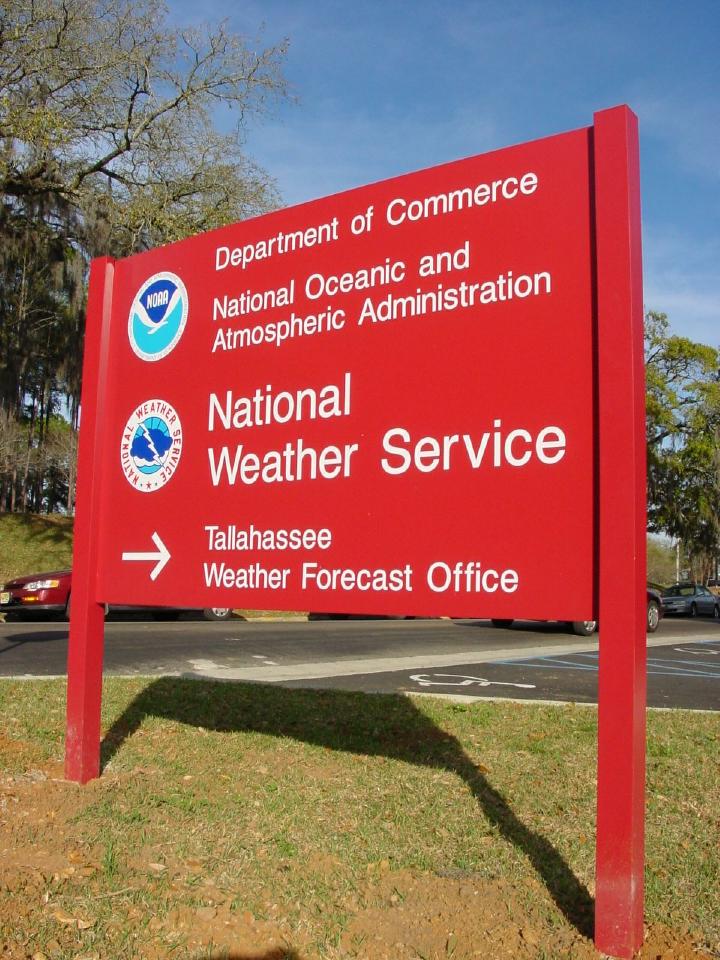

Above is an exterior view of the National Weather Service office in Tallahassee, located on the fourth floor of the new addition to the James J. Love Building on the campus of Florida State University. The office relocated to this new facility the week of February 25, 2002, and commenced operations on March 1, 2002. Previously, the office was located at the main terminal building of the Tallahassee Regional Airport, which had housed the office since December 1996. In fact, there had been a NWS presence at the airport since 1961. It is from this new building that official National Weather Service forecasts and warnings are issued. Nationally, there are 121 other forecast offices like this one, as well as 13 river forecast centers. However, our office was custom-designed and is unique in the NWS. The office is open 24 hours a day, seven days a week. Over two dozen people work inside, keeping a watchful eye to the sky for both good and bad weather. This office serves southeastern Alabama, southwestern and south central Georgia, eastern portions of the Florida Panhandle, and the Florida Big Bend. A map of our service area is available here.
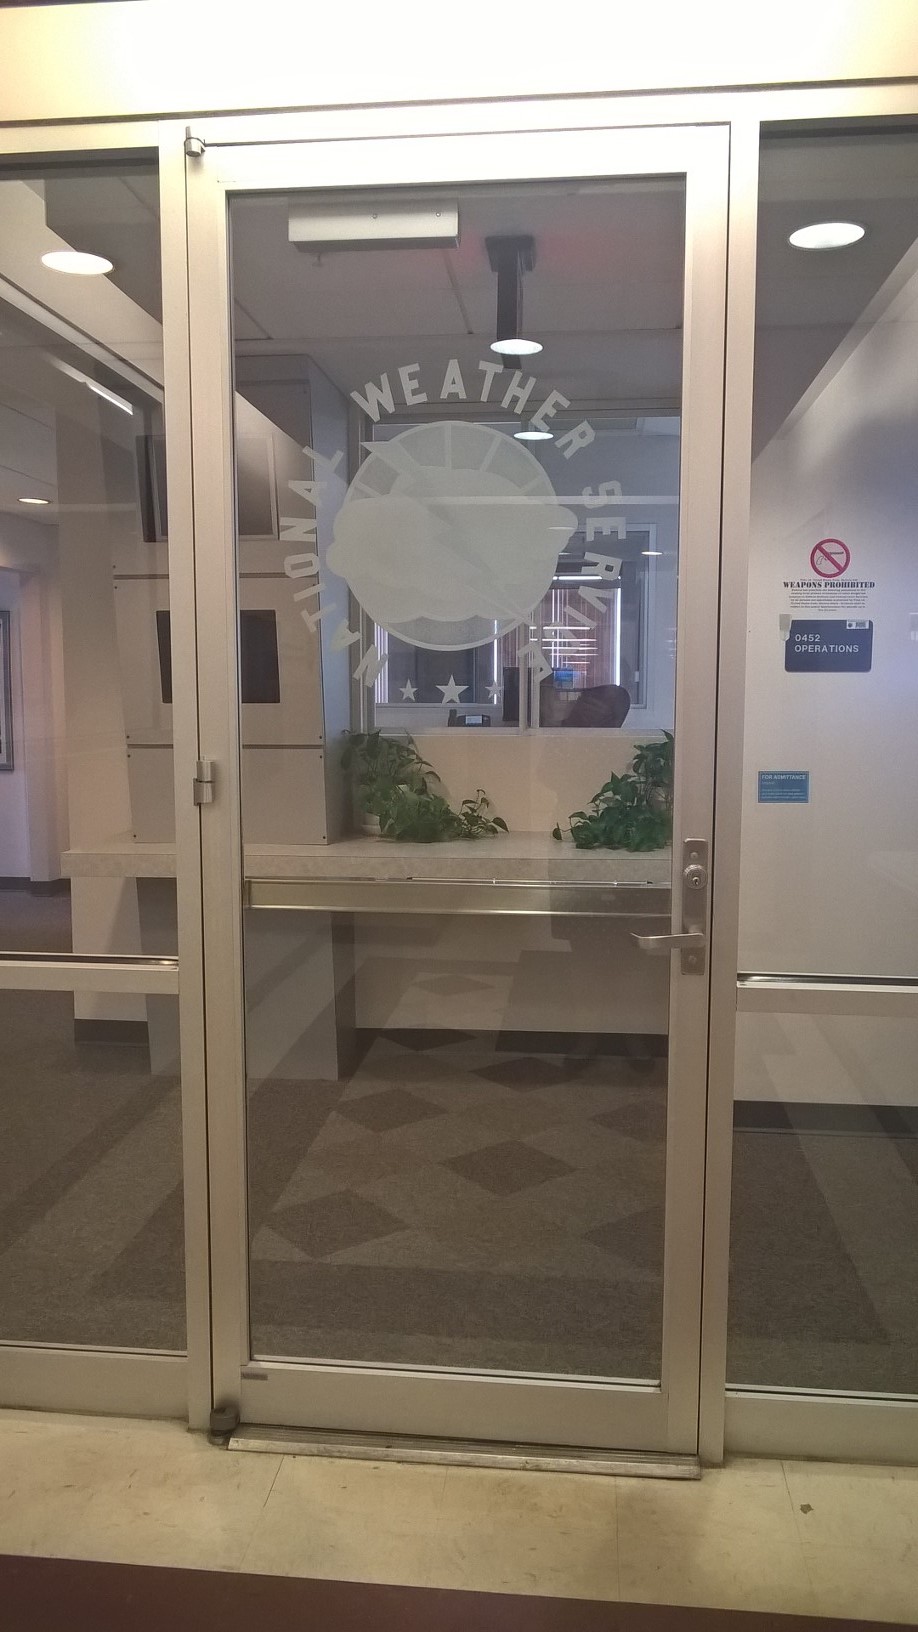
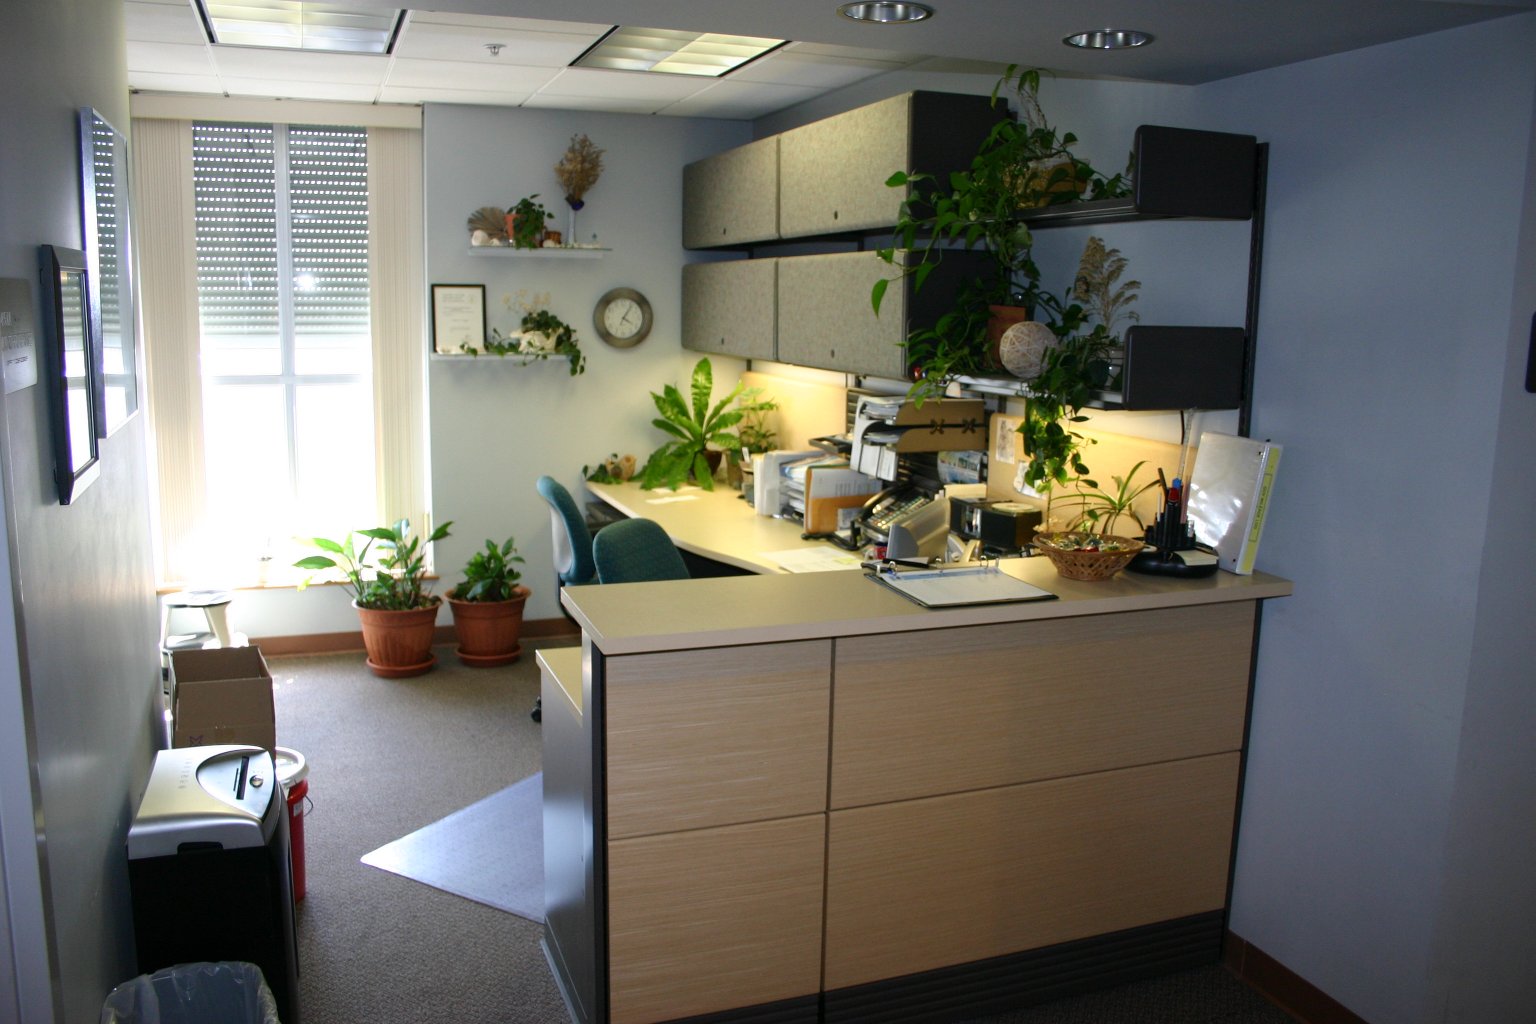
When you step off the elevator into the fourth floor lobby, you will see this entrance to our office on your right. For security reasons, access is controlled by key cards. However, just ring our doorbell, and someone will greet you promptly. Upon entering the office, you will see a couple of monitors showing weather data. One monitor will always be showing a satellite loop, while the other is linked to one of the forecaster workstations and will show whatever data he or she is analyzing at that time. There are always brochures available at this station. We also like to showcase the various awards the office has received over the past few years. Immediately to the left of the entrance, you will find the office of our Administrative Support Assistant (ASA). If you visit us during normal business hours, the ASA will direct you one of our office managers, or to a forecaster for assistance.
Photos courtesy of NWS.
Here is a virtual tour of our office from late 2020.
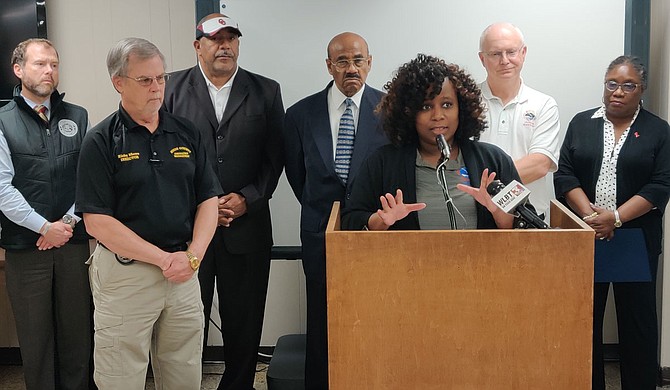
As in all NWS offices, we have an office management team. Our Meteorologist in Charge (MIC), Felecia Bowser (pictured below at the podium), is the first line supervisor of the other office managers and all of the forecasters.
Mark Wool is our Warning Coordination Meteorologist (WCM; pictured below). As the title implies, Mark is responsible for coordinating with other government agencies, media outlets and other organizations to make sure that our warnings and forecast services are satisfactory. He is the primary officer for outreach activities of all kinds. Mark also trains interested parties to become SKYWARN Spotters and conducts storm damage surveys.
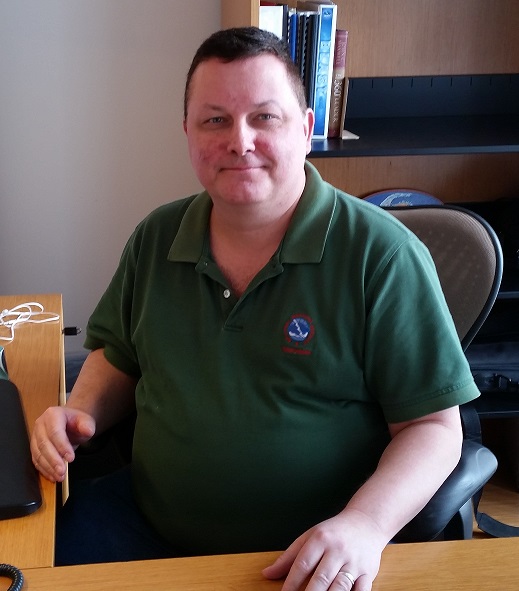
The Science and Operations Officer (SOO) is another member of the local management team. Parks Camp (pictured below) is our SOO. The SOO's primary functions are two-fold. The science part of the title means they are responsible for managing the office's research initiatives, helping forecasters accomplish research projects of their choosing, and suggesting areas where research is needed. They also acts as the chief liaison between the meteorological staff at the forecast office, and the researchers at Florida State University and other academic and scientific organizations. Parks also administers the office's training program to ensure the meteorological staff remains proficient at their many duties and always infuses the latest science into forecast operations.
Although not a member of the management team, the Senior Service Hydrologist (SSH) oversees the hydrology programs at both the Tallahassee and Jacksonville forecast offices. Jacksonville serves southeast Georgia and northeast Florida. The SSH also coordinates with many of our partner agencies to monitor rivers levels, water supply and drought conditions in order to improve our services. Some of these agencies include the U.S. Army Corps of Engineers, the U.S. Geological Survey, and various water management authorities in Florida, Alabama and Georgia at state, district, county and city levels. The management team all occasionally fill in at the forecast desk in order to remain proficient, and also to allow the forecasters to take some well-deserved vacation time.
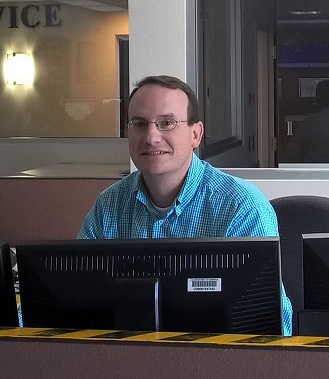
Obviously, we employ a lot of sophisticated computers and equipment to do our jobs in the NWS. This office has a staff of four individuals that work to service and maintain all of the equipment you've seen at the previous tour stops -- an Electronics Systems Analyst (ESA), two Electronics Technicians (ETs), and an Information Technology Officer (ITO). ITO Toan Tran, is primarily responsible for office computer, computer security and IT systems. The ESA and ETs fix and maintain our KTLH Doppler radar, many ASOS units across our County Warning Area, and the office's computer hardware. Jennifer Nichols is our Administrative Support Assistant. Without these folks, the meteorological staff simply could not do their jobs.
A hydrometeorological technician or intern is on duty during the day and evening shifts. This staff member launches weather balloons; issues any necessary river flood watches, warnings or statements; and quality controls various hydrometeorological data. They also run our cooperative observer program. Our office has 10 forecasters, more information on their duties can be found on the operations tab at the top of the page.
Photos courtesy of NWS.
Of course, the primary mission of this or any NWS office is to save lives and minimize property damage by issuing accurate warnings and forecasts. In order to be able to do that, forecasters need to start out on the right foot. We need to have an accurate representation of the atmosphere as it exists right now, before we can try to predict its state at some point in the future. Many tools have been developed over the years to help measure various qualities of the atmosphere both at ground level and aloft. Over the next few tour stops, we will discuss a few of the most important tools we use to observe the atmosphere.
Just about everyone has heard of Doppler radar by now. It remains one of the most critical observing tools forecasters have at their disposal. WSR-88D is what we call our Doppler radars in the NWS. The term WSR-88D is simple to explain: WSR is Weather Surveillance Radar; 88 is the year the first WSR-88D was commissioned for use (1988); and the D means it is a Doppler radar. In a cooperative effort with the Department of Defense and the Federal Aviation Administration, the NWS has deployed about 155 Doppler radars nationwide. Through an integrated network spanning the entire United States and its island territories, from Guam to Puerto Rico, the WSR-88D has dramatically enhanced our ability to safeguard life, property and commerce. In addition to the Doppler radar located in Tallahassee, forecasters at this office routinely access the Department of Defense Doppler radars at Eglin AFB (KEVX) in the western Florida Panhandle, Fort Rucker (KEOX) in Southeast Alabama, and Moody AFB (KVAX) in South Central Georgia.
 |
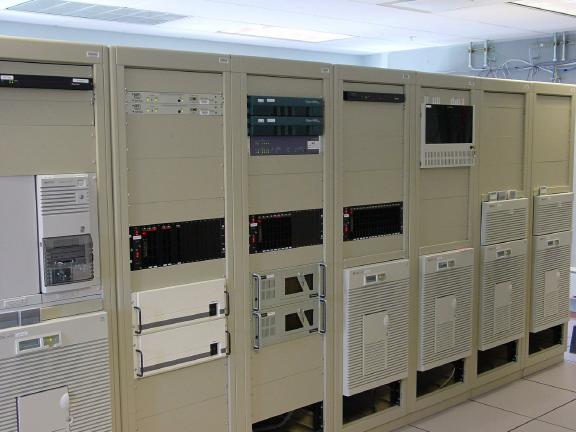
Our radar requires three integral parts to work: (1) an antenna/receiver, (2) computers that process the raw radar data, and (3) an interactive workstation that the forecasters can use to display the processed radar data. We'll talk about the last components a bit later. NWS calls the antenna/receiver portion of the radar system the Radar Data Acquisition (RDA) unit. While many NWS offices are collocated with their RDA, that is not the case in Tallahassee. Our RDA (pictured at left) is located on Capital Circle SW, about a mile east of the Tallahassee Regional Airport. The radar dish is protected by a covering that resembles a giant soccer ball. The transmitter at the antenna within this protective dome sends out a pulse of energy. When this energy hits an object, like a raindrop, it is scattered in all directions. Part of the energy will be reflected back to the antenna, where the dish focuses the returned energy. |
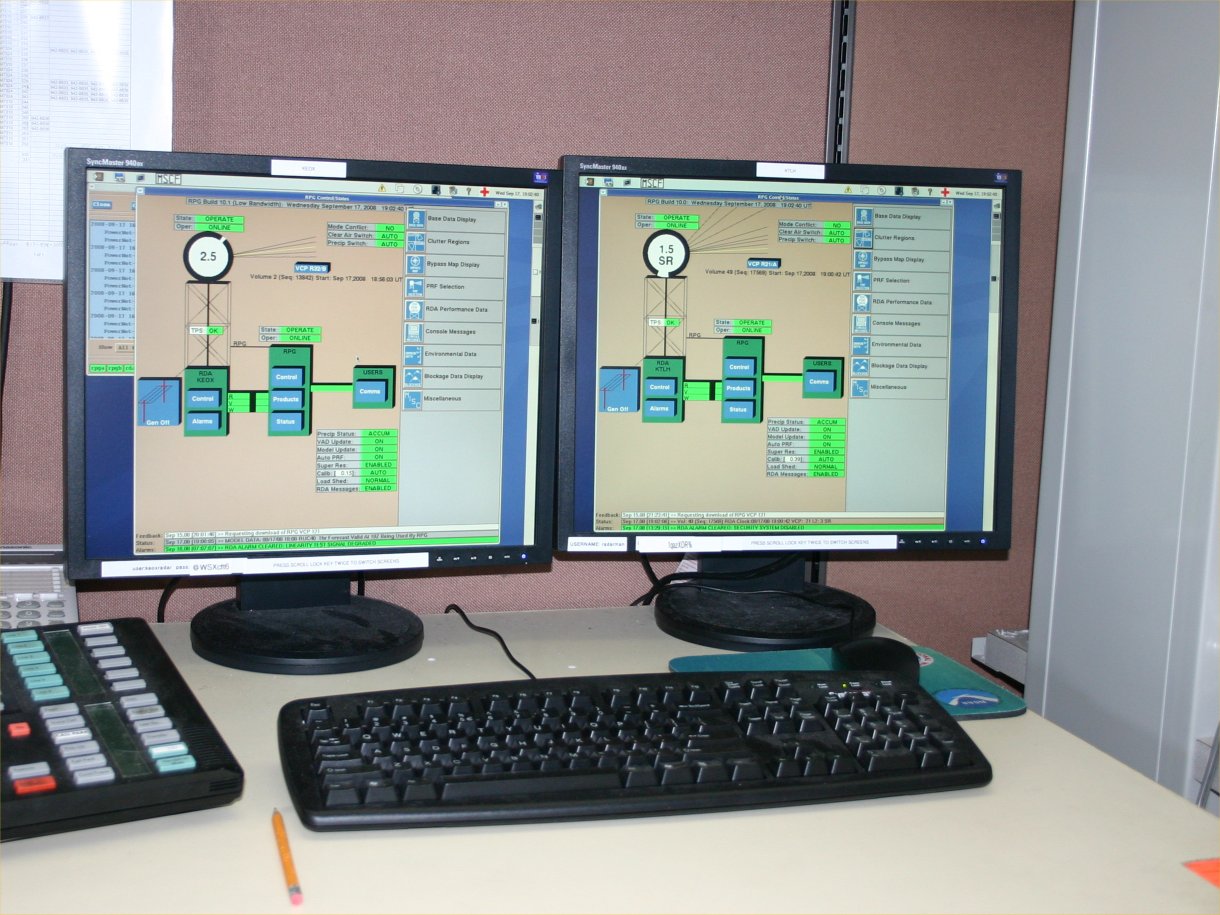
The data collected by the RDA, called base data, is sent from the RDA site to the processing computer located here in the office. The processing computer, known as the Radar Product Generator (RPG), performs various data quality checks of the raw radar data and creates the radar images and products that forecasters then interrogate. The RDA and RPG units are both controlled by a Master System Control Function (MSCF) workstation located in the operations area at the forecast office. Our office not only controls the Tallahassee radar, but also the one at Ft. Rucker, AL. Both MSCFs are pictured above. The latest base reflectivity image from the Tallahassee radar is included in the link below. By clicking on the link, you will go to an interface that allows you to loop the radar, select a different type of radar product, or look at imagery from a neighboring radar.
https://radar.weather.gov/radar.php?rid=tlh&product=N0R&overlay=11101111&loop=no
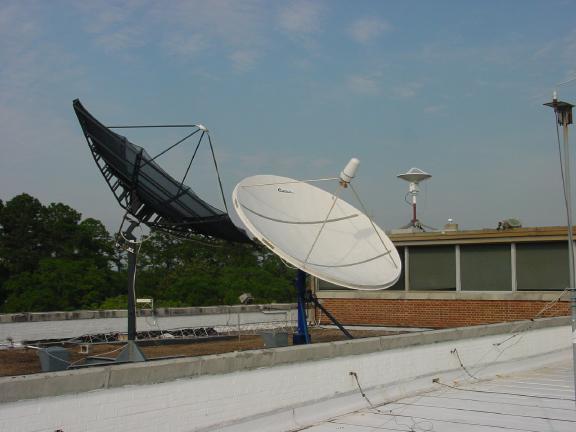
Since the first weather satellite was launched in 1960, satellite imagery has become an integral part of the forecast process. The first Geostationary Operational Environmental Satellite (GOES) was launched in 1975. The early GOES satellites were spin stabilized and viewed the earth only about ten percent of the time. From April 13, 1994, to the present, a new generation of three-axis stabilized spacecraft has been in operation (pictured at left). These satellites view the earth 100 percent of the time, taking continuous images and soundings.
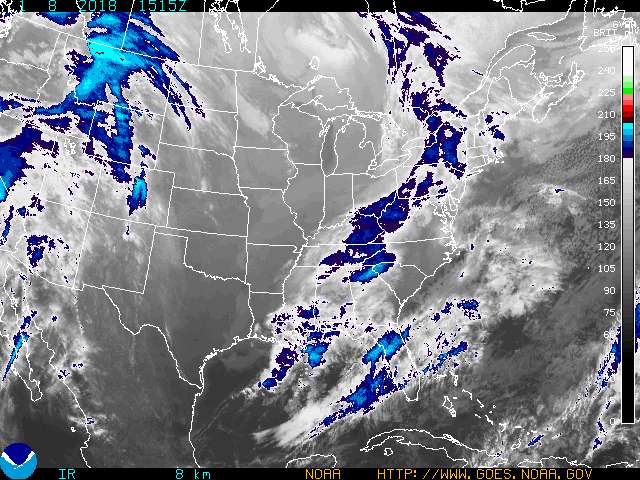
The oldest of this series, GOES-8 was replaced by GOES-12 on April 1, 2003. GOES-12 provides continuous imagery over the eastern United States. A recent infrared image from GOES-12 is shown below. Click on the image for a larger view and a loop of recent imagery. Be sure to refresh or reload the image in your browser if you have visited the site recently. Otherwise, you might get an older cached version instead.
GOES satellites provide data for severe storm evaluation, information on cloud cover, winds, ocean currents, fog distribution, storm circulation and snow melt. However, satellites are not only used for obtaining visual and infrared imagery of these types. They are also used to collect and disseminate many other types of observed data and numerical model output to the many NWS forecast offices. The satellites likewise disseminate data and forecasts created at this office to other NWS offices and many external users. We call this data collection and dissemination system the Satellite Broadcast Network (SBN). The antennae that sit atop our roof (pictured below) serve as our connection to this network. Now let's follow the data back inside the building and see how it is used.
 |
Human weather observers were an integral part of the NWS organization until the 1990s. During that decade, the first Automated Surface Observing Systems (ASOS) were fielded and eventually replaced the human observers. The Tallahassee ASOS is located at the Regional Airport. ASOS consists of a variety of sensors (pictured at right) that measure everything from temperature and wind to visibility and cloud ceiling height. To learn more about ASOS, click here to visit the ASOS homepage. |
Photos courtesy of NWS.
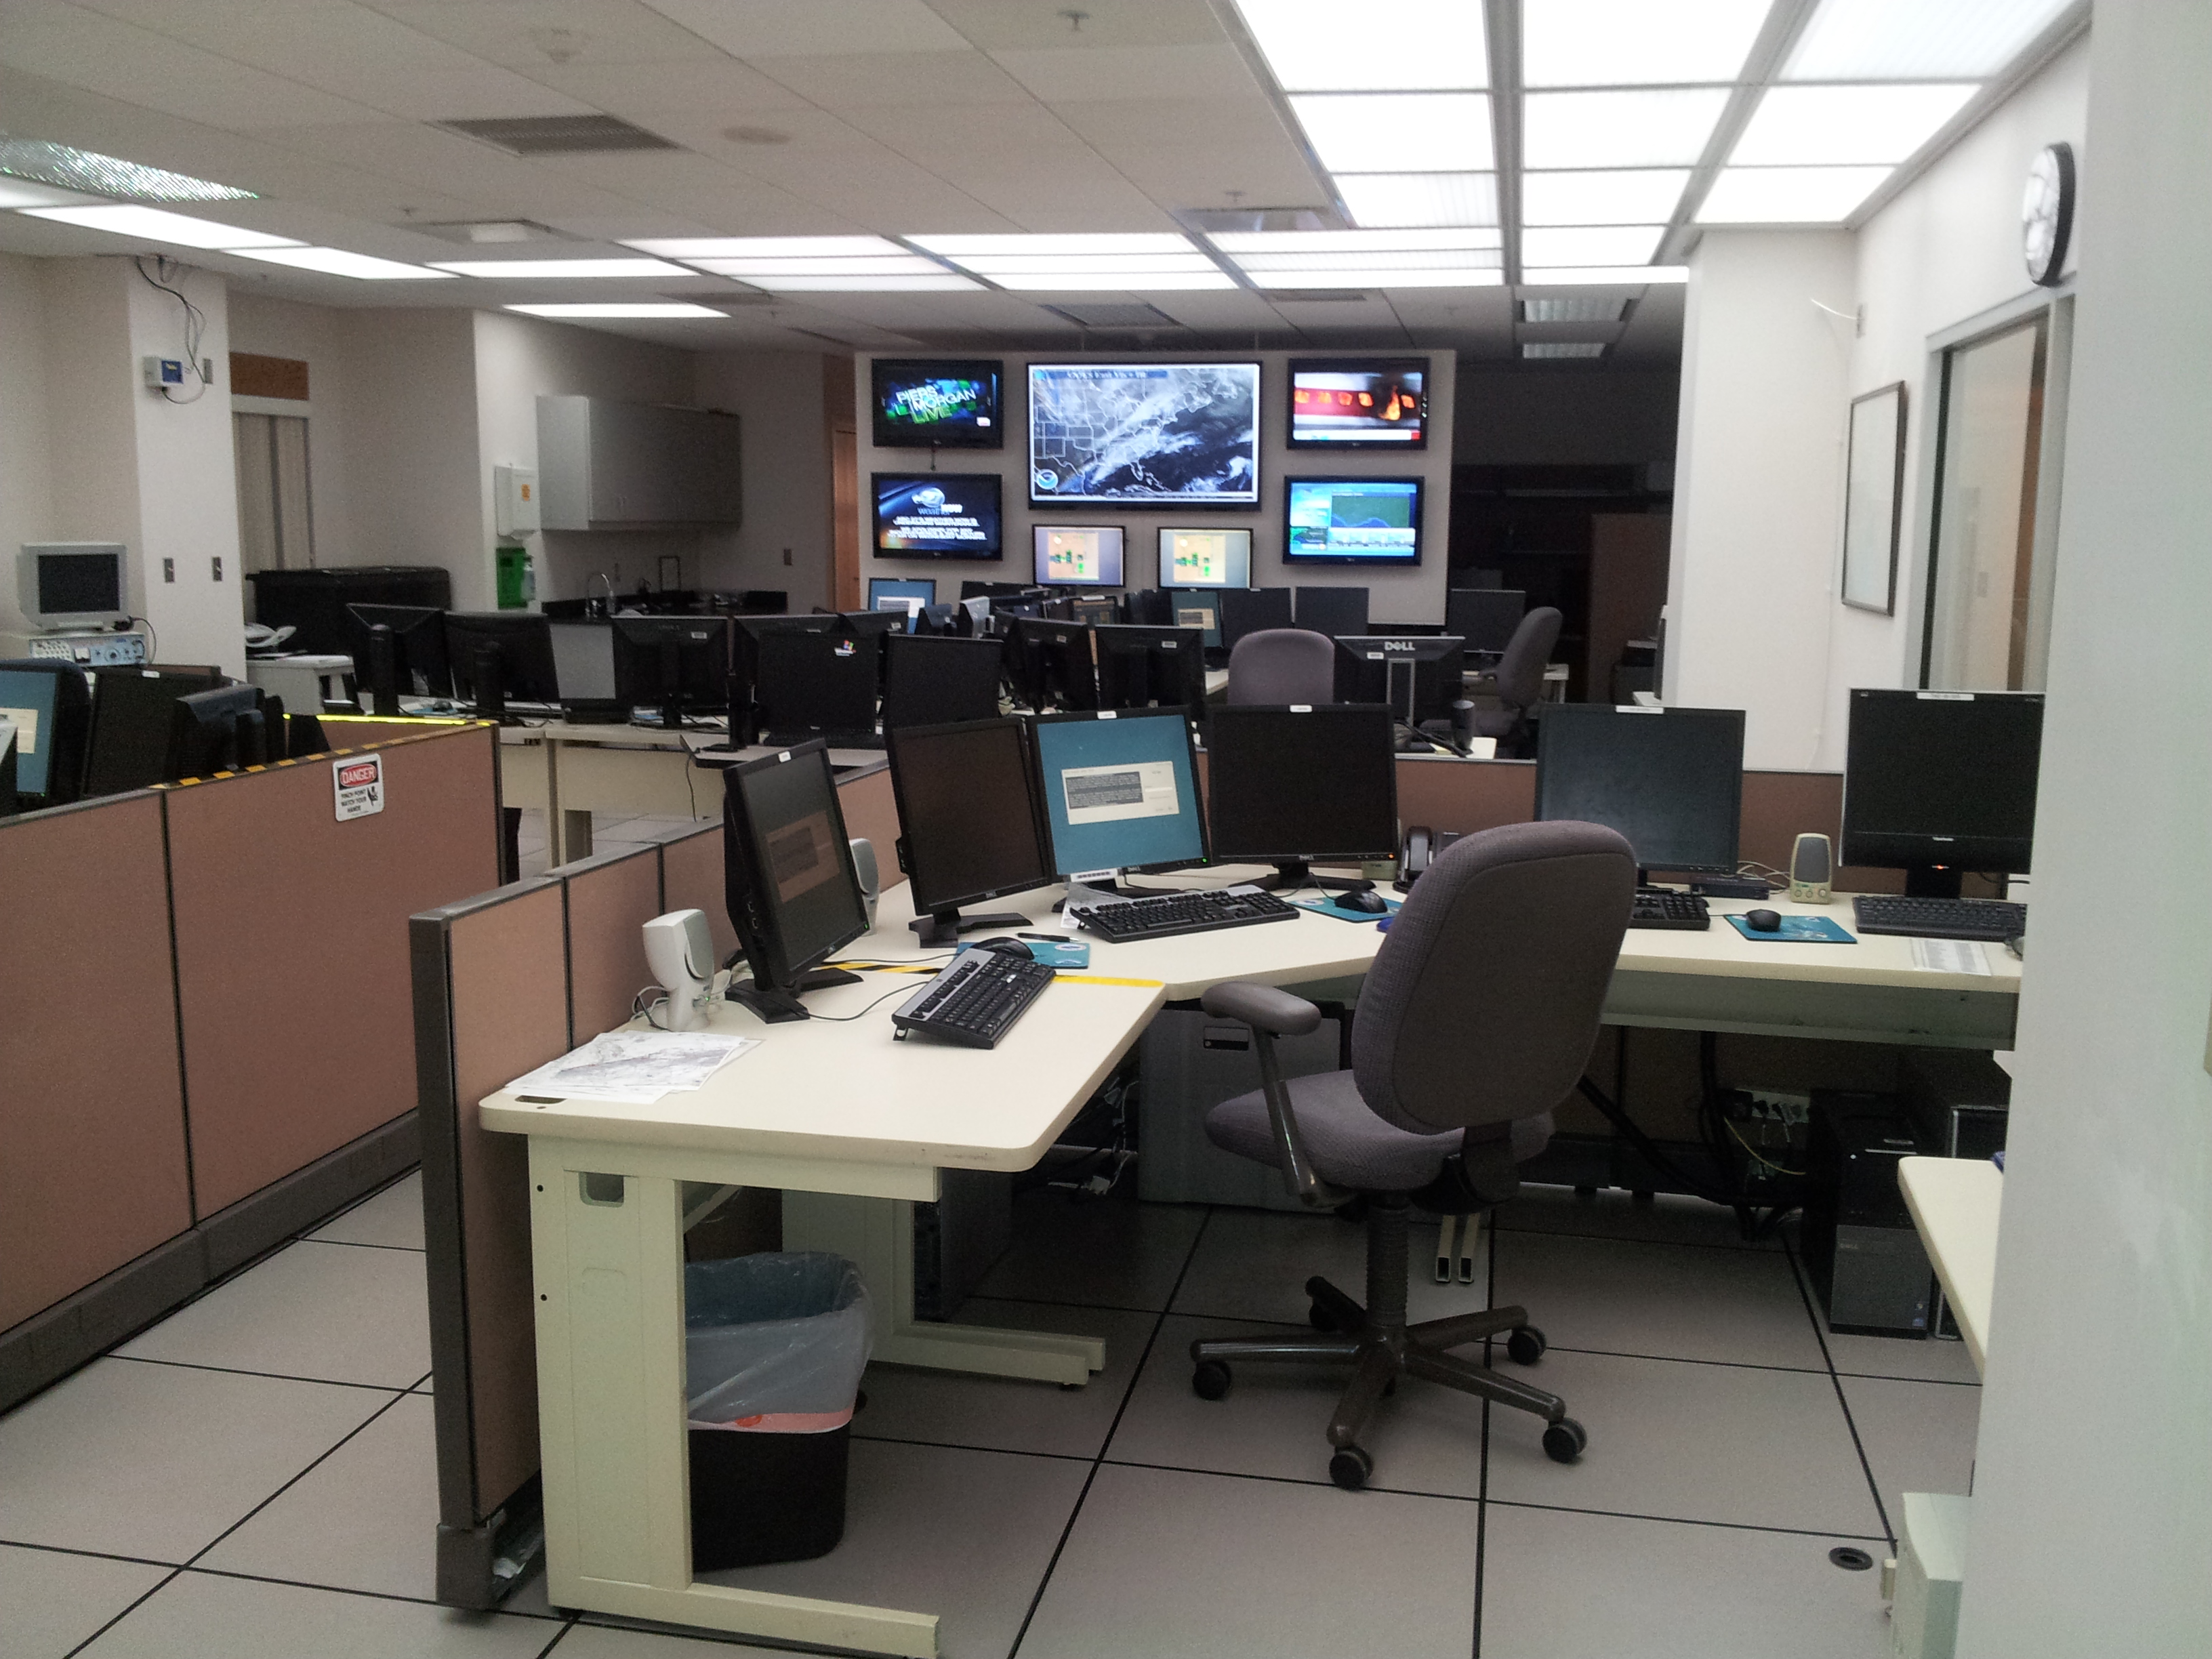
Here's where it all comes together. Welcome to the Forecast Operations Area. The operations room you see here is the heart and soul of NWS Tallahassee. It is here that we compose all of the warnings and forecasts that are issued by this office. Obviously, computers play a large role in the job of weather analysis and forecasting. Most of the computers you see here are a part of AWIPS, the Advanced Weather Interactive Processing System, which is our primary computer system.
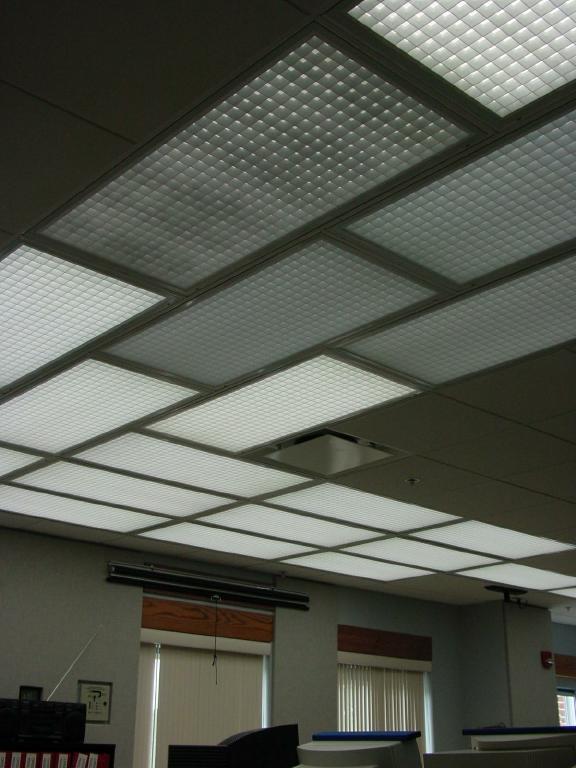
Since the office is always open, operational personnel are required to work rotating shifts. In order to help the night shift stay alert while on duty and sleep better during the day, a state-of-the-art, computer-controlled, circadian lighting system (pictured below) was installed as the office was built. The Tallahassee office is one of only two NWS offices nationwide to benefit from this type of lighting system.
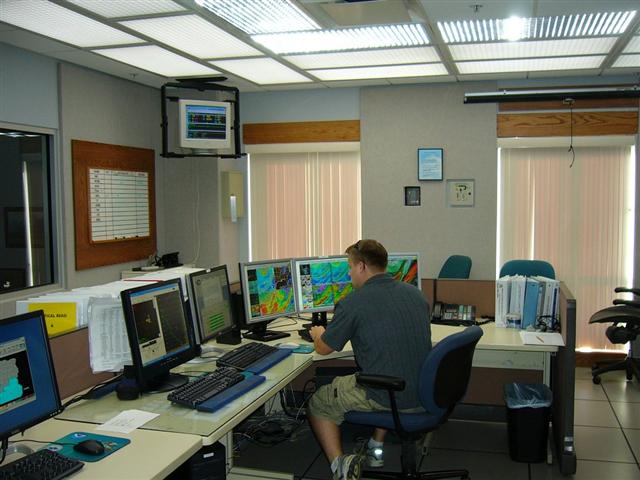
There are always at least two forecasters on duty in the operations area 24 hours a day. One forecaster, referred to as the public forecaster (pictured below), writes forecasts intended for the general public, such as the Zone Forecast. This is the forecast of sky condition, temperature, wind, and rain chance that most folks are familiar with. This same forecaster will also compose the Coastal Waters Forecast of winds, waves and weather on the Gulf of Mexico, a technical Area Forecast Discussion, the Hazardous Weather Outlook, and any non-routine products that are necessary to alert the public to hazardous weather. Some of the most common products of this type include freeze warnings, dense fog advisories, heat advisories, and flood watches and warnings.
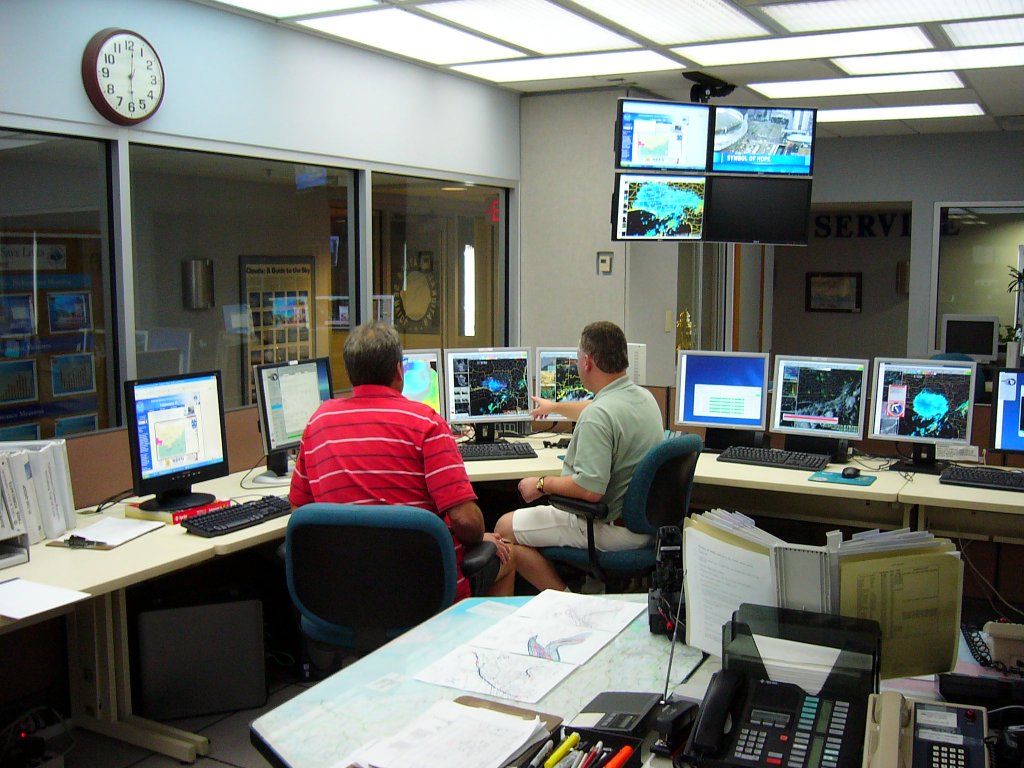
A second forecaster (pictured above) will write forecasts tailored to specific user groups. For example, he/she will write a coded forecast intended for use by airports, pilots and others associated with the aviation industry. These are called TAFs. This forecaster also prepares a routine Fire Weather Forecast. The fire weather forecaster also prepares any Red Flag Warnings or Fire Weather Watches that may be necessary, and issues spot forecasts on demand to help foresters with prescribed burns or wild fires. During severe weather, this forecaster would man the radar and put out any warnings necessary for tornadoes, severe thunderstorms, or flooding. As staffing allows, we try to schedule additional forecasters to monitor the radar at times when the other forecasters are at their busiest preparing our routine products.
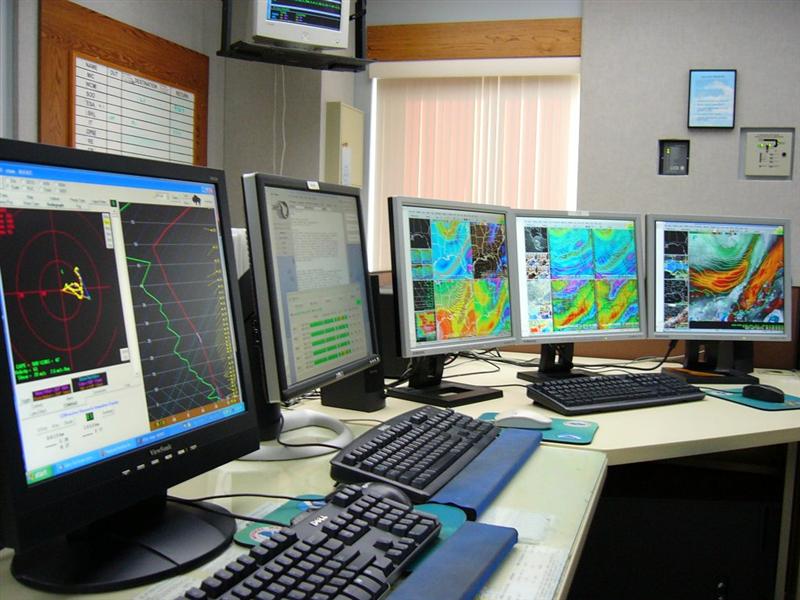
Both forecasters prepare their various forecasts at workstations like the one pictured above. In the foreground is a PC that forecasters use to access the internet and e-mail, as well as to interrogate weather analysis software, such as the BUFKIT software pictured in the image that is used to analyze model sounding data. Adjacent to the PC is the main system we use to prepare our forecasts, called the Advanced Weather Interactive Processing System, or AWIPS. This state-of-the-art computer hardware and software allow forecasters to view many different types of meteorological data on one system. Each AWIPS workstation consists of three graphics monitors and one text workstation. There are six AWIPS workstations in our office. The "brains" of the entire system is pictured below.
The graphics monitors are capable of displaying up to 20 different windows, each containing its own display of weather information. Forecasters interrogate radar and satellite imagery, lightning data, upper air data generated by weather balloons, observed surface weather, and a plethora of numerical model data. These fields can be looped, zoomed, and even overlaid on one another. Prior to AWIPS, forecasters had to use several different machines to view all of these different types of data. The text workstation is used to prepare and disseminate forecast and warning products as well as to look at various text products such as weather discussions.

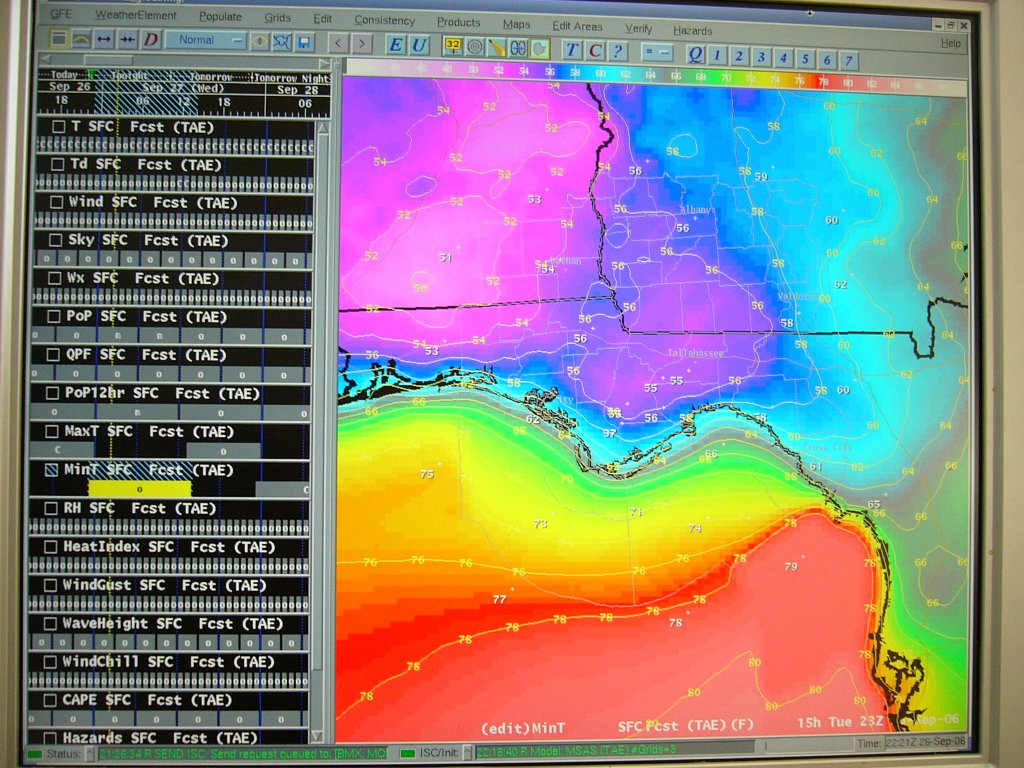
In late 2002, NWS Tallahassee began using on a new system that changed the way we prepare forecasts, the Interactive Forecast Preparation System (IFPS) and the Graphical Forecast Editor (GFE). For decades, forecasters have spent time analyzing observations and model data and then typing their forecasts. With IFPS/GFE (pictured below), forecasters manipulate the actual model guidance in digital format and the computer then automatically generates all of the various text products from this digital database. In addition to the traditional text products, an entire suite of forecast graphics are produced and posted to our web page. The latest graphics are available here.
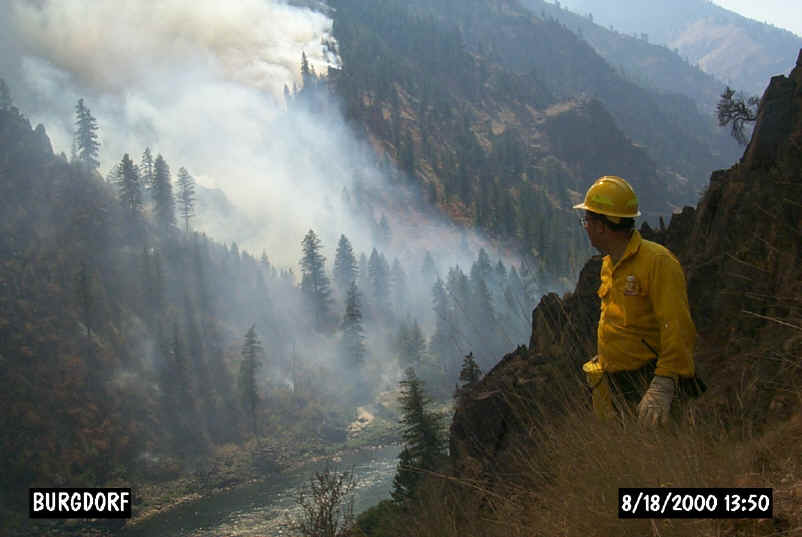
While most of our forecasting takes place here in the forecast office, specially trained forecasters are occasionally detailed from some offices to work on location at the site of wildfires, oil spills and other HAZMAT incidents. The forecaster, known as an Incident Meteorologist or IMET, is responsible for providing microscale meteorological support to the incident management teams. One IMET that formerly worked in our office, Mike Edmonston, is pictured below at the site of the Burgdorf Junction wildfire that occurred in Idaho in August 2000. To see additional photos, visit our Fire Weather Photo Gallery.
Photos courtesy of NWS.
Several communication systems are in place to support special communications of emergency information to our customers. Our primary contacts for dissemination of severe weather information are the State Warning Points for Florida, Georgia, and Alabama, and the various County Emergency Managers. These officials then ensure that other state and county agencies and the public are informed of the weather hazard.
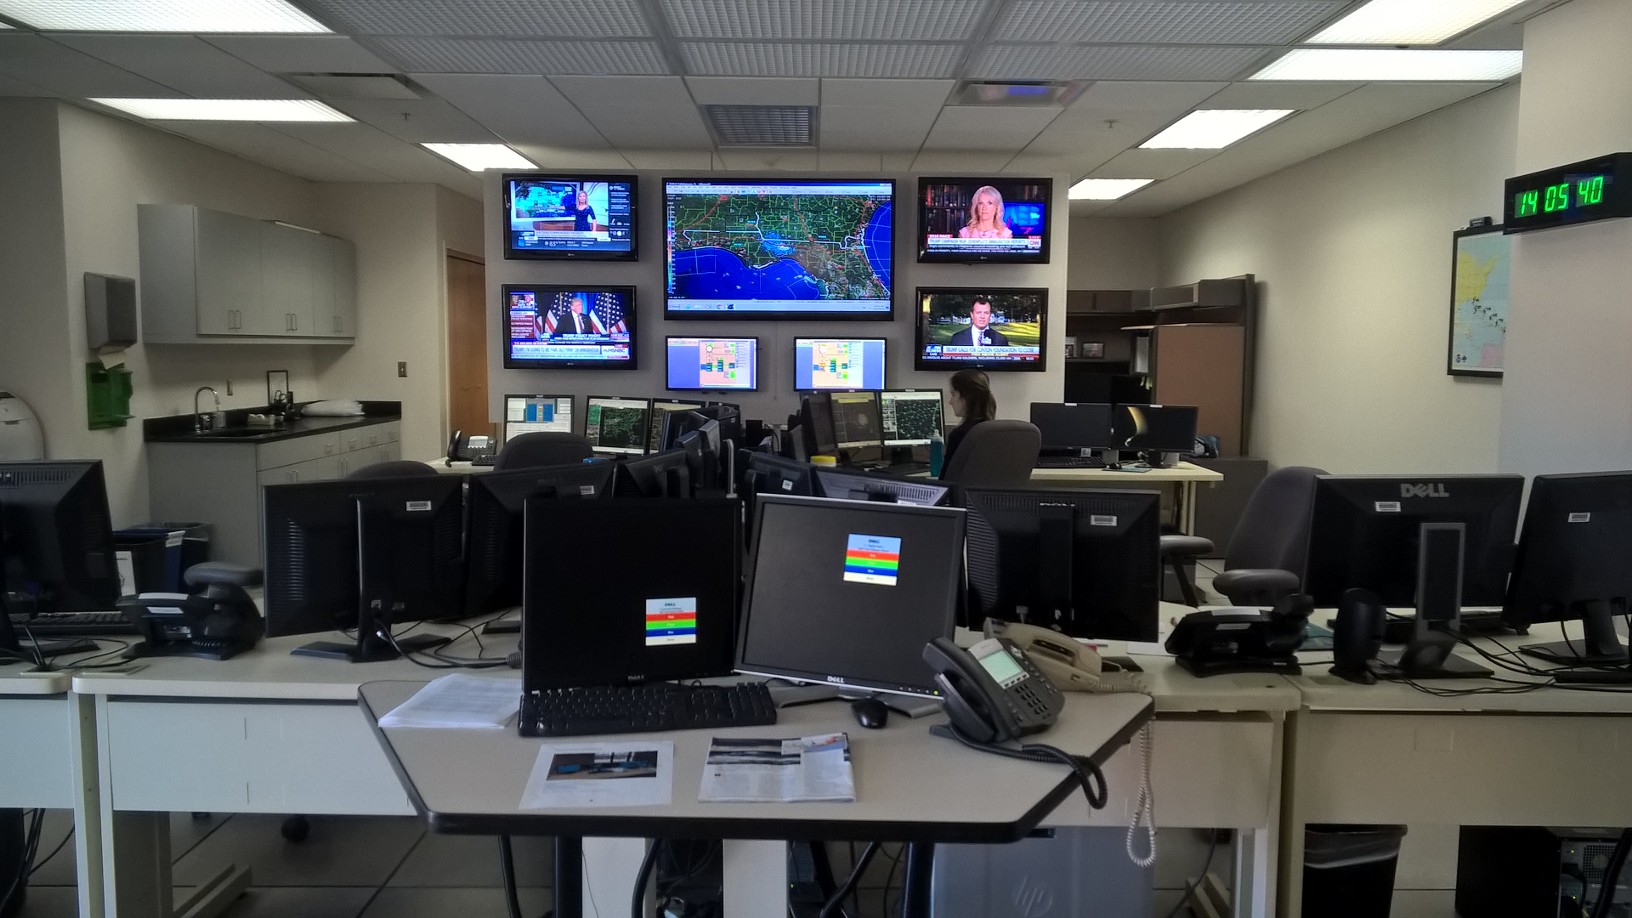
Above is a picture of our Situational Awareness Display and in the foreground is a workstation that is manned by an extra meteorologist during severe weather or tropical events. This individual, often one of our managers, fosters communication of critical information between the warning forecasters (pictured at other workstations) and our first responders in the emergency management and media communities. Our PCs have a chat room that we use to communicate with local media outlets, both television and radio. We have a satellite-based phone system called Southern Linc that we use to communicate with our Alabama county emergency managers. There are two light-colored telephones in the foreground. One of these is the Hurricane Hotline. This hotline is administered by NOAA and is used as our primary internal coordination tool during Hurricane Season. This system allows forecasters at the National Hurricane Center in Miami to coordinate their forecasts, watches and warnings with the many NWS Forecast offices that may be impacted by any given tropical storm or hurricane. Regional and national forecast centers such as the Storm Prediction Center (SPC) and the Weather Prediction Center (WPC), as well as forecasters at our East Coast Naval bases, and representatives from the Dept. of Homeland Security participate in these conference calls. The nearest light colored phone in the picture connects us to the National Warning System, or NAWAS. NAWAS is a communications system administered by the Federal Emergency Management Agency (FEMA). It is used solely for emergency communications between government agencies. NAWAS is the system used by many NWS offices to contact their various state emergency management agencies. We also have a system called EMnet that is a simplex satellite system that allows us to communicate severe weather information to our Florida counties.
One of the chief means of product dissemination in use by the NWS today is the one you are using right now, the Internet. Once you reach our homepage, your are just a few clicks of the mouse away from every one of the products that are issued by this office. Of course, everyone does not have access to the Internet, for example boaters out on the Gulf of Mexico. In addition, unless your are sitting in front of your computer, you will not get immediate notification of watches and warnings.
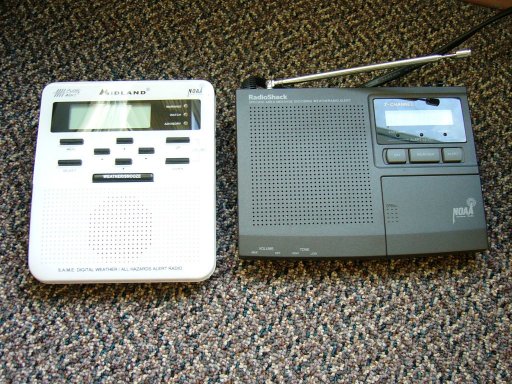
Even though it has been around for a while, NOAA Weather Radio (NWR) remains one of the best ways to get NWS watches and warnings instantaneously. The units, like the one pictured below, are mobile and can be set to alert you to severe weather using an alarm.
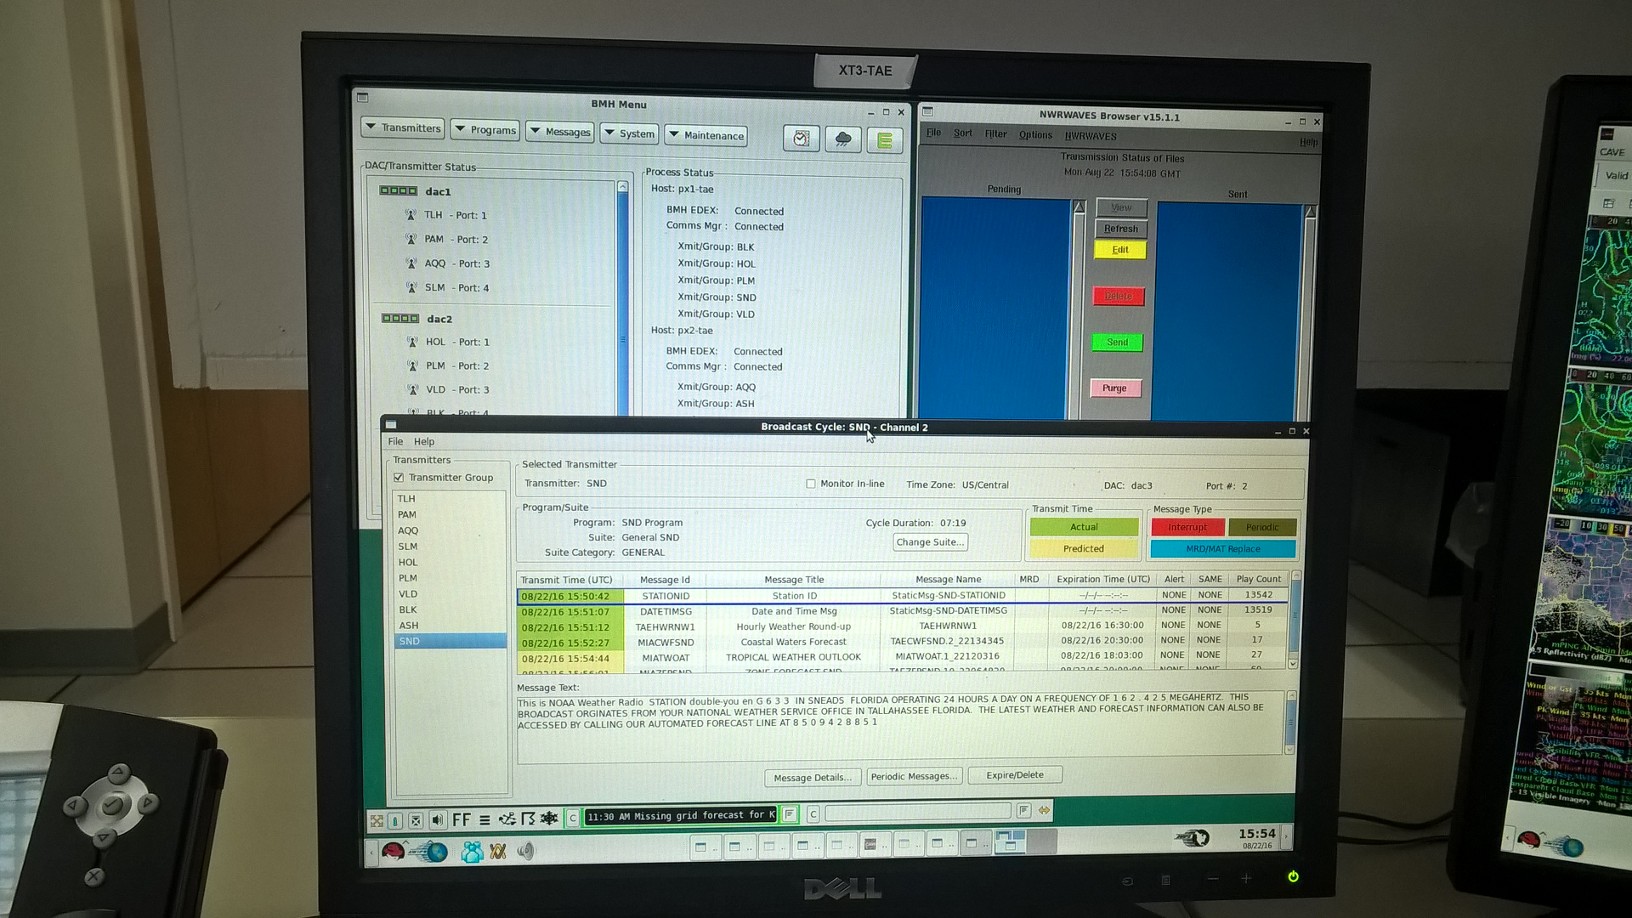
Several ago, NWS personnel had to print a hardcopy of the products and then go to a special sound proof room to manually record all of our products onto tapes. This resulted in a delay between the issuance time of products, and the time they were played on NWR. In addition, the tapes often broke. This tape cartridge system was then replaced by digital consoles. This alleviated the tape breaking problem and improved audio quality, but still required a person to "rip and read" all of the products. In the late 1990s, the digital consoles were replaced by the appropriately named Console Replacement System (CRS). Former OPL Jim Bolden is pictured below using the CRS, which was located right in the operations area. CRS translated text products into a computer-generated voice. This allows people to get the watches and warnings as soon as they are issued by our forecasters.

Recently the system was upgraded to the Broadcast Message Handler which is apart of AWIPS and is accessible at each workstation.
 |
The SKYWARN program is an essential part of achieving our NWS mission of protecting lives and property. Since SKYWARN began in the 1970s, thousands of volunteers have helped the NWS issue more accurate and timely severe weather warnings by acting as spotters. The role of the spotter is to serve as the eyes and ears of the NWS during severe weather situations. Even with all the new technology available to NWS forecasters that we covered at previous tour stops, an accurate report from a SKYWARN spotter often provides the critical piece of information needed by the forecaster to issue a timely life-saving warning. |
Most SKYWARN volunteers are involved with amateur (HAM) radio, because HAM radio operators are well-equipped to relay their reports of severe weather. HAM radio operators are a valuable resource to the NWS because of their ability to communicate during times of severe weather when other communication media may fail. Many HAMs have radios in their cars, which allows them to "go mobile" and get to areas where severe weather is occurring.
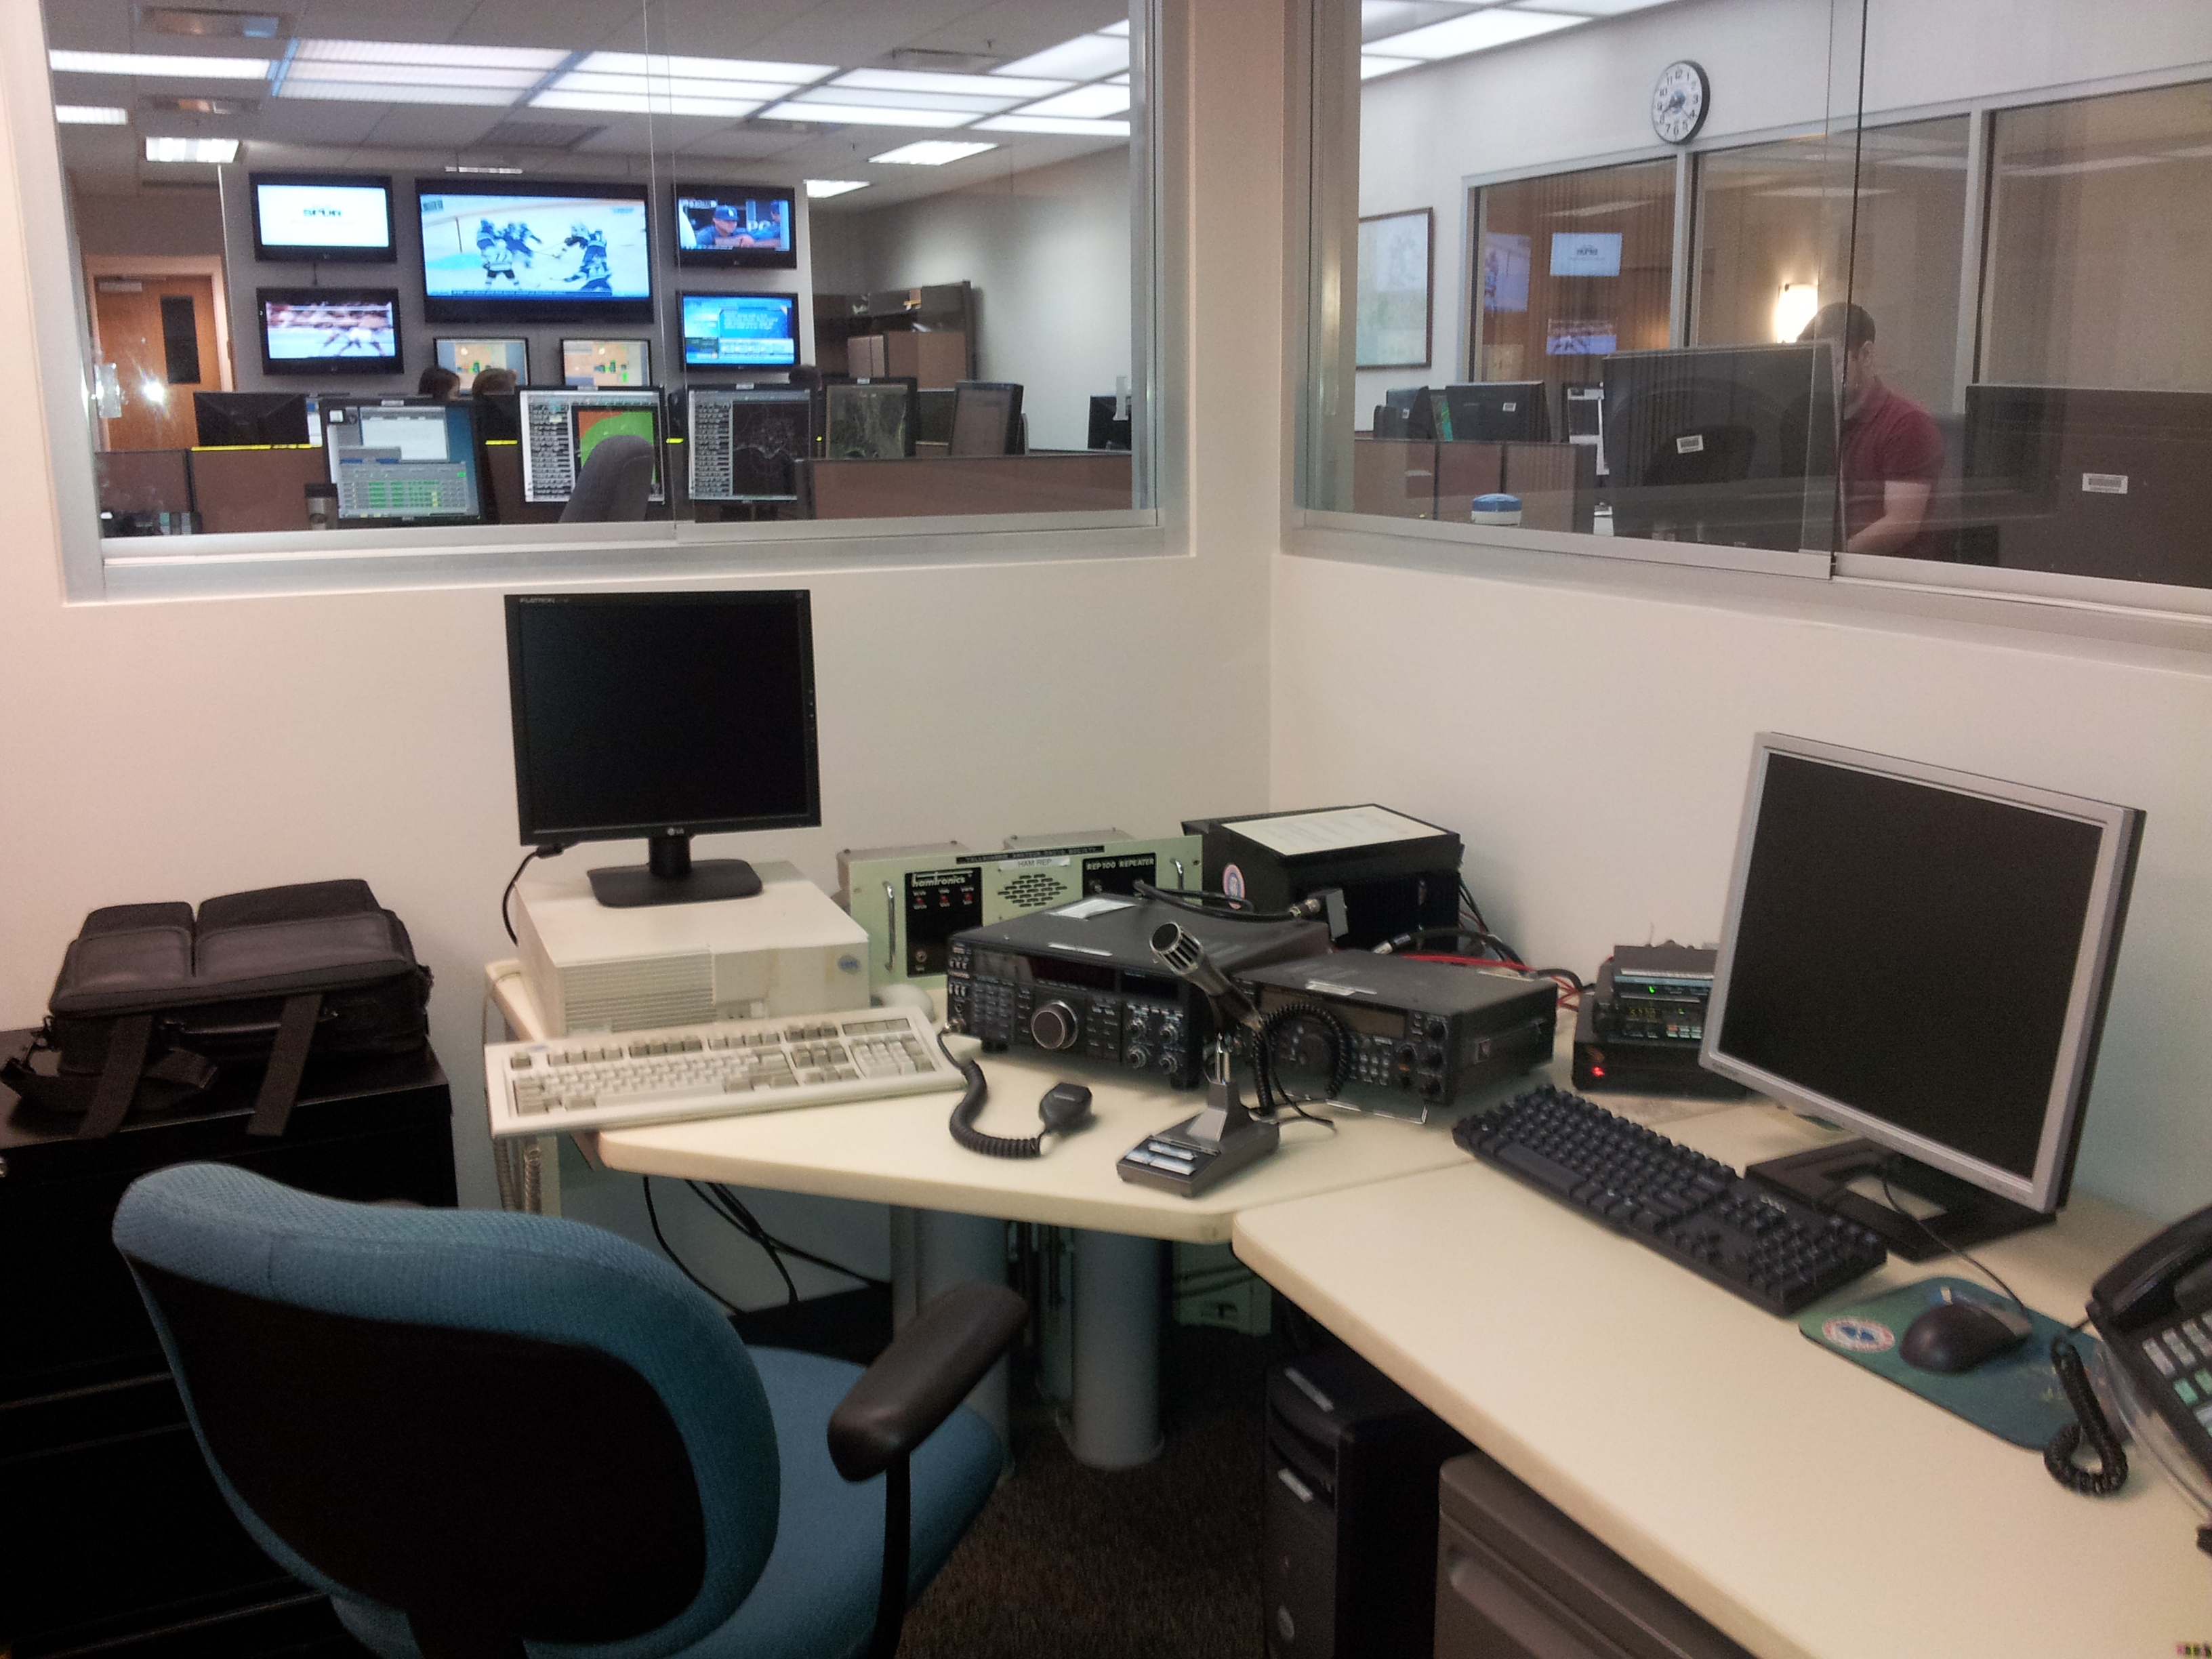
When we activate SKYWARN, we try to schedule one or more HAM operators to come into the NWS office to use the station pictured above. This HAM acts as a network controller by relaying information between other HAMs in the field and NWS personnel. HAMs report their positions and eyewitness reports, while NWS personnel give information about storm locations and motions.
Additional information about SKYWARN and HAM volunteers is available on our SKYWARN homepage.
Photos courtesy of NWS.
While most folks care about what the weather will be like here near the ground, it would be very difficult for us forecasters to accurately predict that weather if we didn't also know what was happening at upper levels of the atmosphere. While satellite, radar and wind profiler technology can certainly provide us with valuable information, one tried and true method of gathering data has stood the test of time - weather balloons! Weather balloons are launched from hundreds of locations around the world twice a day, every day of the year. The launches occur nearly simultaneously worldwide! This gives meteorologists a snapshot of the earth's three-dimensional atmospheric conditions.
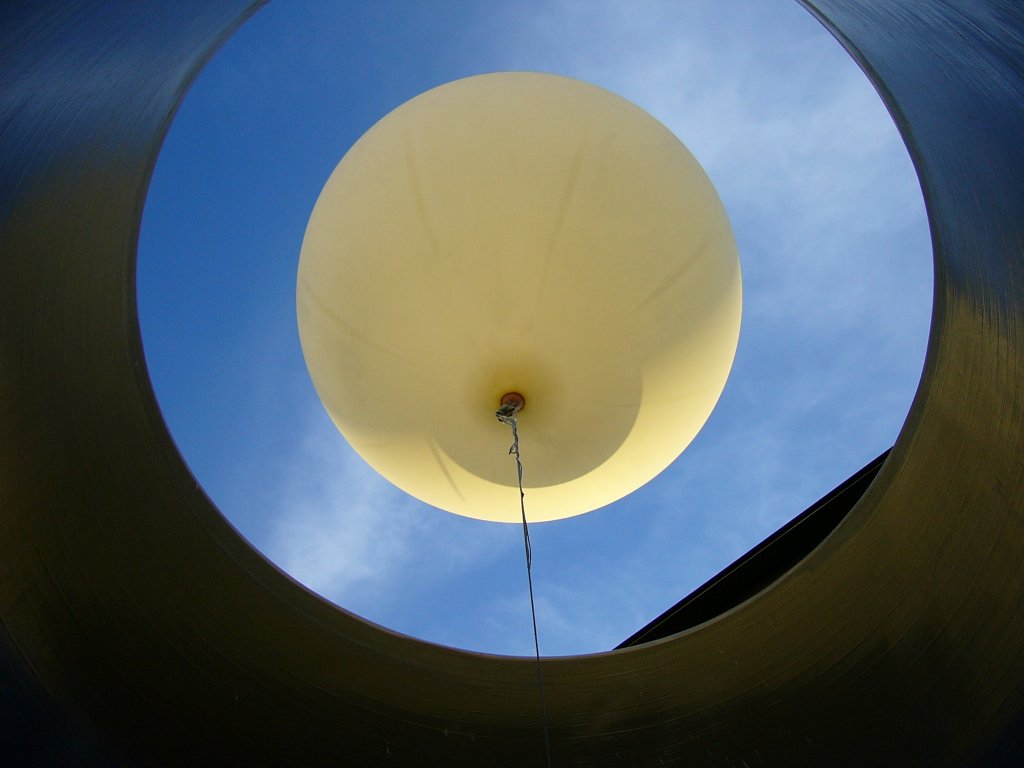
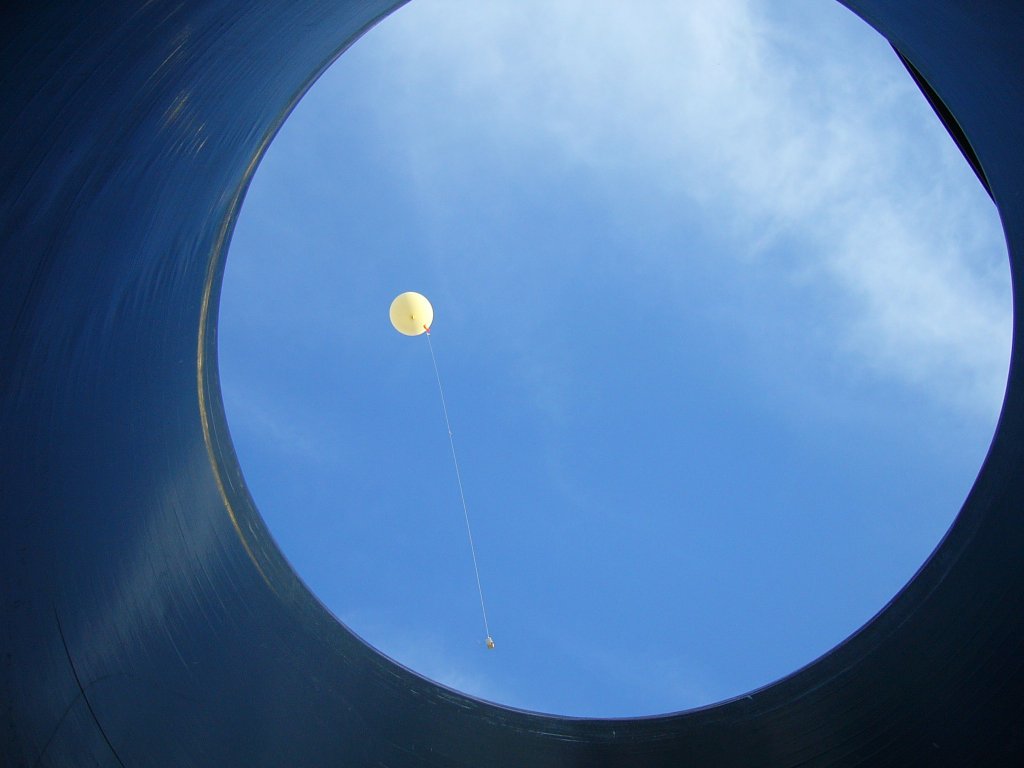
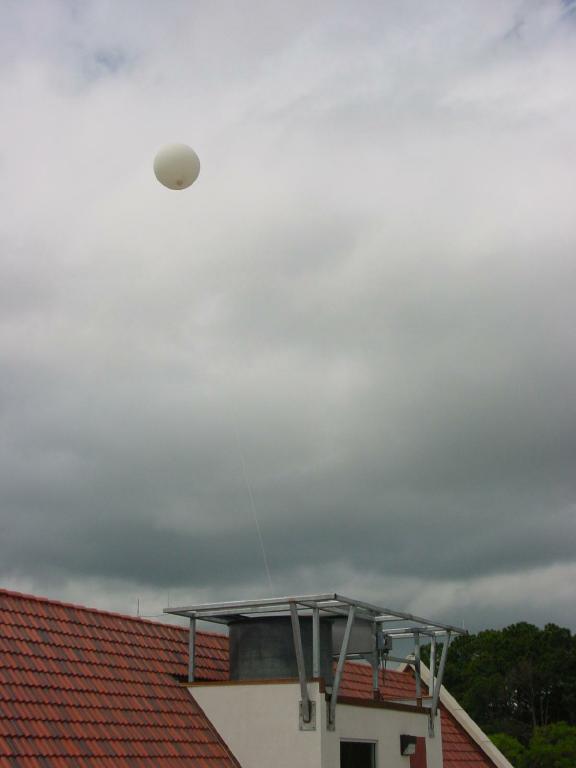
Weather balloons are launched from the roof of our building from the shelter pictured above. The balloons are filled with helium inside of the shelter, then released. The helium, which is a very light gas, allows the balloon to reach heights of 60,000 feet above the earth's surface in about an hour. As the balloon rises, the atmosphere thins and the pressure outside the balloon decreases allowing the balloon to expand and eventually break. This usually happens within two hours of the launch at elevations of 80,000 to 120,000 feet.
An instrument, called a radiosonde, is tethered to the balloon. As the balloon rises through the air, the radiosonde measures temperature, relative humidity, and pressure. A GPS transmitter within the radiosonde transmits this data back to a tracking unit located atop the building. This unit tracks the azimuth and range of the balloon as it ascends. From this information, the wind speed at various levels in the atmosphere can be calculated. After the balloon flight is complete, a technician ensures the data is accurate before it is disseminated at the workstation pictured below. Additional quality control checks are done at one of our national centers before the data is incorporated into computer models which meteorologists use to make their forecasts.
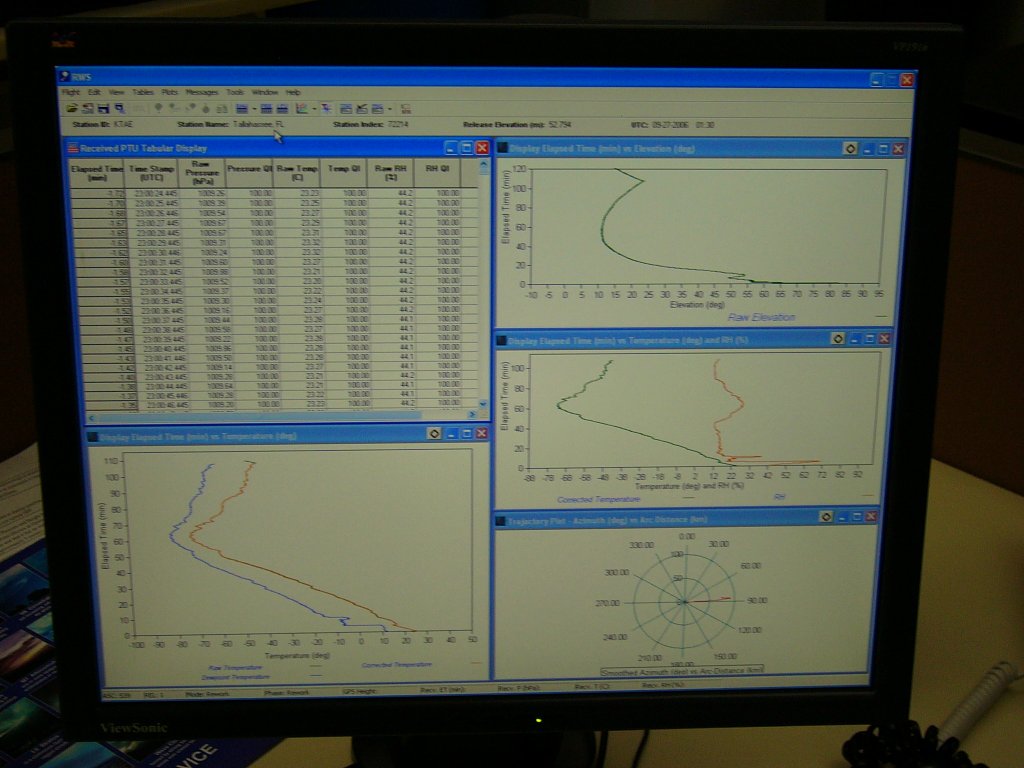
Check out our most recent Tallahassee Upper Air Sounding Plot from the 0000 UTC or 1200 UTC (8:00 p.m. or 8:00 a.m. EDT) weather balloon launch.
Photos courtesy of NWS.
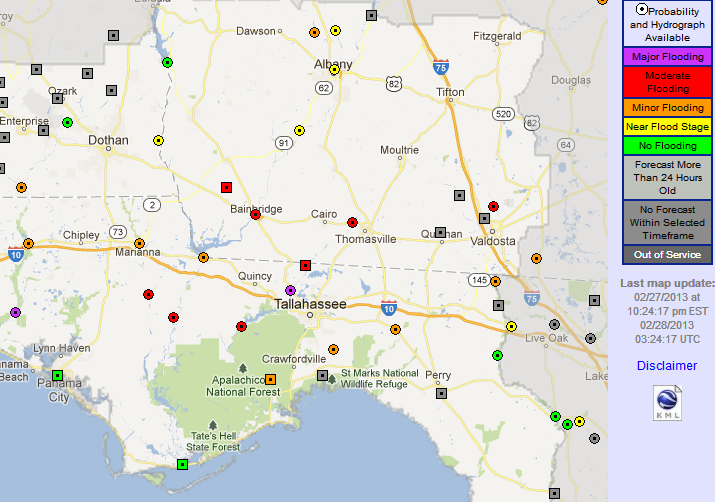
The weather isn't the only thing we forecast in the National Weather Service. Streamflow prediction is another major program in our organization. As mentioned at the beginning of the tour, their are 13 River Forecast Centers (RFCs) across the U.S. The Southeast RFC (SERFC) serves our local hydrologic service area. The SERFC issues stage forecasts for specific points along rivers, special forecasts for rivers that are in flood, quantitative precipitation forecasts, and flash flood guidance. Here at the forecast office, we use this information to write Flood Potential or River Flood Outlooks, Flood Warnings and Statements, and urban and small stream flood advisories. Our Senior Service Hydrologist oversees the hydrology programs at both the Tallahassee and Jacksonville forecast offices. Jacksonville serves southeast Georgia and northeast Florida. The image below is a screen shot from our Advanced Hydrologic Prediction System (AHPS) web page that shows many of the river gages that we monitor across the region. This particular event shows responses on area rivers on February 27, 2013 when many river forecast points were in moderate or major flood.
I hope you enjoyed your virtual visit to the National Weather Service Office in Tallahassee. But before you go, browse the photo gallery below which includes pictures that were taken during the construction and move-in phase. They should give you a good idea of how much work went into getting this office up and running. If you have any questions about the tour, or suggestions for improvement, please contact our webmaster.
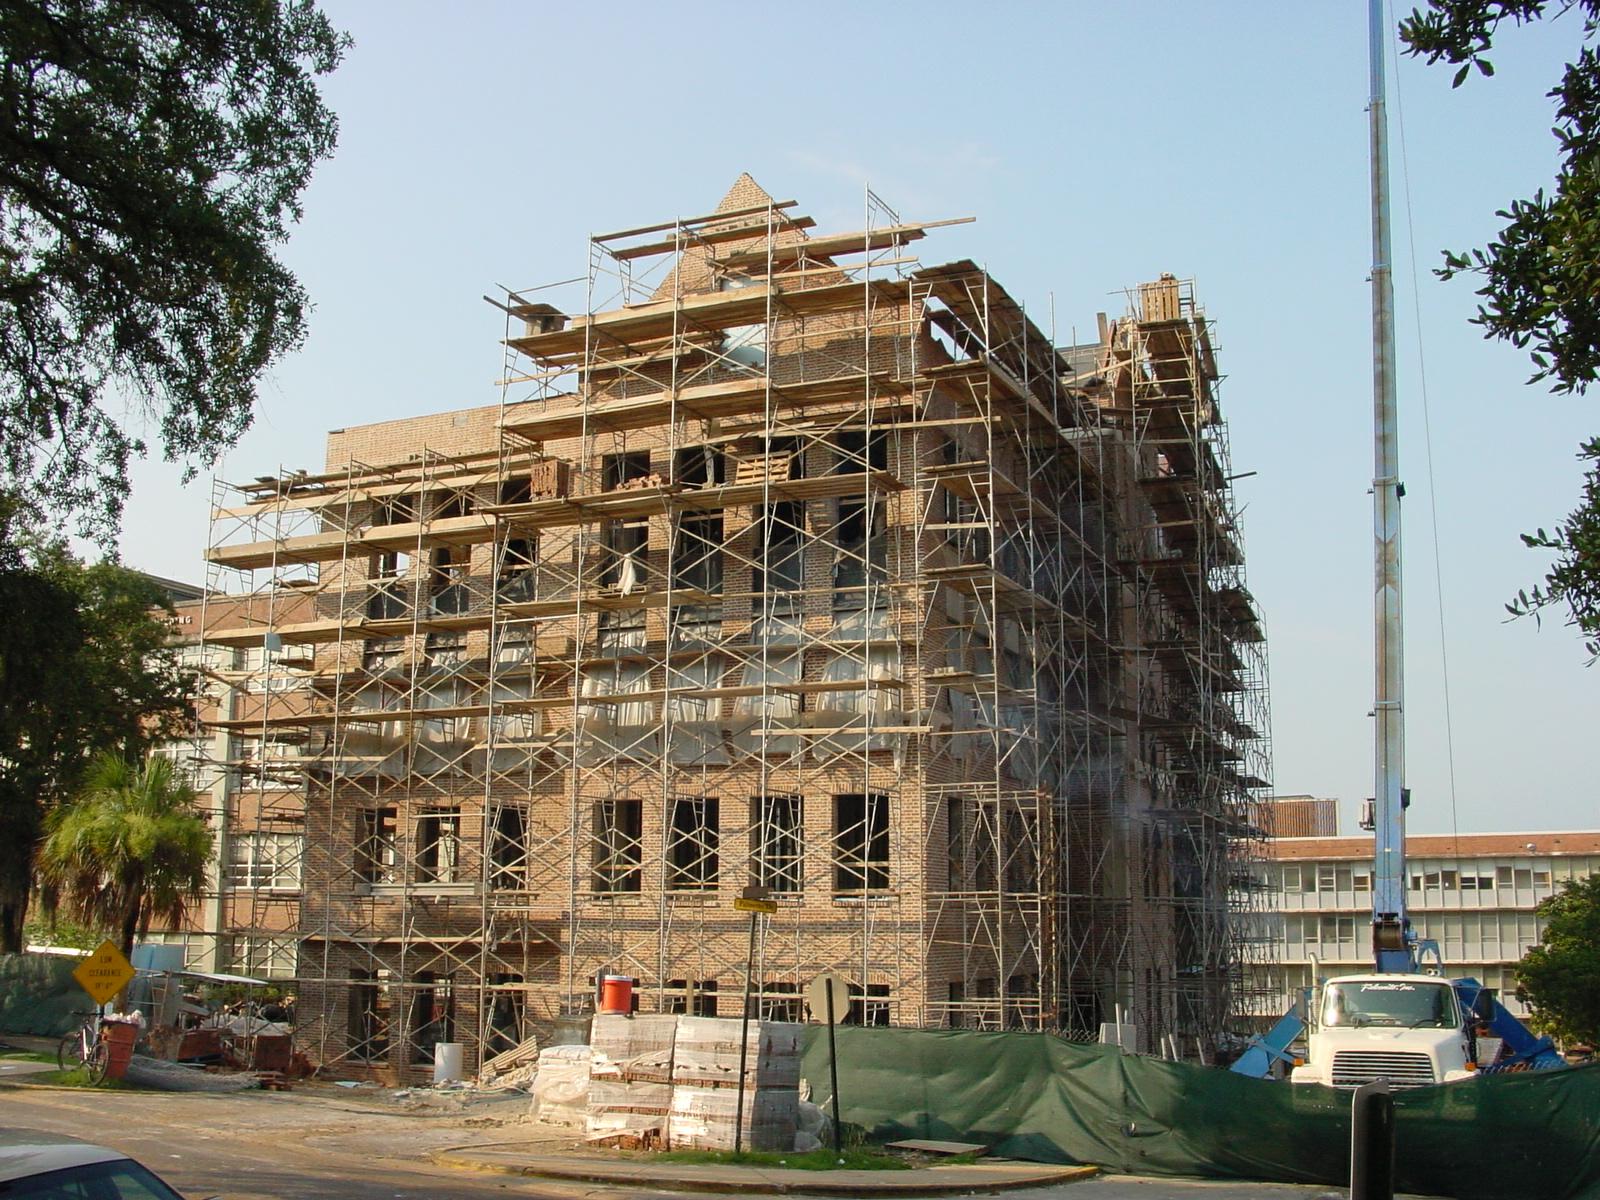
The Love Building addition while it was under construction in 2001

The entrance to our facility during the move-in process

One of our cubicles being assembled

Just a small percentage of the boxes that needed to be packed and unpacked

One of our HMTs connecting cables to one of our computers

Workers installing our mainframe AWIPS computer

A worker laying cable under the floor in our main operations room

The upper air targeting antenna being installed on our rooftop roan tower

Our HAM antenna begin installed on the roof

A new beginning: a picture of the first few moments our new facility became operational
Photos courtesy of NWS.


 Follow us on YouTube