Alabama Snow Study
Faith Borden & Tom Bradshaw
The following are results from a local snowfall study for the state of Alabama. This study focused on snowfall events from 1969 to 1999, during the months of December, January, February, and March. This is typically when Alabama receives the bulk of its snow. However, April of 1987 was also included because an event during this month fit the criterion, and was an interesting case. Data from December 1975, January 1990, and March 1998, were not available in the local office database, and were not included in this investigation.
The data were compiled from the publication, Alabama Climatological Data, produced monthly by the National Climate Data Center. There were a total of 84 cases, or approximately 2.8 events per year. An "event" was defined as a report of at least one inch of measurable snow somewhere in Alabama. Once the one inch criterion was met, half inch increments of snow were used. This means that a station must have reported at least a half of inch or of snow to be considered as being within the areal extent of the event. Based on this definition, multiple events could occur per month. Once the snowfall reports were collected for each event, the snow depths were plotted and contoured for each of the events on individual Alabama maps. Data from these maps were subsequently used to produce the graphs presented below.
Snowfall Events by Year Snowfall Frequency by Month Snowfall Frequency by Amount

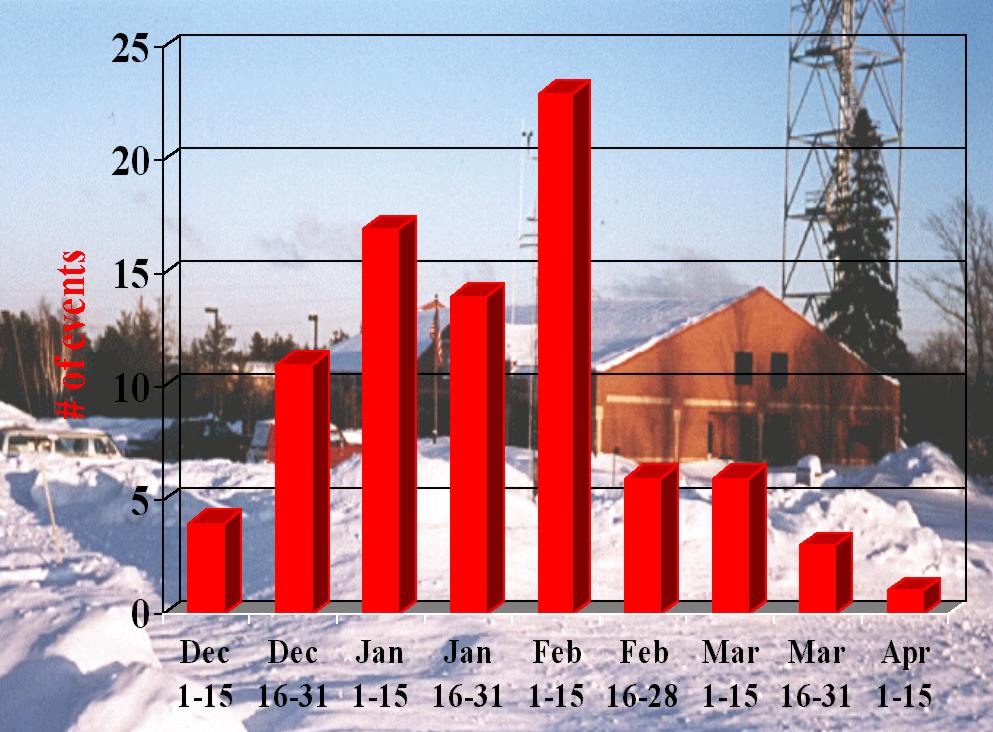

Figure 1 Figure 2 Figure 3
- Figure 1 is a graph showing the number of snow events by year. The most events occurring in one year were six, during the winters of 1970 (December 1969 to March 1970), 1971 (December 1970 to March 1971), and 1984 (December 1983 to March 1984). The only year that did not have a snow event that met the criterion was 1976, (December 1975 to March 1976). This does not mean it may not have snowed somewhere in Alabama during that time, it just means that the one inch criterion was not met.
- Figure 2 shows the number of snow events per month for the whole 30-year period. The months were broken into two parts. Days 1-15, and days 16-end. February 1-15 tended to be the snowiest two week period in Alabama. There was a total of 22 events in the beginning of February that met the study's criteria. Overall, January was the snowiest month, with a total of 31 events. 17 events for January 1-15, and 14 events for January 16-31. The frequency of events decreases dramatically after the middle of February, with only 16 reports, approximately 1 event every other year.
- Figure 3 represents the 84 cases broken down into total snowfall for each event, by 2 inch increments. There were 48 events during which less than 2 inches of snow fell. 16 events had more than 2 inches but less than 4 inches. 13 events had more than 4 inches but less than 6 inches. 3 events had more than 6 inches of snow but less than 8 inches. At the higher end of snow accumulation per event, during the time period of this study, 1 event of the following occurred: between 8 and 10 inches of snow, between 10 and 12 inches of snow, between 14 and 16 inches of snow, and 16 to 18 inches of snow.
Climate Regions Defined by the Snowfall Events
National Climatic Data Center Snowfall Events by Region "Normalized" by Region
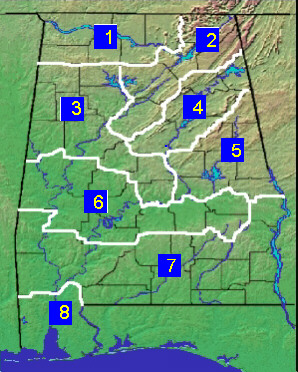
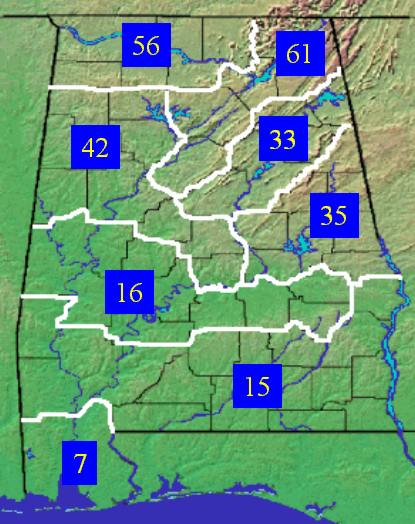
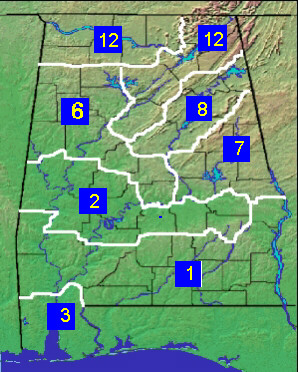
Figure 4 Figure 5 Figure 6
- Figure 4. Map showing climate regions defined by the National Climate Center.
- Region 1: Northern Valley
- Region 2: Appalachian Mountains
- Region 3: Upper Plains
- Region 4: Eastern Valley
- Region 5: Piedmont Plateau
- Region 6: Prairie
- Region 7: Coastal Plain
- Region 8: Gulf
- Figure 5. Map shows the total number of events, over the 30 year period, that met the study's criteria by region. These regions are the same as the ones depicted in Figure 4.
- Figure 6. Map depicts the same information as Figure 5, except that the number of events are normalized per 1000 square miles. To facilitate a comparison between the regions, the total square millage of each climate region was divided by the total number of events for that region. The most snow events, 12, occurred in Regions 1 and 2. Region 3 had 6 events, while Region 4 had 8. Region 4 is slightly greater than Region 3 because it includes more mountainous areas, while Region 3 also includes some of the plateau area of the state. As expected, the highest number of events occurred in the 2 northern most regions.

