For the second winter in a row, the cold and snowy weather was relentless for northern Ohio and northwest Pennsylvania . All of the major climate sites (Toledo, Mansfield, Cleveland, Akron-Canton, Youngstown, and Erie, PA) finished the winter with snowfall totals at or above normal. But, it was the record setting cold that occurred in February that will long be remembered. Most areas saw their coldest February ever and one of the coldest months of all time. Only January of 1977 was colder than February of 2015 in many areas. Overall temperatures for the winter of 2014-2015 were slightly warmer than those of the winter of 2013-2014. Schools throughout northern Ohio were closed many days because of the cold.
There were frequent storms producing a few inches of snow each instance in January. Both Mansfield and Youngstown finished the month with top ten January snowfall totals with 25.0 and 29.3 inches of snow respectively. Even northwest Ohio saw more than a foot of snow during the month. Temperatures took a downward turn and finished the month averaging two to four degrees below normal.
February will long be remembered for its brutal temperatures. Morning lows were at or below zero ten or more days during the month. On the 15th, high temperatures barely made it above zero. For the month, average temperatures were as much as 15 degrees below normal making February of 2015 the coldest on record at all but Toledo and Akron-Canton. The morning low of -17 at Cleveland on the 20th was the coldest February temperature ever for that day at that location and tied for the 4th coldest low ever. Wind chills on the 15th, 16th and 20th were as cold as minus 35 degrees prompting all schools to close. The most significant snow storm of the year impacted the area on the 1st and 2nd. Low pressure moved up the Ohio Valley and dumped more than a foot of snow north of a line from Bowling Green to Warren. South of this line there was a mixture of snow, sleet and freezing rain which caused massive traffic problems. Other storms produced periods of snow throughout the month. All of the major reporting sites finished the month with top 10 snowfall totals for February. In fact, Toledo had its snowiest February ever with 25.3 inches of snow.
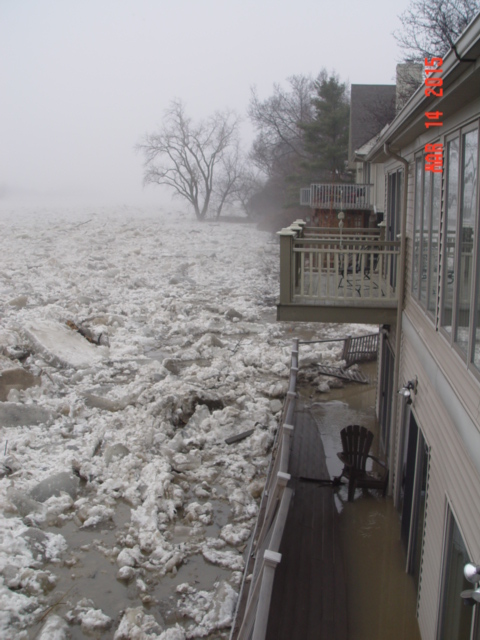
Temperatures remained cold during March with average temperatures again several degrees below normal. Snowfall totals of up to a foot were common during the month. When warmer weather finally returned later in the month, significant ice jam flooding occurred on northern Ohio rivers. Many homes and businesses were damaged by the flood waters.
From mid-January through early March of 2015, frigid and much below normal temperatures set the stage for ice jam development along rivers and creeks in the Lake Erie drainage basin. Lake Erie was 98% ice covered by March. The lake is the mouth for almost all of northern Ohio and Pennsylvania rivers and creeks. When the lake is ice covered, it becomes a barrier to the natural outflow of the rivers.
A rain event across the Ohio River Valley and Great Lakes Basin on March 13th resulted in rapid runoff. Though not significant, the runoff was sufficient enough to raise river levels. For those ice covered rivers jams quickly developed. The increased flow was forced to back up and out of the river banks. The ice jams shifted and moved between the 12th through the 18th until the rivers were able to empty into Lake Erie. During that time numerous communities were impacted by the ice jams.
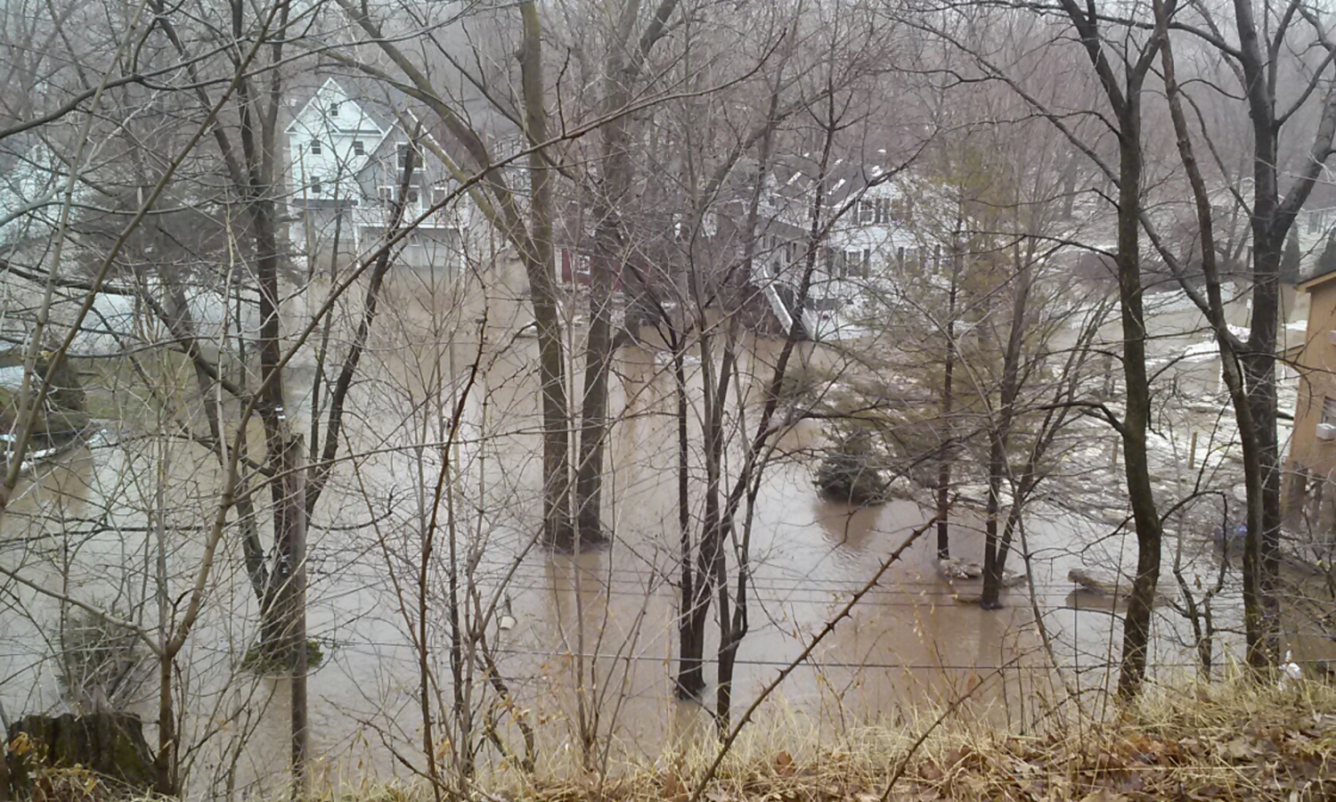
Chagrin River @ Willoughby Hills / Eastlake |
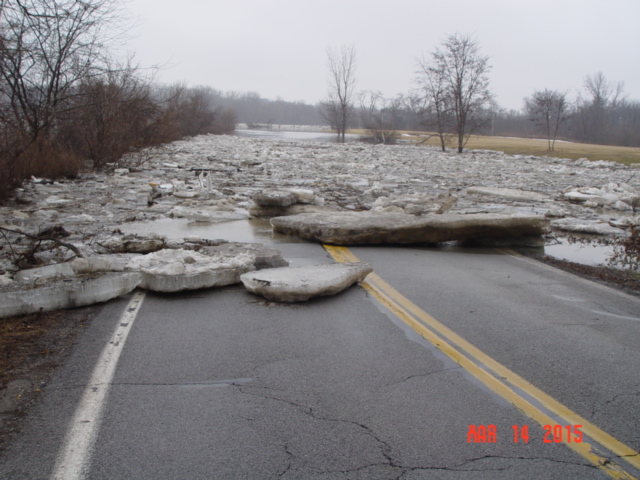
Sandusky River @ Fremont |
|---|---|
|
River ice on the Chagrin River near West Island Drive in Eastlake taken by Willoughby Hills FD |
South River Road in Fremont impacted by ice jams and ice jam related flooding between the 11th and the 16th of March. Photos by Emergency Manager Lisa Heyman. |
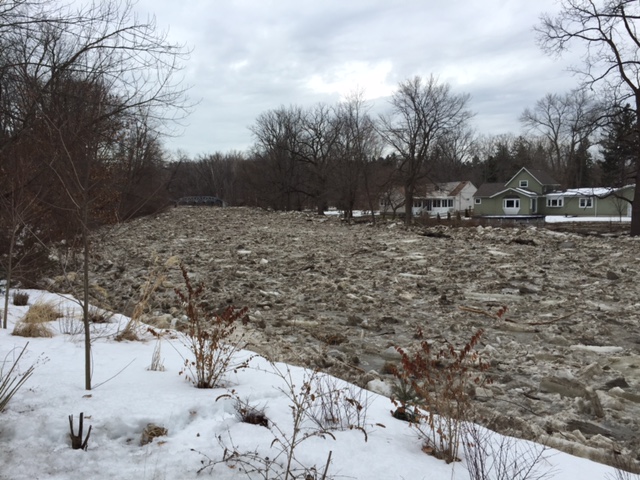
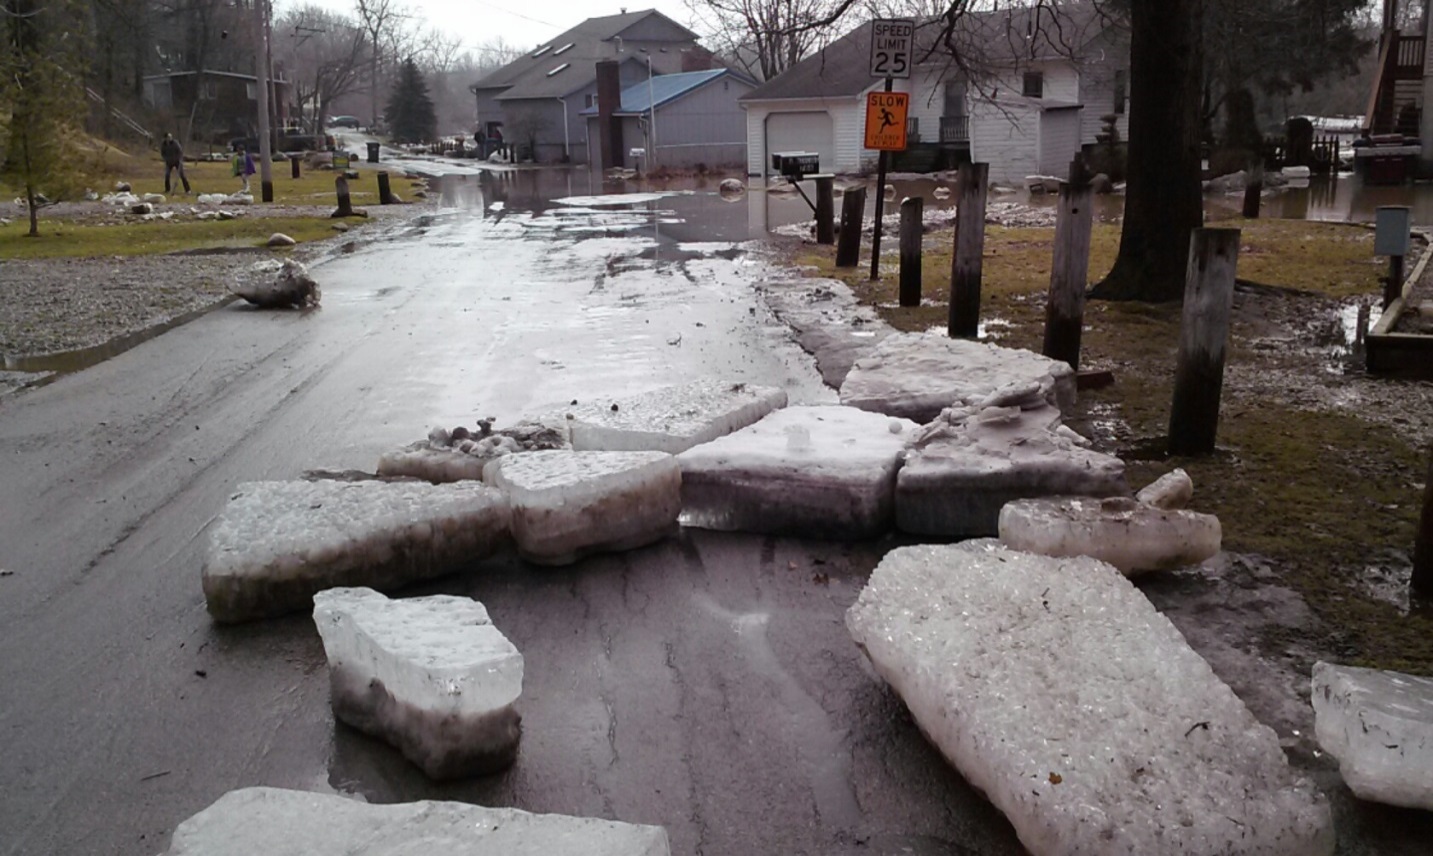
Vermilion River @ Vermilion |
Maumee River @ Monclova / Maumee |
|
Photo of the Riverside Drive community in Vermilion Ohio on Saturday March 14, 2015. The water was up to 5 feet deep over the roads after an ice jam break earlier that morning. Photo courtesy of Erie County EMA.
Photo of the Riverside Drive community in Vermilion Ohio on Saturday March 14, 2015. Ice chunks remained after the flood waters receded that afternoon. Photo courtesy of Erie County EMA. |
The Maumee River was blocked by an ice jam starting March 12th and lasting for 10 days. The image left is from Kevin Bernhard the Monclova Fire Chief taken on March 14th. |
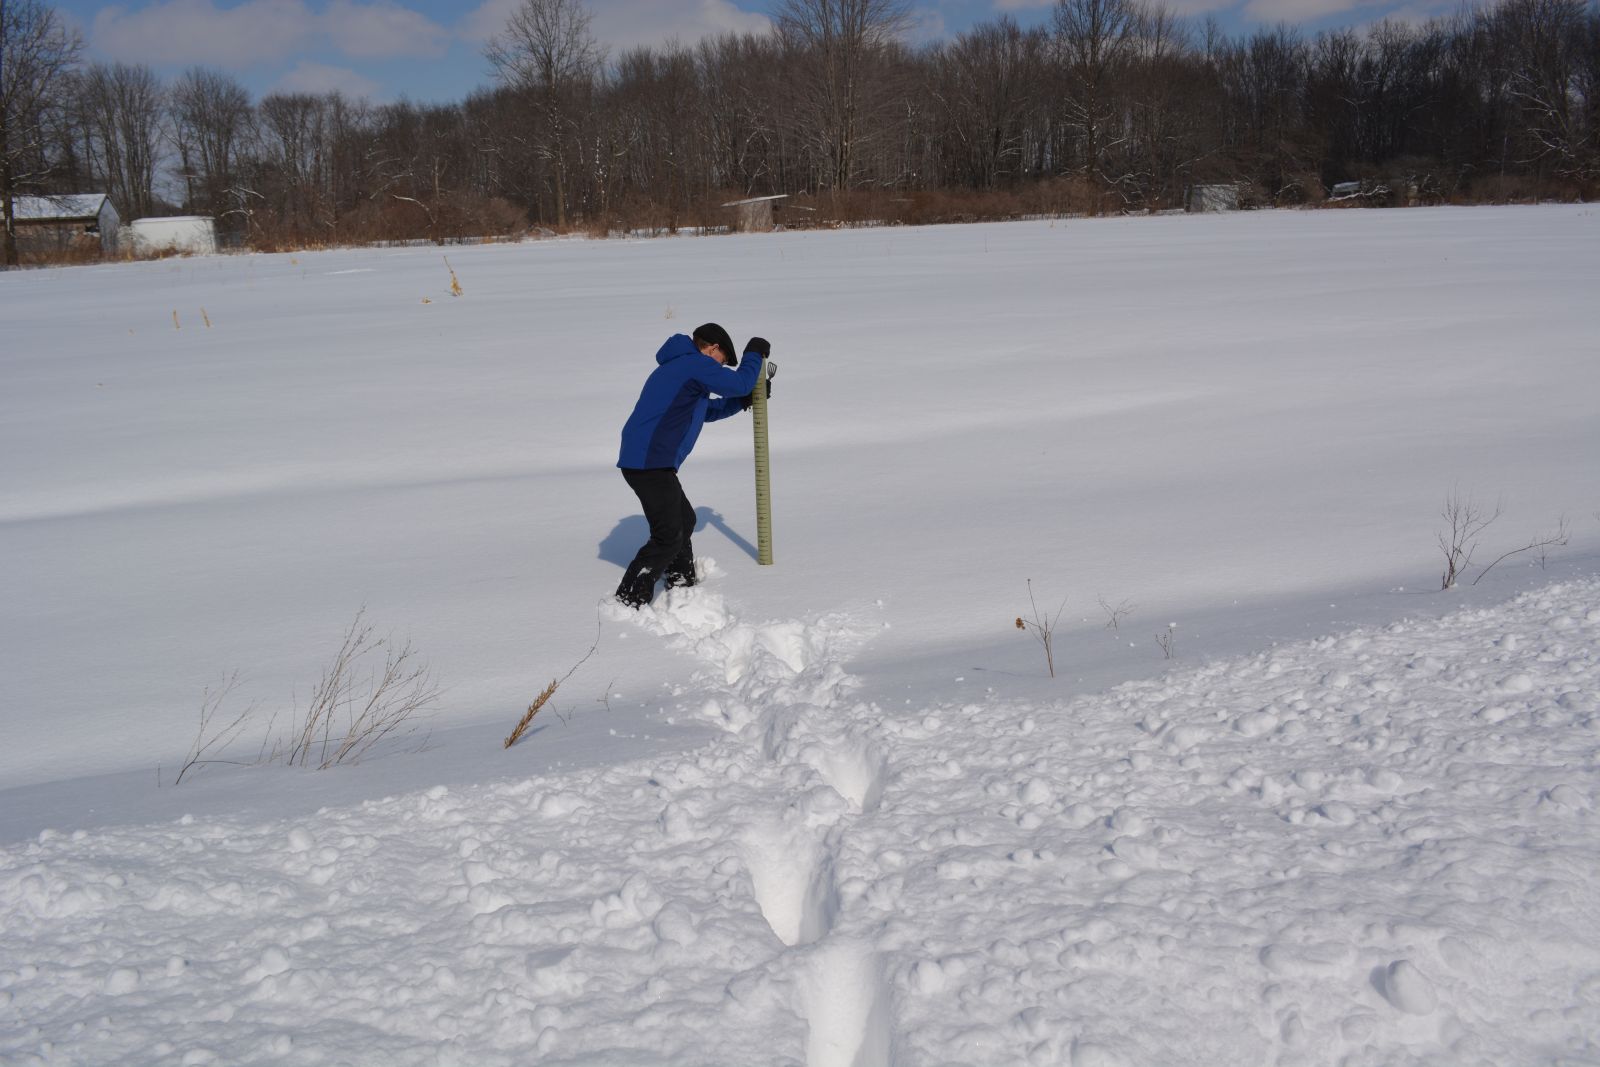
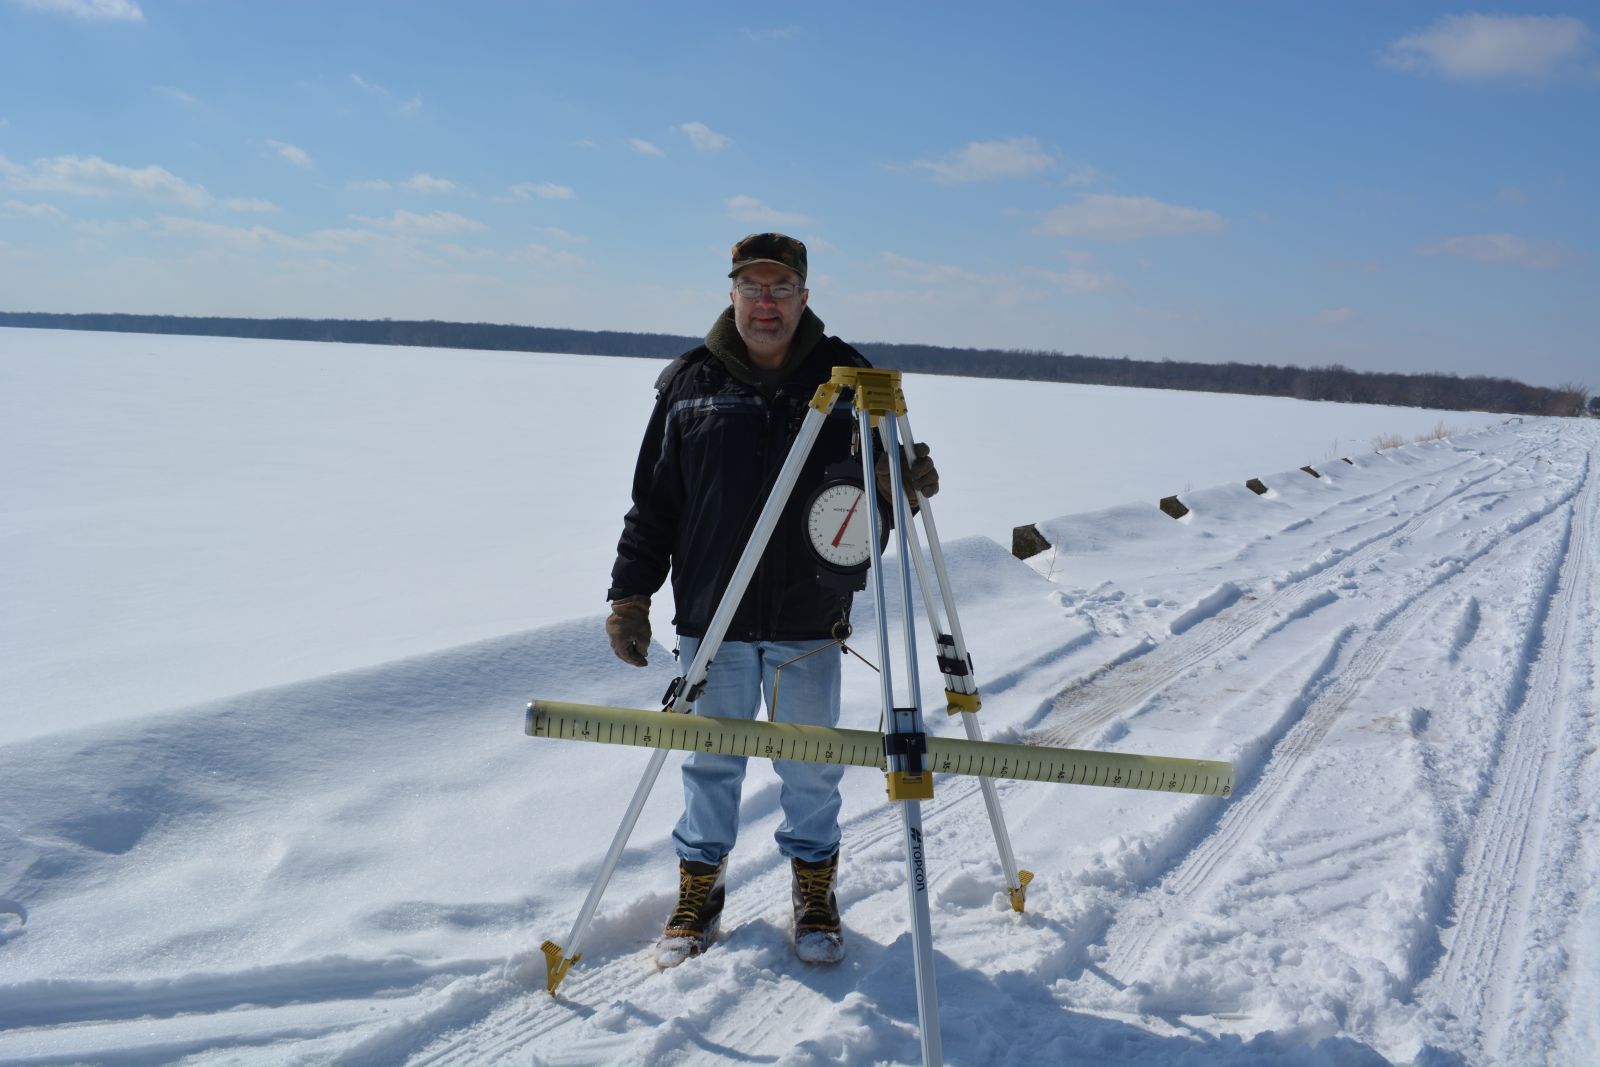
Going into March the area had a widespread and significant snowpack based on regional climatology. The snowpack was heaviest across the snowbelt where the average depth was two to three feet. Elsewhere, the snowpack had compacted to eight inches or less. A survey conducted by NWS Cleveland employees shortly before the thaw revealed the snow water equivalent in the snowpack to be one to two inches west and south of Cleveland, and three to five inches in the snowbelt to the east.

It was a fairly quiet summer for severe weather across northern Ohio and northwestern Pennsylvania. Intermittent rounds of severe weather occurred but there were few significant events. The only tornado of the year occured in Stark County on June 18th. An EF1 tornado touched down near Uniontown then skipped it’s way along a 9 mile path through Lake Township. Some minor damage was reported along the tornado track and fortunately there were no injuries.
On July 14th, heavy rain caused some flash flooding in Bainbridge Township in Geauga County. Water up to four feet deep was reported on some roads and at least three people had to rescued from a business in Novelty. One spotter measured nearly 3 inches of rain in under three hours. Many homes experienced flooding and several roads were washed out.
Waterspouts occurred on three days in August which is somewhat unusual. Waterspouts on the 4th and 11th were associated with thunderstorm while the one on August 25th was caused by cold air over Lake Erie.
June 2015 Precipitation (inches)
|
Monthly Total |
Monthly Departure |
|
|
Cleveland |
8.52 |
+5.09 |
|
Erie |
5.28 |
+1.52 |
|
Mansfield |
7.44 |
+2.69 |
|
Toledo |
7.22 |
+3.65 |
|
Akron |
8.31 |
+4.48 |
|
Youngstown |
9.02 |
+5.14 |
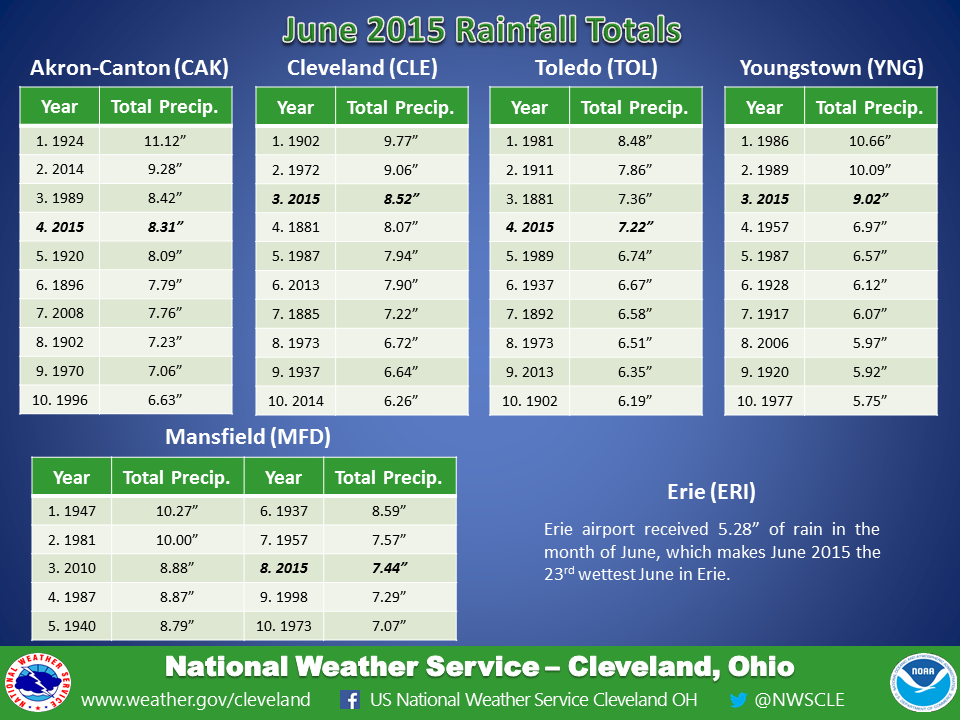
• Akron-Canton Regional Airport (CAK) received a total of 8.31 inches of rain in the month of June. This makes June 2015 the 4th wettest June at CAK. The average June rainfall at CAK is 3.83 inches. Only 6 days did not record at least a trace of precipitation at CAK.
• Cleveland Hopkins International Airport (CLE) received a total of 8.52 inches of rain in the month of June. This makes June 2015 the 3rd wettest June at CLE. The average June rainfall at CLE is 3.43 inches. Only 9 days did not record at least a trace of precipitation at CLE.
• Mansfield Lahm Regional Airport (MFD) received a total of 7.44 inches of rain in the month of June. This makes June 2015 the 8th wettest June at MFD. The average June rainfall at MFD is 4.75 inches. Only 9 days did not record at least a trace of precipitation at MFD.
• Toledo Express Airport (TOL) received a total of 7.22 inches of rain in the month of June. This makes June 2015 the 4th wettest June at TOL. The average June rainfall at TOL is 3.57 inches.
• Youngstown-Warren Regional Airport (YNG) received a total of 9.02 inches of rain in the month of June. This makes June 2015 the 3rd wettest June at YNG. The average June rainfall at YNG is 3.79 inches. Only 6 days did not record at least a trace of precipitation at YNG.
• Erie International Airport (ERI) received a total of 5.28 inches of rain in the month of June. This makes June 2015 the 23rd wettest June at ERI. The average June rainfall at ERI is 3.76 inches.
Additional rainfall totals can be found here.

Left: Rushing water damaged a wall and a garage in Bainbridge Township in Geauga County 7/14/15. Photo Credit is Vivian Feke.
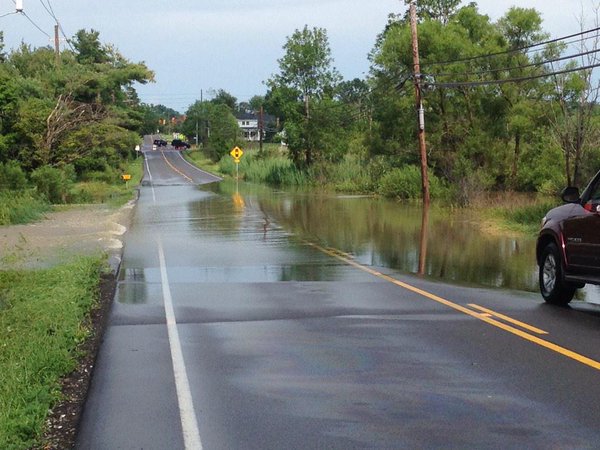
Right: Flood waters moving over Haskins Road in Bainbridge Township in Geauga County 7/14/15. Photo Credit is Jennifer Picciano.
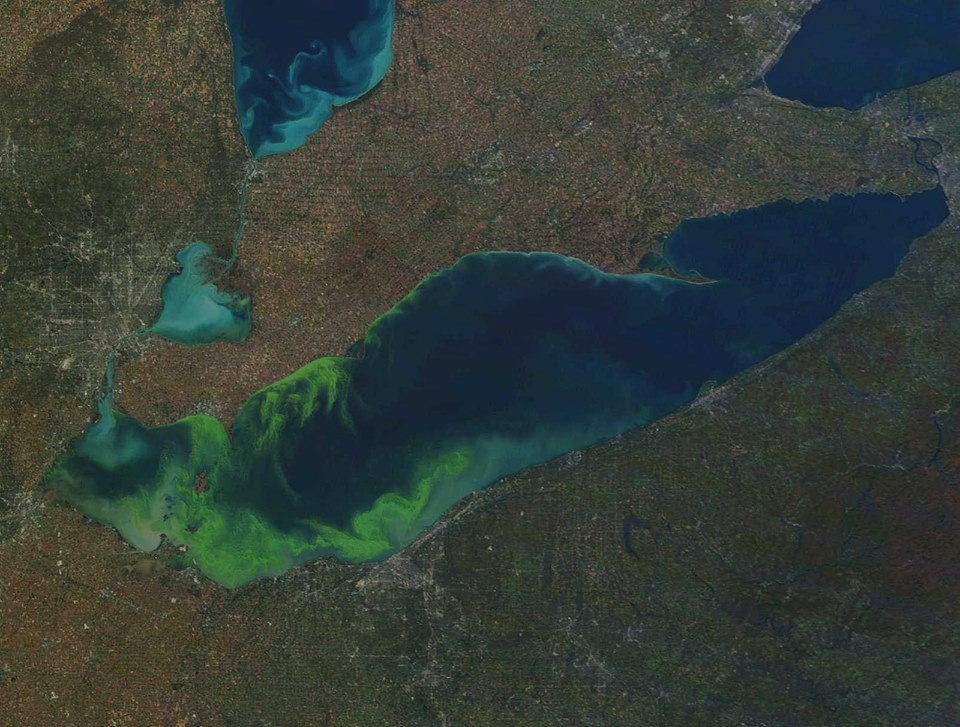
The summer algal bloom on Lake Erie was closely monitored by NOAA's National Centers for Coastal Ocean Science and other NOAA agencies such as the Great Lakes Environmental Research Lab. The National Weather Service's forecast of winds, waves, and temperatures on Lake Erie were taken into account to help predict the severity of the bloom and its location. Heavy June rains caused increased nutrient runoff which stimulated Harmful Algal Bloom growth in the lake basin.
Left Image: MODIS satellite image of Lake Erie on October 9, 2011, showing an algal bloom considered to be among the worst ever observed. Credit: NOAA. CoastWatch.

The NWS Cleveland office supported the efforts of the U.S. Coast Guard in their lightering and recovery operations of potentially hazardous chemicals from the recently discovered sunken Barge Argo with tailored weather forecasts for Lake Erie. The Barge Argo sank during a storm in 1937 and had been resting at the bottom of Lake Erie ever since with crude oil and the chemical benzoyl (also known as benzene) reported on board. NOAA’s Office of Response and Restoration and the U.S. Coast Guard swiftly moved into action in late October after receiving notification of a possible discharge, immediately assessing the wreck and its potential hazards to the environment. The NWS in Cleveland then began aiding this effort by supplying two to three weather briefings a day to support the U.S. Coast Guard with temperatures, wind, wave, and precipitation type forecasts. Climatologically, Lake Erie has the strongest winds and highest waves during the fall months, including October and November. The NWS Cleveland forecasts became increasingly critical as operations focused on the small fair weather windows of opportunity. The last cargo hold was lightered on December 1st, effectively removing all of the remaining chemicals and oil from the barge.
Image Credit: (U.S. Coast Guard) A diver, wearing a positive pressure dive suit, is inspected by his coworkers prior to conducting dive operations for the Argo response in Lake Erie. Divers conducting operations during the Argo response are required to wear specialized dive suits designed for the utmost safety to the diver while ensuring flexibility, ease of decontamination, and chemical resistance.
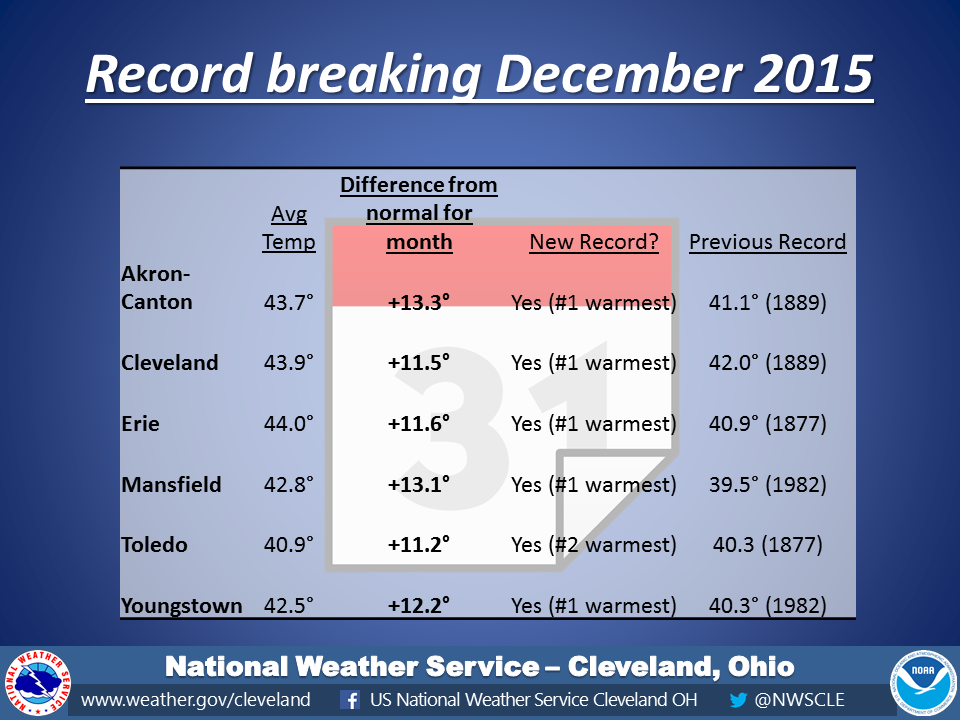
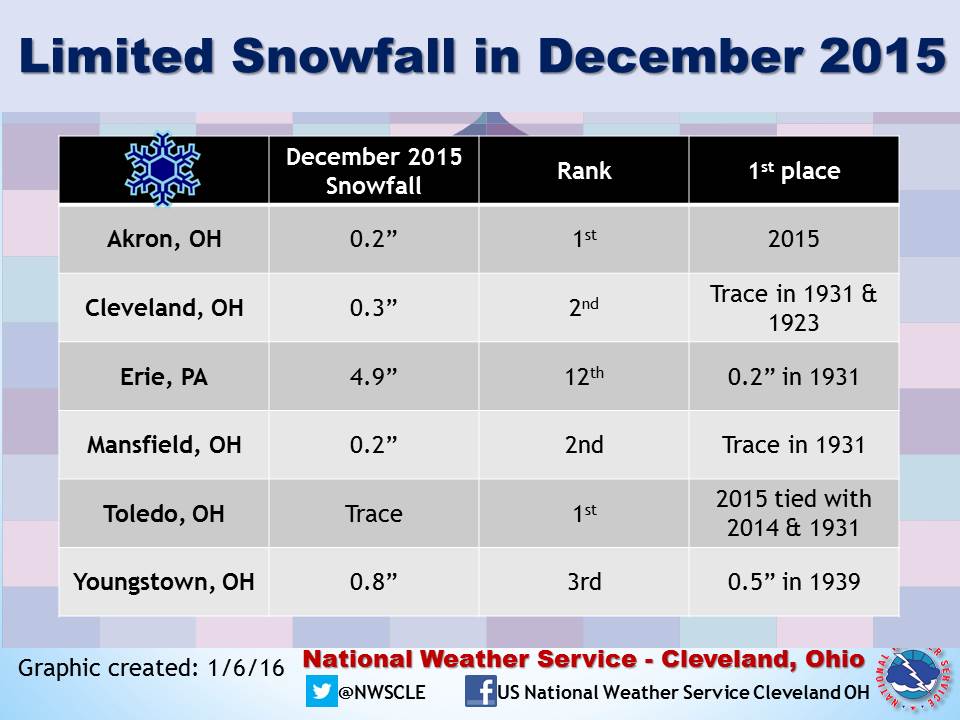
December 2015 was the warmest December on record for 5 out of 6 of our primary climate stations with temperatures running 10 to 15 degrees above normal for the month. Mansfield shattered its previous December record by 3.3F! Not only did December's warmth make it into the record books, but so did the lack of snowfall. December 2015 was Akron and Toledo's least snowiest December on record and Cleveland had it's 2nd least snowy December.
The information in this document is preliminary and unofficial. Official climate request can be made through the National Center for Environmental Information or the Midwestern Regional Climate Center.
Click on each tab to see climate information from the different locations.
|
Highs |
Lows |
|||
|
5/8 |
89 |
2/15 |
-5 |
|
|
5/9 |
88 |
2/16 |
-12 |
|
|
5/11 |
88 |
2/17 |
-8 |
|
|
11/5 |
76 |
2/19 |
-4 |
|
|
11/18 |
71 |
2/20 |
-17 |
|
|
12/14 |
65 |
2/23 |
-5 |
|
|
12/23 |
65 |
2/28 |
-9 |
|
|
4/24 |
27 |
|||
February was the coldest on record. The average temperature was 14.3 deg.
September was the sixth warmest on record. The average temperature was 68.8 deg.
November was the fourth warmest on record. The average temperature was 48.2 deg.
December was the warmest on record. The average temperature was 43.9 deg.
June was the third wettest on record. 8.52 in. of rain fell.
February was the seventh snowiest on record. 24.9 in. of snow fell.
December was the third least snowiest on record. Only 0.3 in. of snow fell.
None
The yearly average temperature was 50.9 deg. The normal average yearly temperature is 51.4 deg.
The yearly total precipitation was 40.07 in. The normal yearly precipitation is 39.14.
The yearly total snowfall was 46.8 in.
The warmest temperature for the year was 93 on 7/29.
The coldest temperature for the year was -17 on 2/20.
The greatest daily snowfall was on 2/1. 7.2 in. of snow fell.
The wettest day was 6/27. 2.76 in. of rain fell.
|
Highs |
Lows |
|||
|
5/7 |
87 |
2/20 |
-10 |
|
|
5/8 |
88 |
2/23 |
-5 |
|
|
5/9 |
88 |
2/24 |
-10 |
|
|
11/4 |
76 |
3/5 |
4 |
|
|
11/5 |
77 |
3/28 |
12 |
|
|
11/18 |
70 |
4/24 |
27 |
|
|
12/12 |
68 |
|||
|
12/23 |
64 |
|||
February was the second coldest on record. The average temperature was 15.8 deg.
September was the third warmest on record. The average temperature was 69.3 deg.
November was the third warmest on record. The average temperature was 48.2 deg.
June was the fourth wettest on record. 8.31 in. of rain fell.
August was the second driest on record. Only 0.76 in. of rain fell.
January was the seventh snowiest on record. 21.3 in. of snow fell.
February was the third snowiest on record. 23.1 in. of snow fell.
April only had a trace of snow, which is tied with 10 other years for the least amount of snow for the month.
November only had a trace of snow, which is tied with 5 other years for the least amount of snow for the month.
December was the least snowiest on record. Only 0.2 in. of snow fell.
It was the eighth warmest year on record. The average temperature was 51.8 deg.
The yearly average temperature was 51.8 deg. The normal yearly temperature is 49.8 deg.
The yearly total precipitation was 41.58 in. The normal yearly precipitation is 39.62 in.
The yearly total snowfall was 51.5 in.
The warmest temperature for the year was 91 deg. on 6/11, 7/18, 7/29, 8/19, 9/7, and 9/8.
The coldest temperature for the year was -10 deg. on 2/20 and 2/24.
The greatest daily snowfall was on 2/21. 6.2 in. of snow fell.
The wettest day was 5/27. 1.78 in. of rain fell.
|
Highs |
Lows |
|||
|
4/13 |
81 |
2/15 |
-9 |
|
|
5/9 |
87 |
2/16 |
-18 |
|
|
5/10 |
85 |
2/19 |
-10 |
|
|
6/12 |
90 |
2/20 |
-17 |
|
|
11/4 |
78 |
2/23 |
-8 |
|
|
12/11 |
61 |
2/27 |
-9 |
|
|
12/12 |
66 |
3/5 |
1 |
|
|
12/13 |
66 |
|||
|
12/14 |
69 |
|||
|
12/23 |
65 |
|||
February was the coldest on record. The average temperature was 13.1 deg.
May was the eight warmest on record. The average temperature was 63.1 deg.
September was the third warmest on record. The average temperature was 69.1 deg.
November was the fifth warmest on record. The average temperature was 48.1 deg.
December was the warmest on record. The average temperature was 44.0 deg.
February was the sixth snowiest on record. 31.7 in. of snow fell.
None.
The yearly average temperature was 50.0 deg. The normal yearly temperature is 49.8 deg.
The yearly total precipitation was 37.37 in. The normal yearly precipitation is 42.16 in.
The yearly total snowfall was 85.4 in.
The warmest temperature for the year was 92 deg. on 8/19.
The coldest temperature for the year was -18 deg. on 2/16. This ties the coldest temperature on record at Erie.
The greatest daily snowfall was on 2/1. 9 in. of snow fell.
The wettest day was on 9/12. 2.54 in. of rain fell.
|
Highs |
Lows |
|||
|
5/7 |
86 |
2/15 |
-11 |
|
|
5/8 |
87 |
2/16 |
-9 |
|
|
11/3 |
76 |
2/23 |
-9 |
|
|
11/4 |
77 |
2/24 |
-8 |
|
|
11/5 |
76 |
2/28 |
-5 |
|
|
12/12 |
67 |
3/6 |
0 |
|
|
12/13 |
62 |
|||
|
12/23 |
63 |
|||
|
12/26 |
57 |
|||
|
12/27 |
64 |
|||
February was the coldest on record. The average temperature was 14.7 deg.
May was the fifth warmest on record. The average temperature was 64.7 deg.
September was the fourth warmest on record. The average temperature was 68.1 deg.
November was the third warmest on record. The average temperature was 47.1 deg.
December was the warmest on record. The average temperature was 42.8 deg.
June was the eight wettest on record. 7.57 in. of rain fell.
July was the seventh driest on record. Only 1.49 in. of rain fell.
August was the tenth driest on record. Only 1.27 in. of rain fell.
January was the fourth snowiest on record. 25.0 in. of snow fell.
February was the fifth snowiest on record. 21.4 in. of snow fell.
November tied four other years for the least snowiest on record. No snow fell.
December was tied with two other years for the second least snowiest on record. Only 0.2 in. fell.
None.
The yearly average temperature was 50.6 deg. The normal yearly temperature is 49.5 deg.
The yearly total precipitation was 39.51 in. The normal yearly precipitation is 44.19 in.
The yearly total snowfall was 57.3 in.
The warmest temperature for the year was 91 deg. on 9/17.
The coldest temperature for the year was -11 deg. on 2/15.
The greatest daily snowfall was on 3/1. 5.5 in. of snow fell.
The wettest day was on 6/14. 1.49 in. of rain fell.
|
Highs |
Lows |
|||||
|
88 |
2/15 |
-8 |
|
|||
|
66 |
2/16 |
-9 |
|
|||
|
63 |
2/20 |
-19 |
|
|||
|
63 |
2/28 |
-9 |
|
|||
|
3/6 |
-5 |
|
||||
|
4/24 |
23 |
|
||||
February was the second coldest on record. The average temperature was 12.4 deg.
December was the second warmest on record. The average temperature was 40.9 deg.
June was the fourth wettest on record. 7.22 in. of rain fell.
July was the eighth wettest on record. 6.16 in. of rain fell.
February was the second snowiest on record. 25.3 in. of snow fell.
April was tied with eight other years for the least snowiest on record. No snow fell.
December was tied with two other years for the second least snowiest on record. Only a trace of snow fell.
None.
The yearly average temperature was 49.5 deg. The normal yearly temperature is 50.2 deg.
The yearly total precipitation was 36.51 in. The normal yearly precipitation is 34.24 in.
The yearly total snowfall was 46.4 in.
The warmest temperature for the year was 91 deg. on 7/29 and 9/7.
The coldest temperature for the year was -19 deg. on 2/20. This is the second coldest low temperature on record at Toledo. The coldest was -20.
The greatest daily snowfall was on 2/1. 10.0 in. of snow fell.
The wettest day was on 6/27. 3.33 in. of rain fell.
|
Highs |
Lows |
|||
|
5/7 |
85 |
2/13 |
-4 |
|
|
5/8 |
89 |
2/15 |
-8 |
|
|
12/12 |
67 |
2/16 |
-13 |
|
|
12/13 |
63 |
2/19 |
-8 |
|
|
12/14 |
62 |
2/20 |
-16 |
|
|
12/23 |
63 |
2/23 |
-11 |
|
|
2/24 |
-10 |
|||
|
2/28 |
-9 |
|||
|
3/5 |
-1 |
|||
|
3/6 |
-4 |
|||
|
3/29 |
15 |
|||
|
7/16 |
46 |
|||
February was the coldest on record. The average temperature was 13.7 deg.
May was the sixth warmest on record. The average temperature was 64.0 deg.
September was the tenth warmest on record. The average temperature was 67.1 deg.
November was the third warmest on record. The average temperature was 47.2 deg.
December was the warmest on record. The average temperature was 42.5 deg.
June was the third wettest on record. 9.02 in. of rain fell.
January was the eighth snowiest on record. 29.3 in. of snow fell.
February was the third snowiest on record. 27.9 in. of snow fell.
November was tied with 4 other years for the second least snowiest on record. Only a trace of snow fell.
December was the third least snowiest on record. Only 0.8 in. of snow fell.
None.
The yearly average temperature was 49.8 deg. The normal yearly temperature is 50.0 deg.
The yearly total precipitation was 44.38 in. The normal yearly precipitation is 38.91 in.
The yearly total snowfall was 67.9 in.
The warmest temperature for the year was 91 deg. on 7/29.
The coldest temperature for the year was -16 deg. on 2/20.
The greatest daily snowfall was on 2/1. 7.2 in. of snow fell.
The wettest day was on 6/27. 1.97 in. of rain fell.
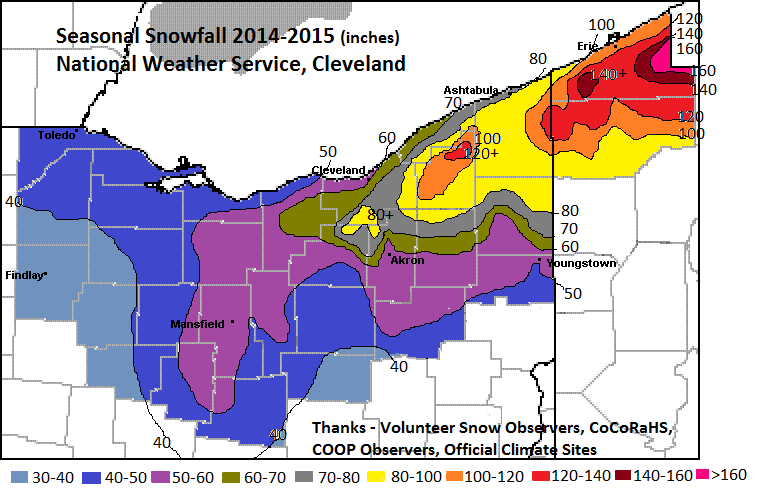
Click on the image for a link to the tally of seasonal snowfall for various locations across the area.
A number of monthly temperature and precipitation records occurred across our climate sites this year.
All of these monthly statistics for our climate stations can be found year round by going to the following link and selecting your station. Data each month are updated within a week if data for the previous month made the "top ten."
NWS Cleveland Local Climate Information
Records that encompass yearly totals such as the wettest/driest/snowiest years on record are again located on our Local Climate Information page.
View our growing local weather events page highlighted below.
Local Weather Events & Local Interest Features Page
The publication, StormData, can be found with the National Centers for Environmental Information.
Significant Global Climate Extremes and Anomalies 2015
NCDC 2015 Preliminary Annual Global Climate Report
NCDC 2015 Preliminary United States Significant Weather and Climate Events
NCDC 2015 Preliminary State of the Climate - U.S. Summary
Preliminary data is updated in mid-January to reflect end of the year weather. The full analysis will be out in spring.
All data are considered preliminary. The National Centers for Environmental Information (formerly the National Climate Data Center) finalizes and stores the official record of all of our weather data.
Period of record are as follows:
Records data back to 1873 for Erie
1897 for Youngstown
1887 for Canton-Akron
1871 for Cleveland
1873 for Toledo
1916 for Mansfield

