Watches |
 Mesoscale Discussions |
 Day 1 |
 Day 2 |
 Day 3 |
 Day 4 |
 Day 5 |
 Day 6 |
 Day 7 |
 Day 8 |
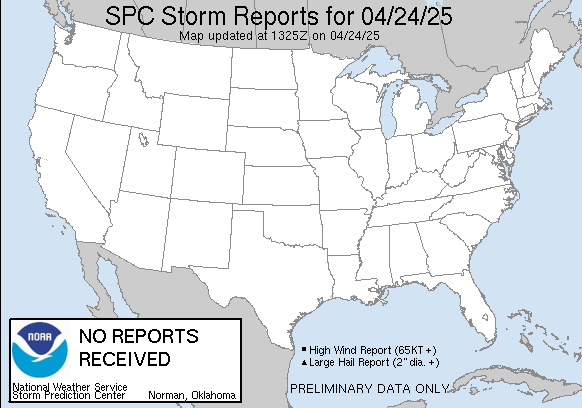 Today's Reports |
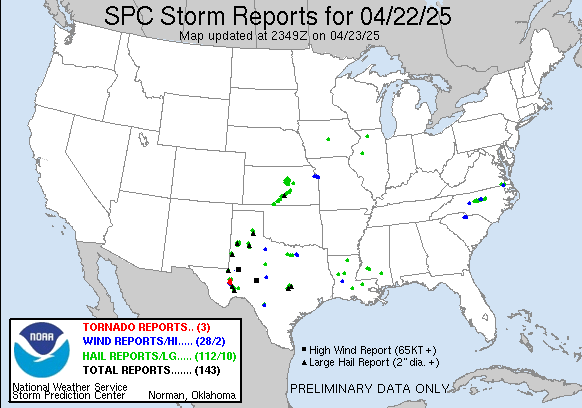 Yesterday's Reports |
 FEMA Region 7 - Day 1 |
 FEMA Region 7 - Day 2 |
 FEMA Region 7 - Day 3 |
 Kansas - Day 1 |
 Kansas - Day 2 |
 Kansas - Day 3 |
 DDC - Day 1 |
 DDC - Day 2 |
 DDC - Day 3 |
Resources:
Upper Air Maps 6 Hr Fcst |
 12 Hr Fcst |
 18 Hr Fcst |
 24 Hr Fcst |
 36 Hr Fcst |
 48 Hr Fcst |
 Day 3 (B&W) |
 Day 4 (B&W) |
 Day 5 (B&W) |
 Day 6 (B&W) |
 Day 7 (B&W) |
 Day 3 (color) |
 Day 4 (color) |
 Day 5 (color) |
 Day 6 (color) |
 Day 7 (color) |
 Day 3 |
 Day 4 |
 Day 5 |
 Day 6 |
 Day 7 |
 Day 3 (NA) |
 Day 5 (NA) |
 Day 8 (NA) |
 Day 11 (NA) |
 Day 3 (NH) |
 Day 5 (NH) |
 Day 8 (NH) |
 Day 11 (NH) |
 Low Tracks |
 Low Track Probs |
 Day 3 |
 Day 4 |
 Day 5 |
 Day 6 |
 Day 7 |
 Day 3 |
 Day 4 |
 Day 5 |
 Day 6 |
 Day 7 |
 Day 3 0z-12z |
 Day 3 12z-0z |
 Day 4 0z-12z |
 Day 4 12z-0z |
 Day 5 0z-12z |
 Day 5 12z-0z |
 Day 6 0z-12z |
 Day 6 12z-0z |
 Day 7 0z-12z |
 Day 7 12z-0z |
||
 Day 3 |
 Day 4 |
 Day 5 |
 Day 6 |
 Day 7 |
 Day 1 |
 Day 2 |
 Day 3 |
|
 Day 1-2 |
 Day 1-3 |
 Day 4-5 |
 Day 6-7 |
 Day 1-5 |
 Day 1-7 |
 Day 1 FFG |
 Day 2 FFG |
 Day 3 FFG |
 Day 1 (Snow > 4) |
 Day 2 (Snow > 4) |
 Day 3 (Snow > 4) |
 Day 1 (Snow > 8) |
 Day 2 (Snow > 8) |
 Day 3 (Snow > 8) |
 Day 1 (Snow > 12) |
 Day 2 (Snow > 12) |
 Day 3 (Snow > 12) |
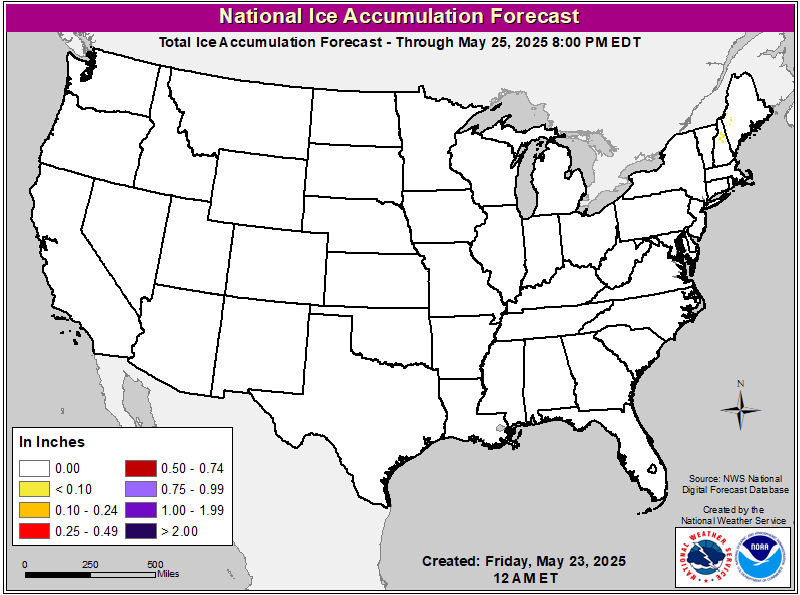
 Day 1 (Ice > .25) |
 Day 2 (Ice > .25) |
 Day 3 (Ice > .25) |
Resources:
WPC 6-Hour Probabilistic Precipitation Guidance Days 1-3 6-10 Day Temp |
 6-10 Day Precip |
 8-14 Day Temp |
 8-14 Day Precip |
 6-10 Day Temp |
 6-10 Day Precip |
 8-14 Day Temp |
 8-14 Day Precip |
 One Month Temp |
 One Month Precip |
 Three Month Temp |
 Three Month Precip |
 |
 |
 |
 |
 |
 |
 |
 |
 |
 |
 |
 |
 |
 |
 |
 |
 |
 |
 |
 |
 |
 |
 |
 |
 |
 |
 |
 |
 U.S. Drought Monitor |
 High Plains |
 Seasonal Drought Assessment |
 NAO |
 AO |
 PNA |
Resources:
CPC Seasonal Outlooks GOES East Visible |
 GOES East IR |
 GOES East WV |
 GOES East AVN |
 GOES East JSL |
 GOES East RGB |
 GOES East Funktop |
 GOES East Rainbow |
 GOES NE CONUS Visible |
 GOES NE CONUS IR |
 GOES NE CONUS WV |
 GOES NE CONUS AVN |
 GOES NE CONUS JSL |
 GOES NE CONUS RGB |
 GOES NE CONUS Funktop |
 GOES NE CONUS Rainbow |
 GOES CENTRAL PLAINS Visible |
 GOES CENTRAL PLAINS IR |
 GOES CENTRAL PLAINS RGB |
 GOES WFO BOX IR2 |
 GOES CENTRAL PLAINS AVN |
 GOES CENTRAL PLAINS JSL |
 GOES CENTRAL PLAINS Funktop |
 GOES CENTRAL PLAINS Rainbow |
 GOES WFO DDC Visible |
 GOES WFO DDC IR |
 GOES WFO DDC RGB |
 GOES WFO DDC IR2 |
 GOES WFO DDC AVN |
 GOES WFO DDC JSL |
 GOES WFO DDC Funktop |
 GOES WFO DDC Rainbow |
 Visible |
 Infrared 1 |
 Infrared 2 |
 Water Vapor |
 AVN |
 Dvorak |
 JSL |
 RGB |
 Funktop |
 Rainbow |
 Visible |
 Infrared 1 |
 Infrared 2 |
 Water Vapor |
 AVN |
 Dvorak |
 JSL |
 RGB |
 Funktop |
 Rainbow |
 Visible |
 Infrared 1 |
 Infrared 2 |
 Water Vapor |
 AVN |
 Dvorak |
 JSL |
 RGB |
 Funktop |
 Rainbow |
Resources:
GOES Hemispheric Dodge City |
 Amarillo |
 Pueblo |
 Goodland |
 Hastings |
 Wichita |
 Vance |
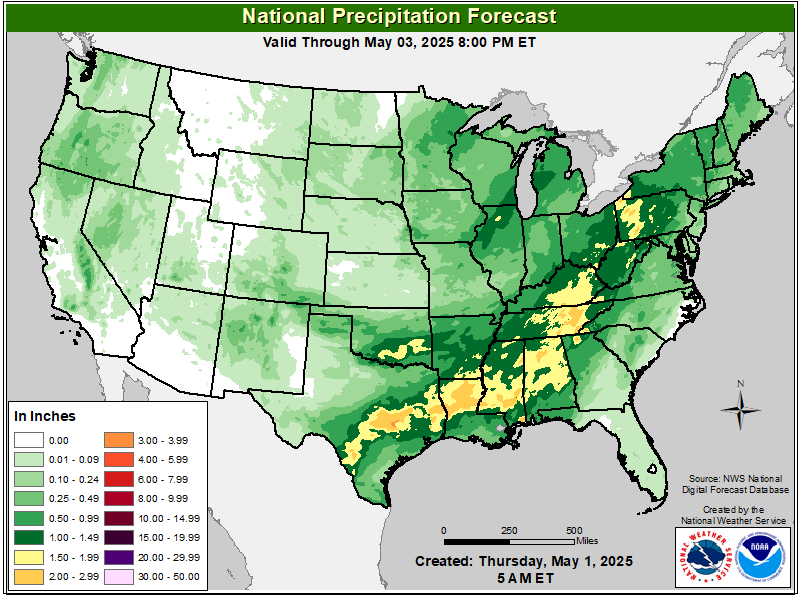
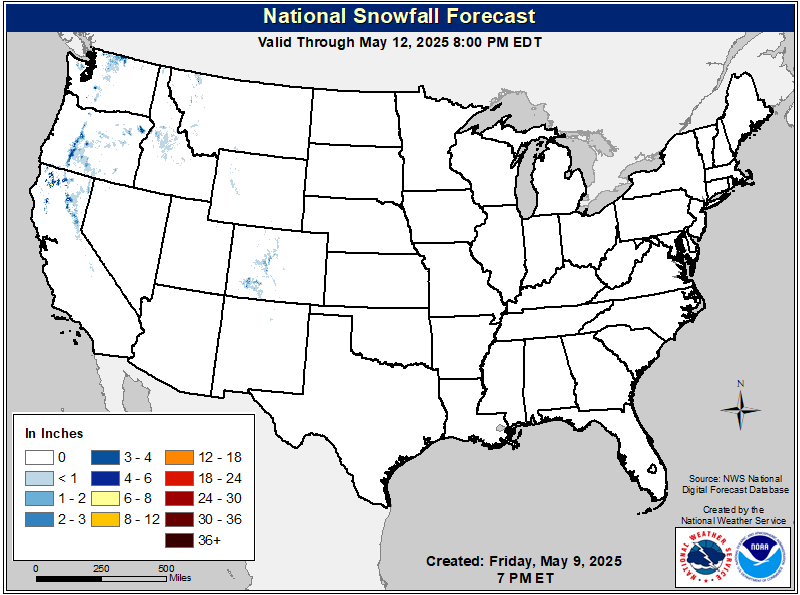
 National |
||||
 Northwest |
 Northern Moutains |
 Northern Plains |
 Great Lakes |
 Northeast |
 Southwest |
 Southern Moutains |
 Southern Plains |
 Gulf Region |
 Southeast |
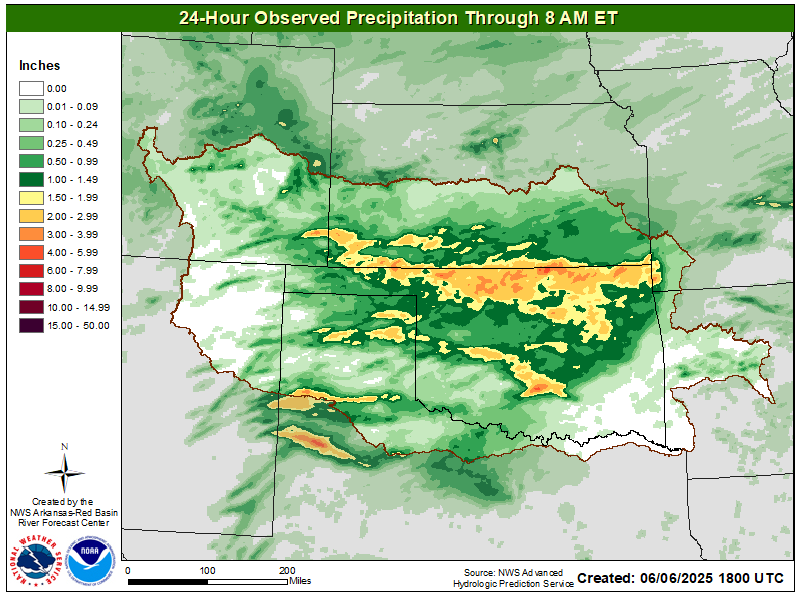
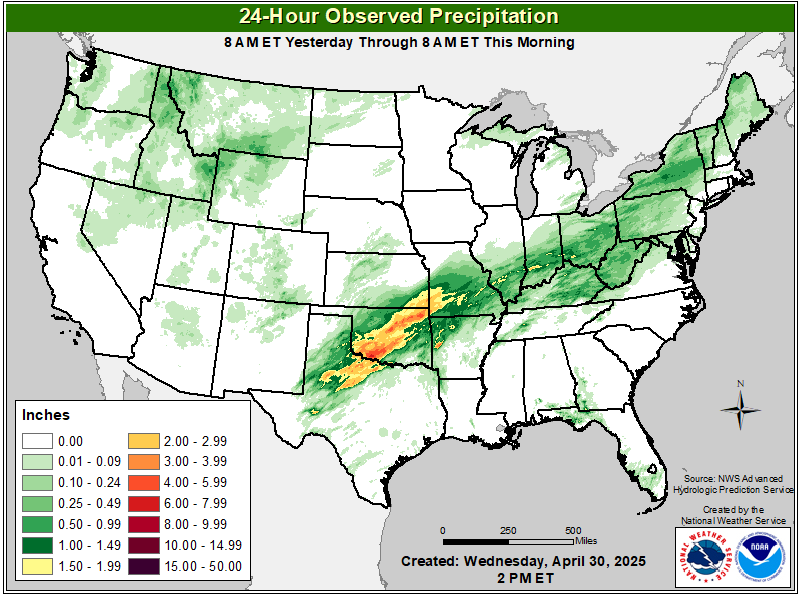
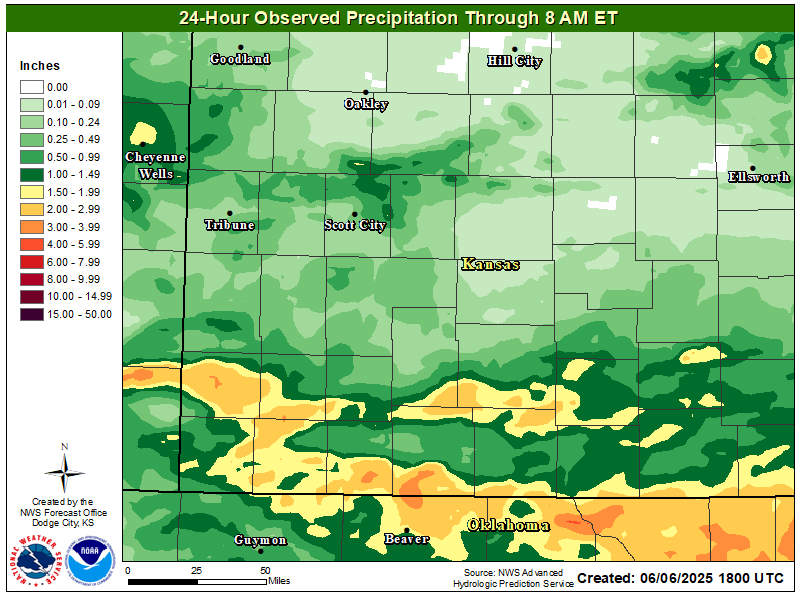 24-Hr Observed Precip |
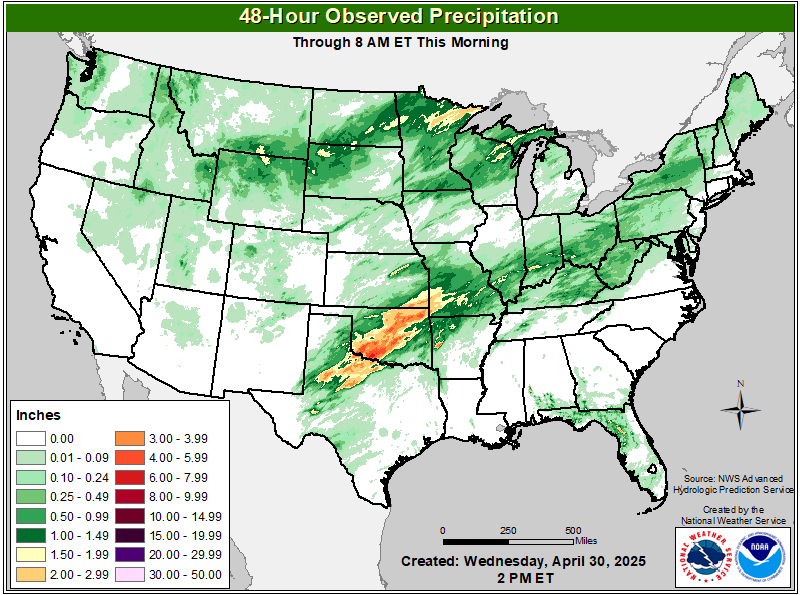
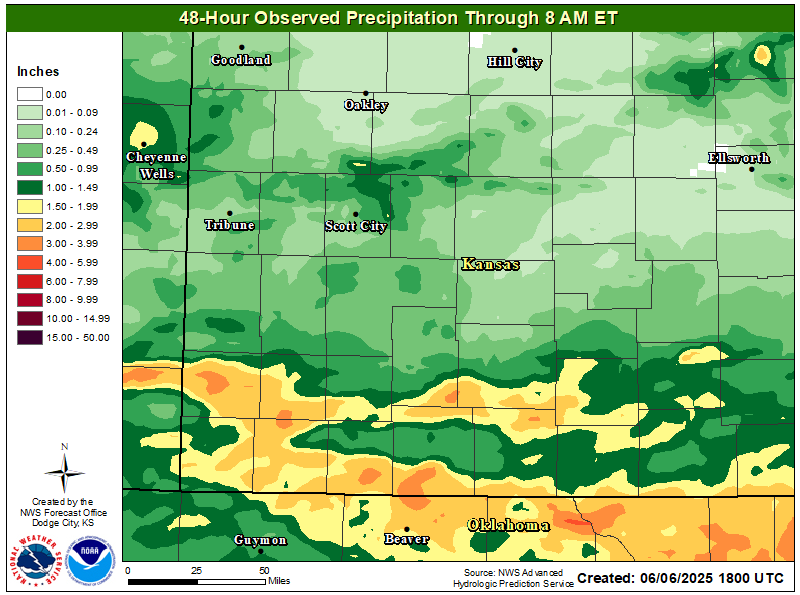 48-Hr Observed Precip |
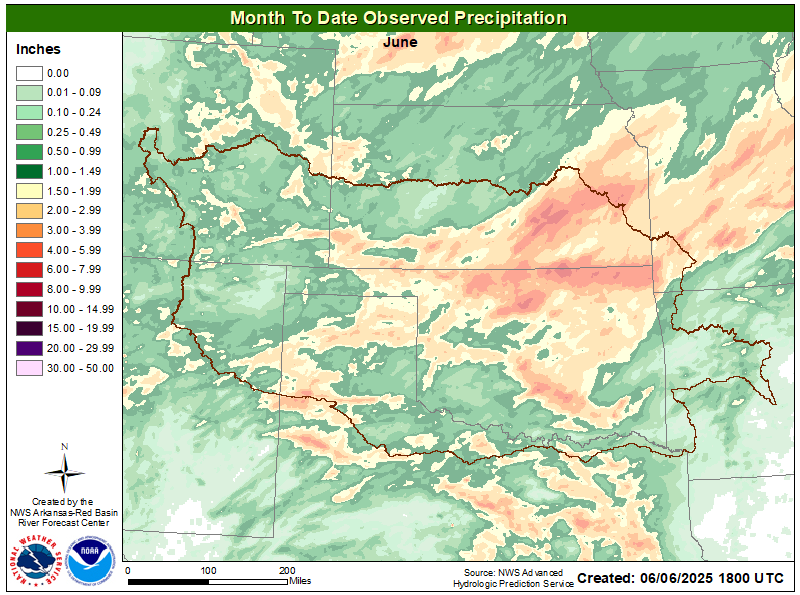
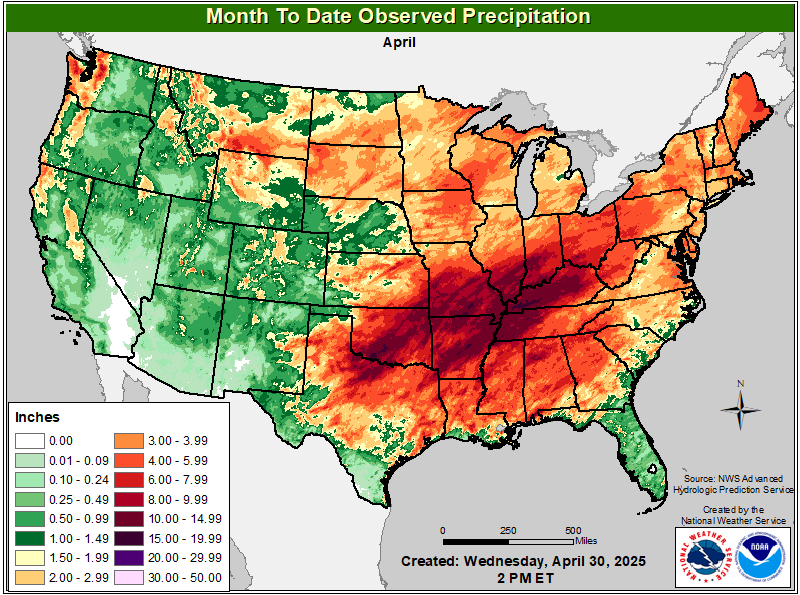
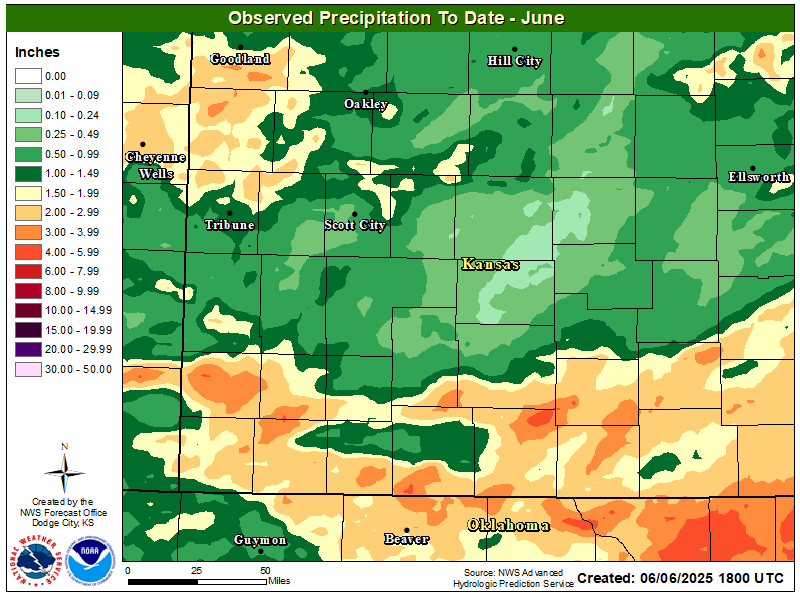 Month to Date Precip |
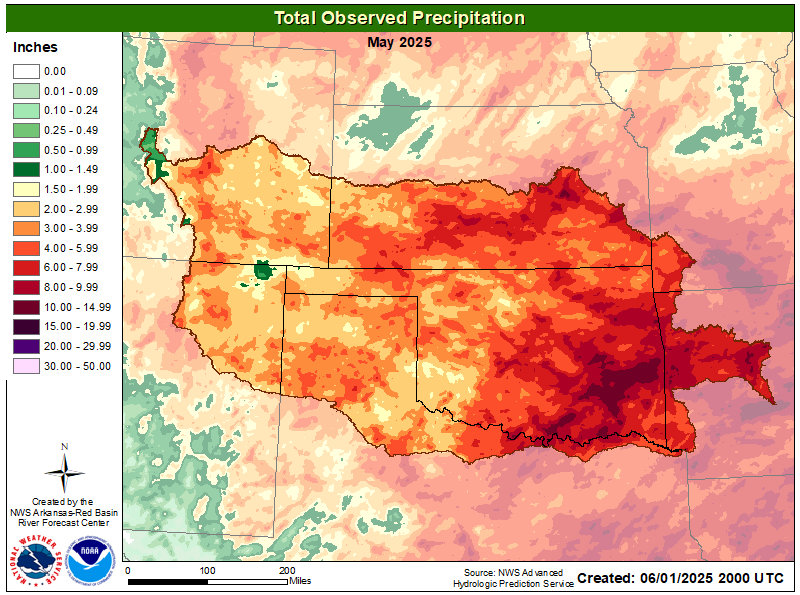
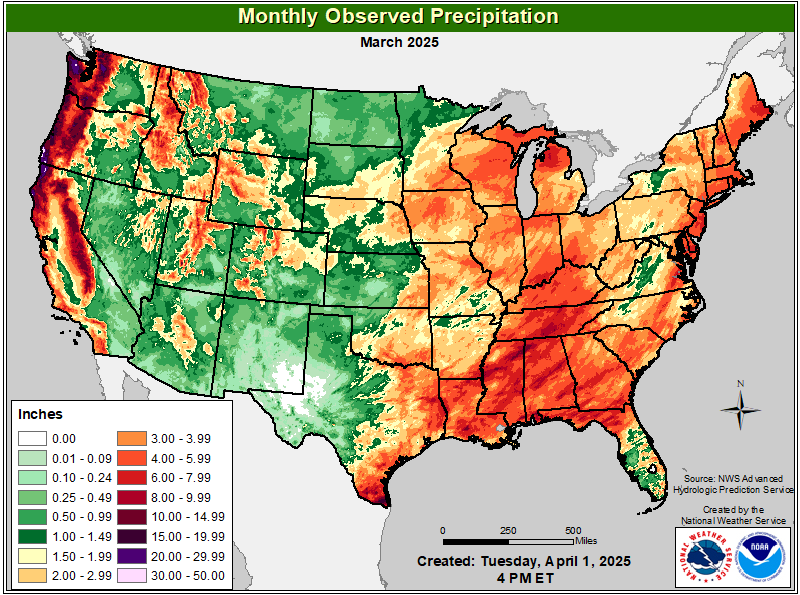
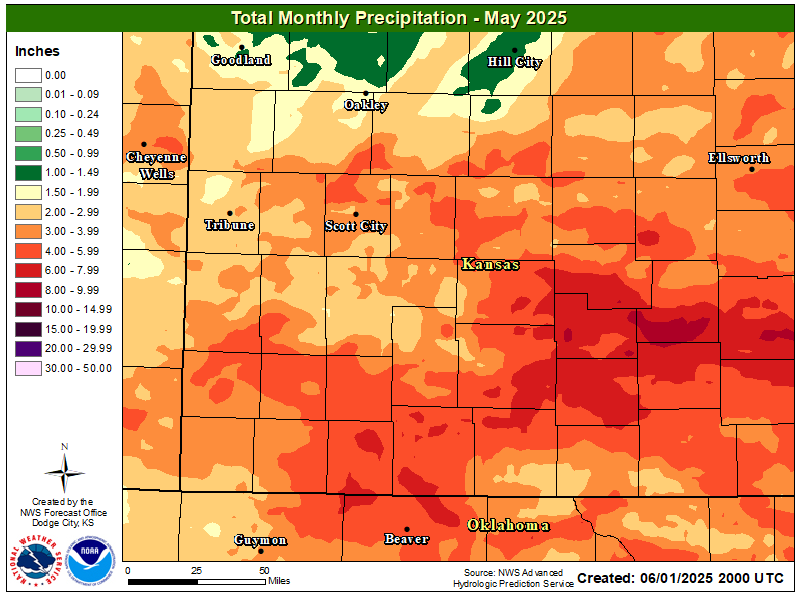 Total Mo. Obs. Precip |
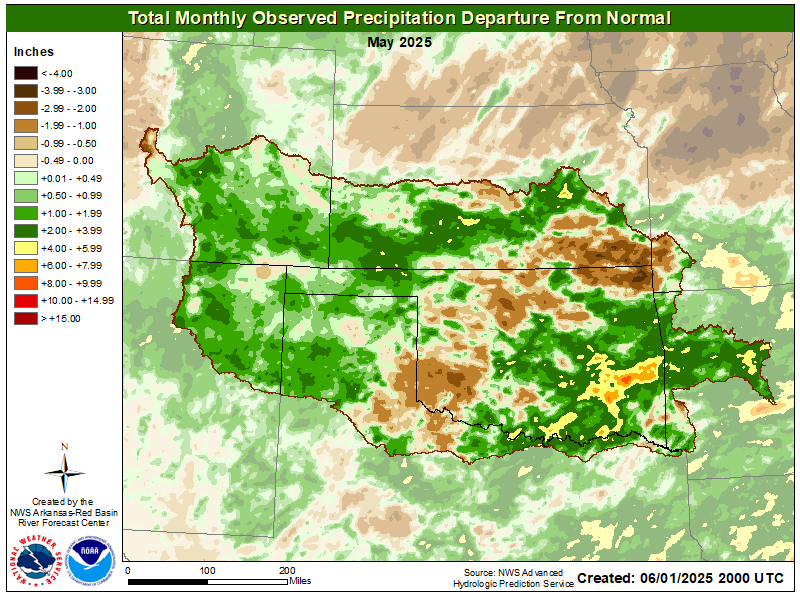
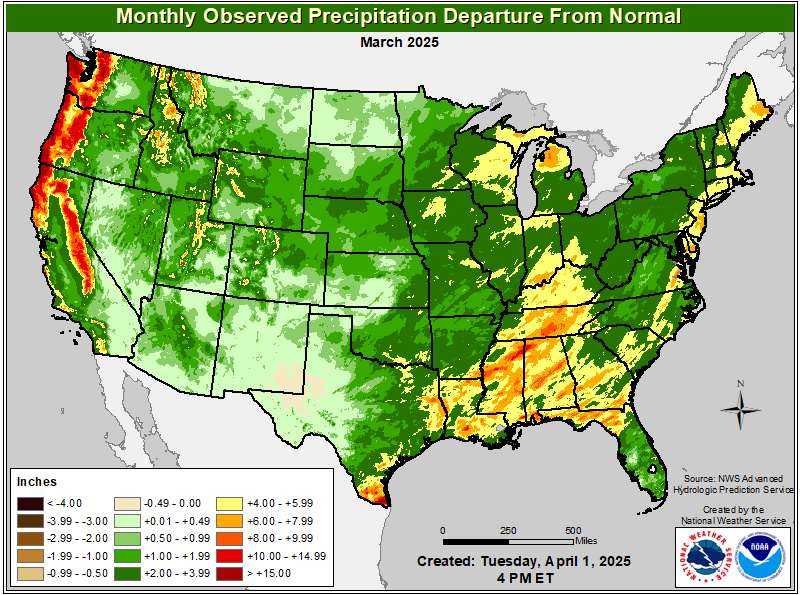
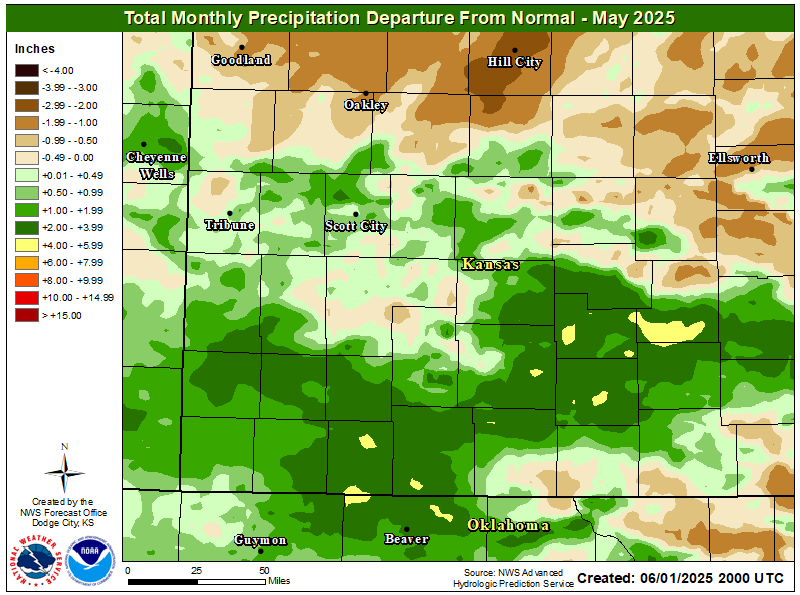 Total Mo. Obs. Precip Depart |
 24-Hr Observed Precip |
 48-Hr Observed Precip |
 Month to Date Precip |
 Total Mo. Obs. Precip |
 Total Mo. Obs. Precip Depart |
 24-Hr Observed Precip |
 48-Hr Observed Precip |
 Month to Date Precip |
 Total Mo. Obs. Precip |
 Total Mo. Obs. Precip Depart |
 7-Day Avg Temp |
 14-Day Avg Temp |
 30-Day Avg Temp |
 Month-to-Date Avg Temp |
 Year-to-Date Avg Temp |
 Water-Year Avg Temp |
 Last Month Avg Temp |
 Last 3-Months Avg Temp |
 Last 12-Months Avg Temp |
 7-Day Avg Temp Dept |
 14-Day Avg Temp Dept |
 30-Day Avg Temp Dept |
 Month-to-Date Avg Temp Dept |
 Year-to-Date Avg Temp Dept |
 Water-Year Avg Temp Dept |
 Last Month Avg Temp Dept |
 Last 3-Months Avg Temp Dept |
 Last 12-Months Avg Temp Dept |
 7-Day Precip |
 14-Day Precip |
 30-Day Precip |
|
 60-Day Precip |
 90-Day Precip |
 Since April 1 Precip |
 Since July 1 Precip |
 6-Month Precip |
 12-Month Precip |
 24-Month Precip |
 36-Month Precip |
 Month-to-Date Precip |
 Year-to-Date Precip |
 Water-Year Precip |
 7-Day Precip Dept |
 14-Day Precip Dept |
 30-Day Precip Dept |
|
 60-Day Precip Dept |
 90-Day Precip Dept |
 Since April 1 Precip Dept |
 Since July 1 Precip Dept |
 6-Month Precip Dept |
 12-Month Precip Dept |
 24-Month Precip Dept |
 36-Month Precip Dept |
 Month-to-Date Precip Dept |
 Year-to-Date Precip Dept |
 Water-Year Precip Dept |
 7-Day Precip % Norm |
 14-Day Precip % Norm |
 30-Day Precip % Norm |
|
 60-Day Precip % Norm |
 90-Day Precip % Norm |
 Since April 1 Precip % Norm |
 Since July 1 Precip % Norm |
 6-Month Precip % Norm |
 12-Month Precip % Norm |
 24-Month Precip % Norm |
 36-Month Precip % Norm |
 Month-to-Date Precip % Norm |
 Year-to-Date Precip % Norm |
 Water-Year Precip % Norm |
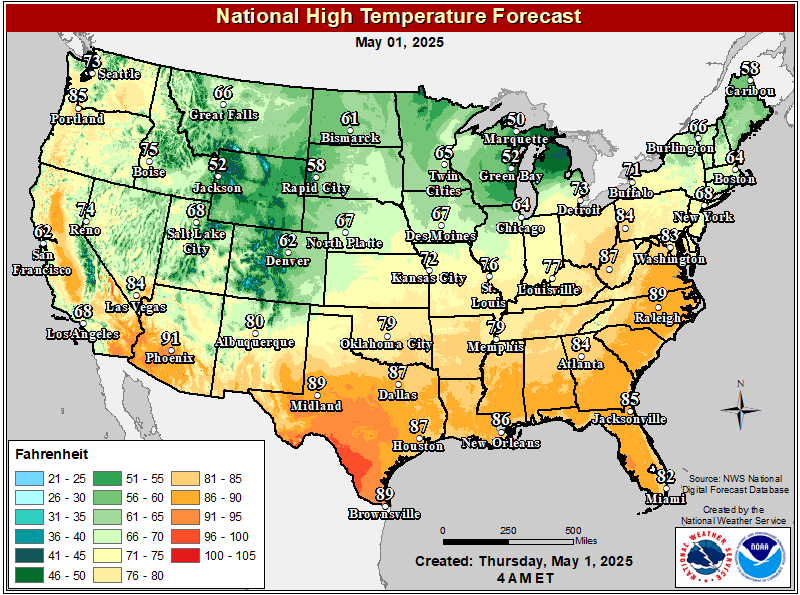
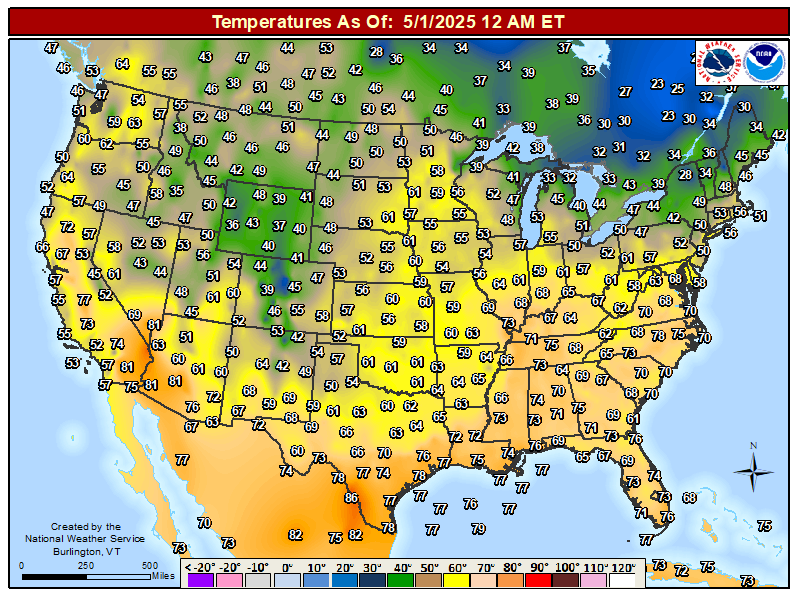 CONUS Temps |
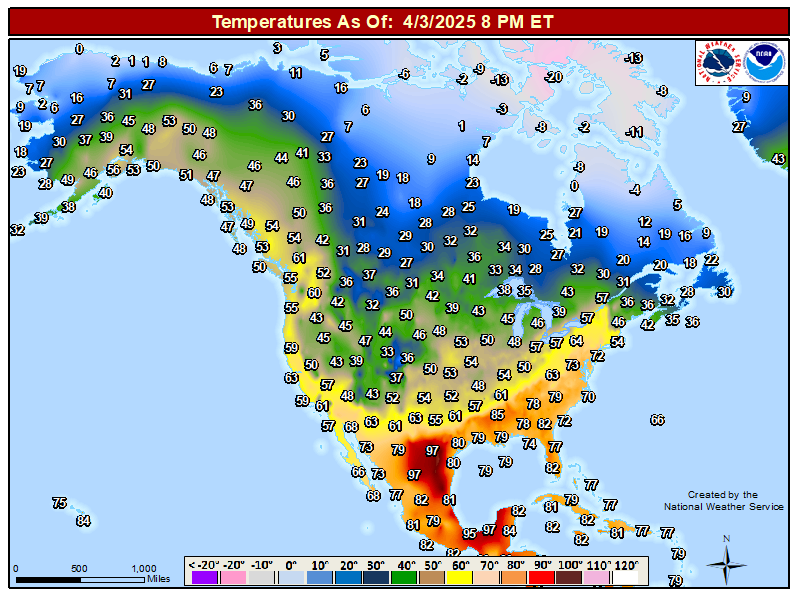 North America Temps |
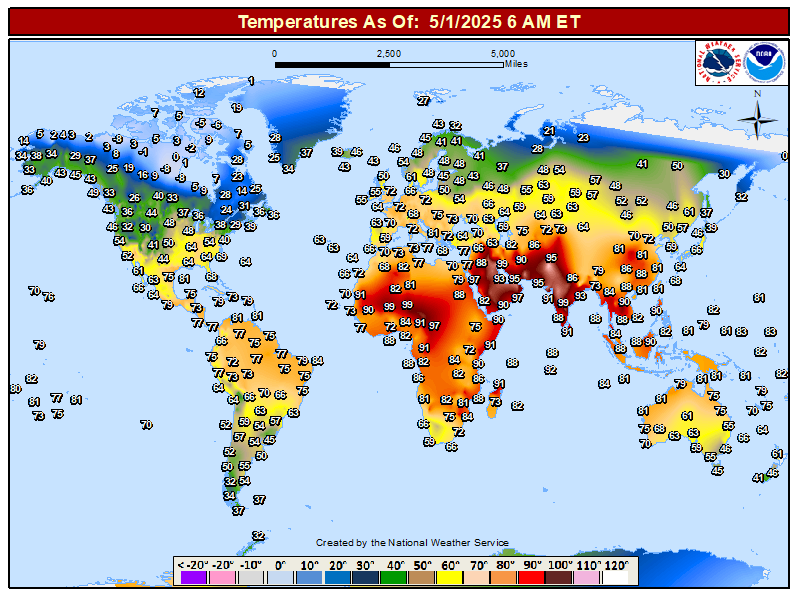 World Temps |
 1 Hr Temp Change |
 1 Hr Dewpoint Change |
 1 Hr RH Change |
 1 Hr Pressure Change |
 1 Hr PW Change |
 1 Hr Theta-E Change |
 1 Hr H85 Temp Change |
 1 Hr Cape Change |
 1 Hr MUCape Change |
 3 Hr Temp Change |
 3 Hr Dewpoint Change |
 3 Hr RH Change |
 3 Hr Pressure Change |
 3 Hr PW Change |
 3 Hr Theta-E Change |
 3 Hr H85 Temp Change |
 3 Hr Cape Change |
 3 Hr MUCape Change |
 6 Hr Temp Change |
 6 Hr Dewpoint Change |
 6 Hr RH Change |
 6 Hr Pressure Change |
 6 Hr PW Change |
 6 Hr Theta-E Change |
 6 Hr H85 Temp Change |
 6 Hr Cape Change |
 6 Hr MUCape Change |
 24 Hr Temp Change |
 24 Hr Dewpoint Change |
 24 Hr RH Change |
 24 Hr Pressure Change |
 24 Hr PW Change |
 24 Hr Theta-E Change |
 24 Hr H85 Temp Change |
 24 Hr Cape Change |
 24 Hr MUCape Change |
 Central Plains |
 Southern Plains |
 Southern Rockies |
 CONUS Radar |
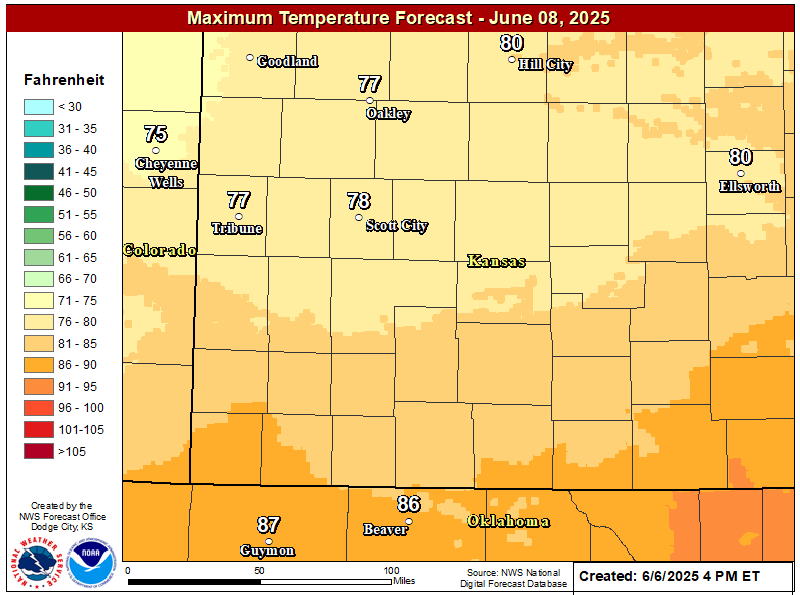
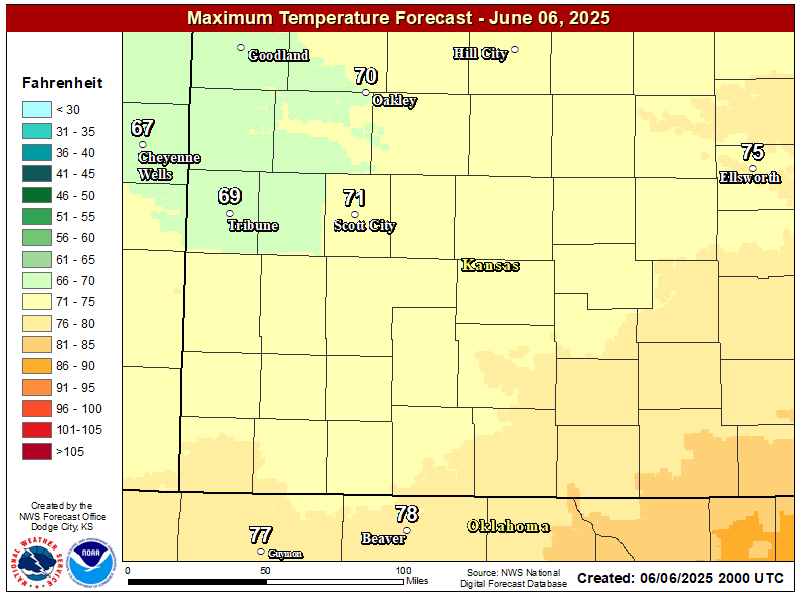 Day 1 Max T |
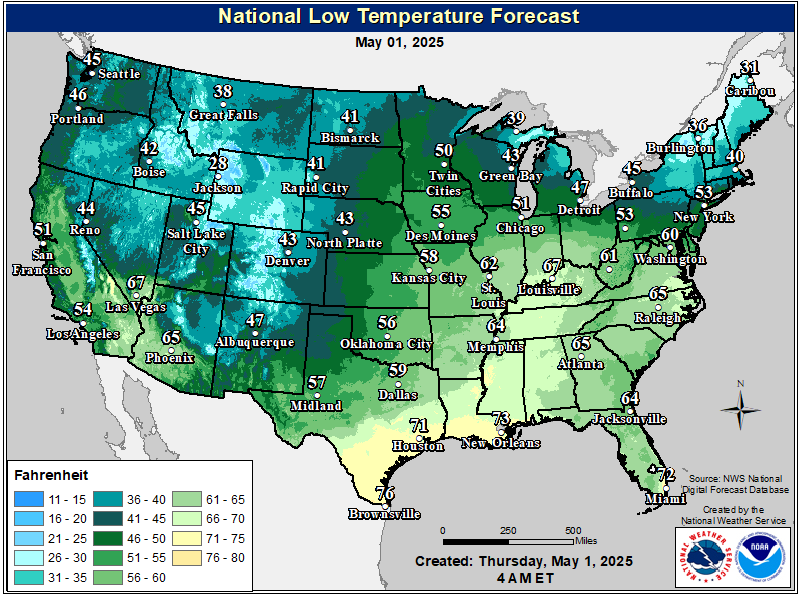
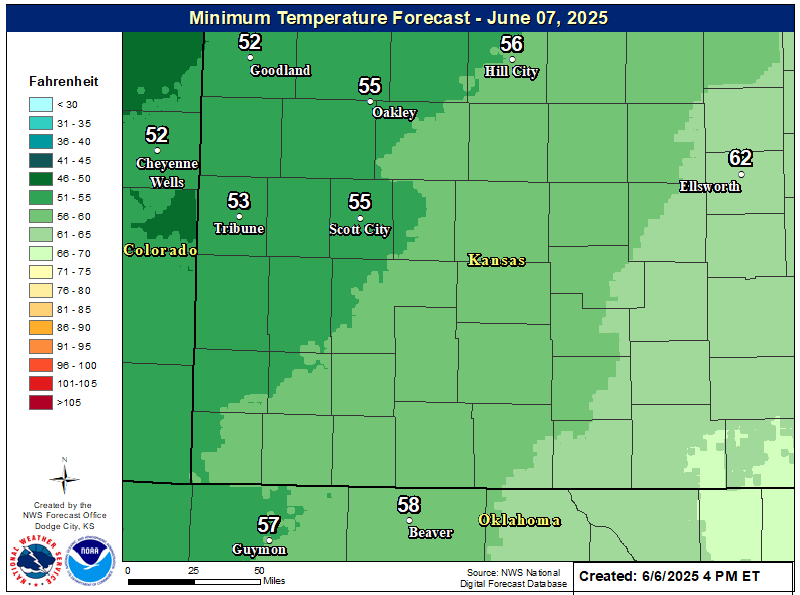 Day 1 Min T |
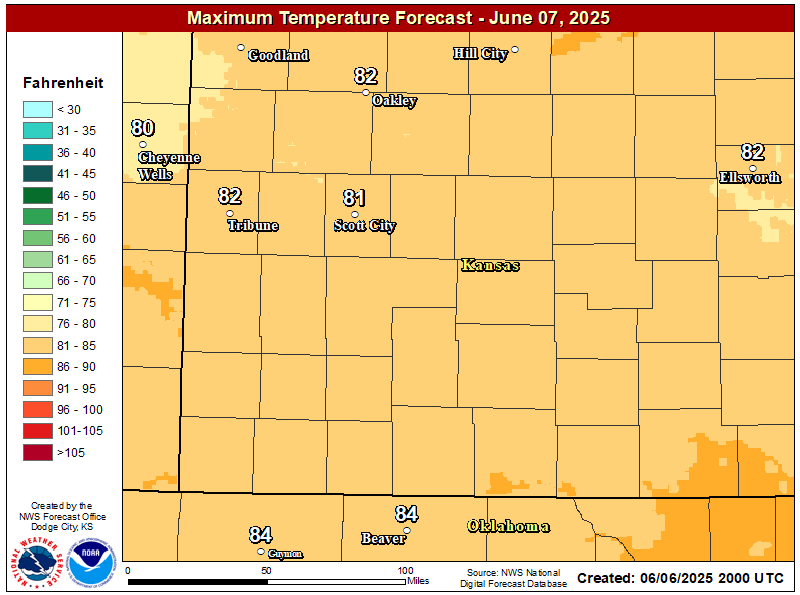 Day 2 Max T |
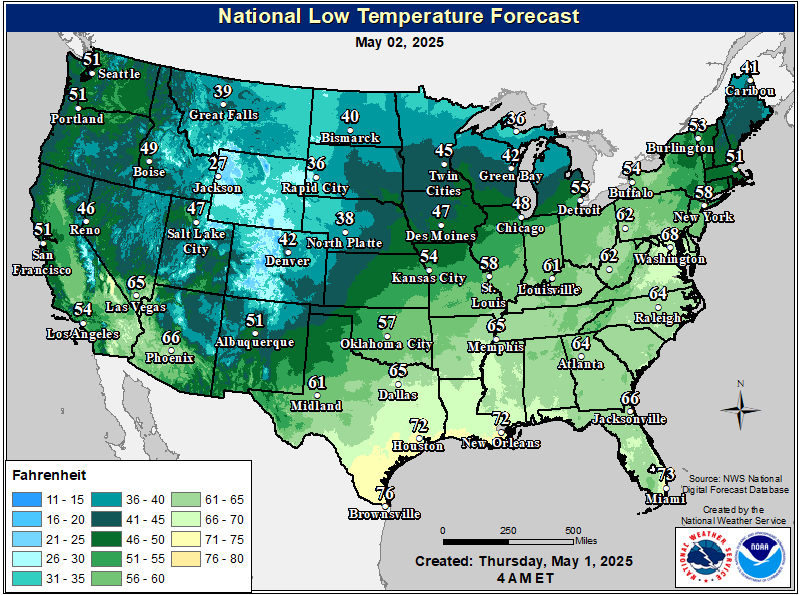
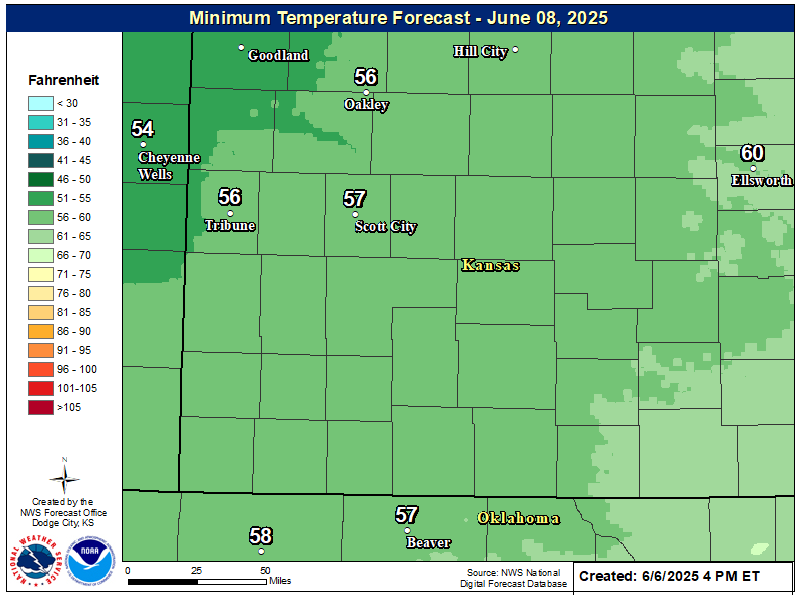 Day 2 Min T |
 Day 3 Max T |
 Day 1 Max T |
 Day 1 Min T |
 Day 2 Max T |
 Day 2 Min T |
 Day 3 Max T |
 Day 1 Max T |
 Day 2 Max T |
 Day 3 Max T |
 Day 4 Max T |
 Day 5 Max T |
 Day 1 Min T |
 Day 2 Min T |
 Day 3 Min T |
 Day 4 Min T |
 Day 5 Min T |
 Max T Difference |
||
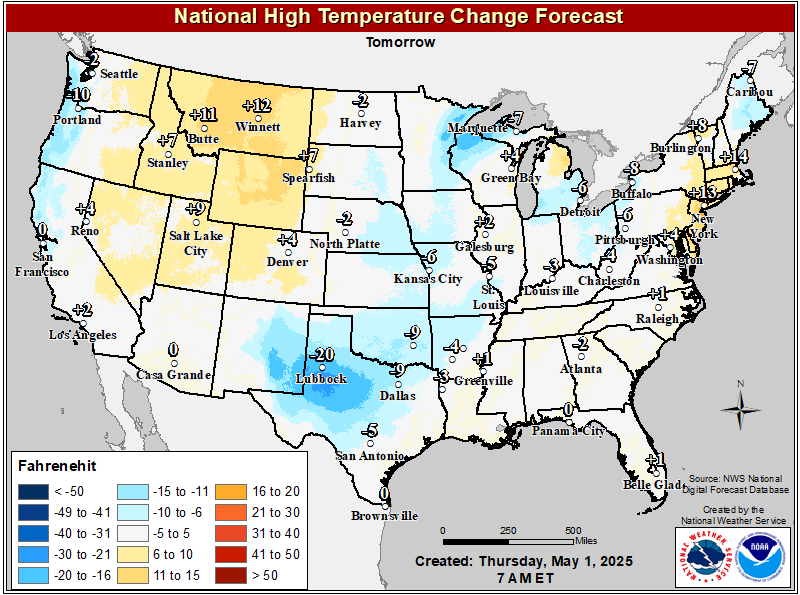 Max T Difference |
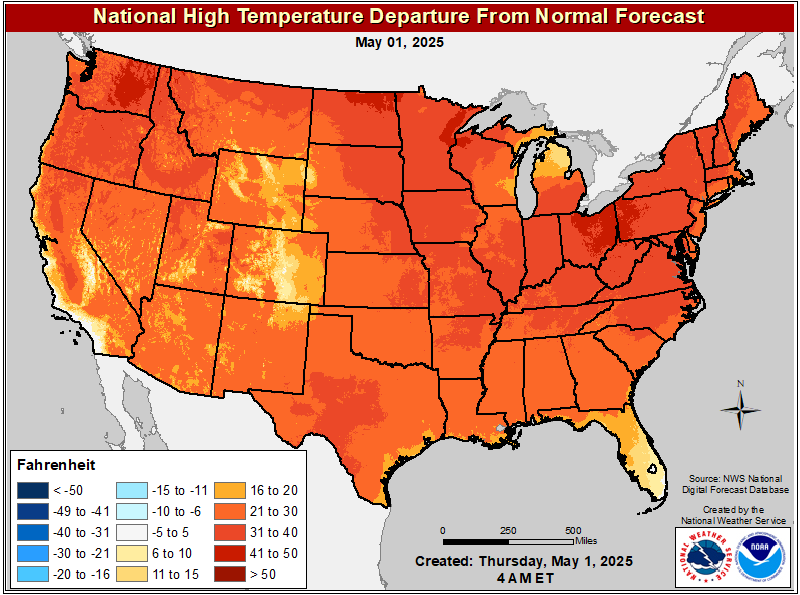 D1 Max T Departure |
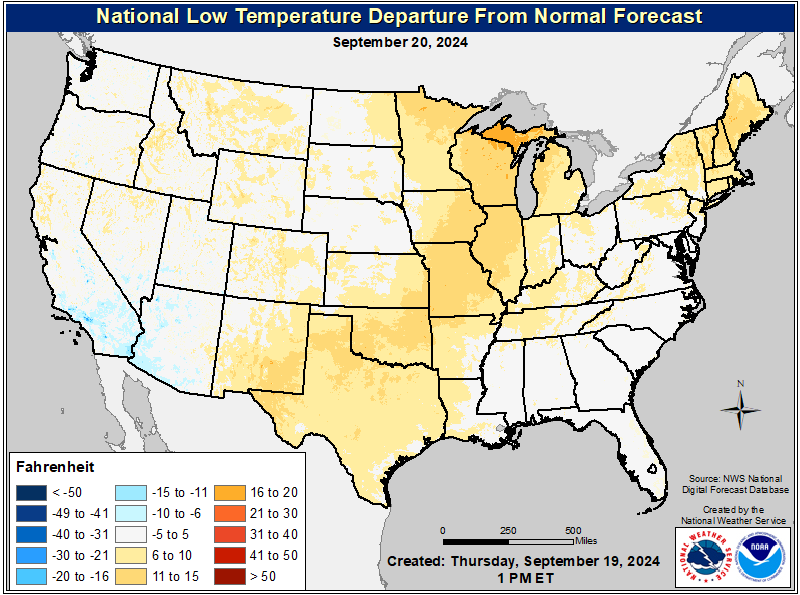 D1 Min T Departure |
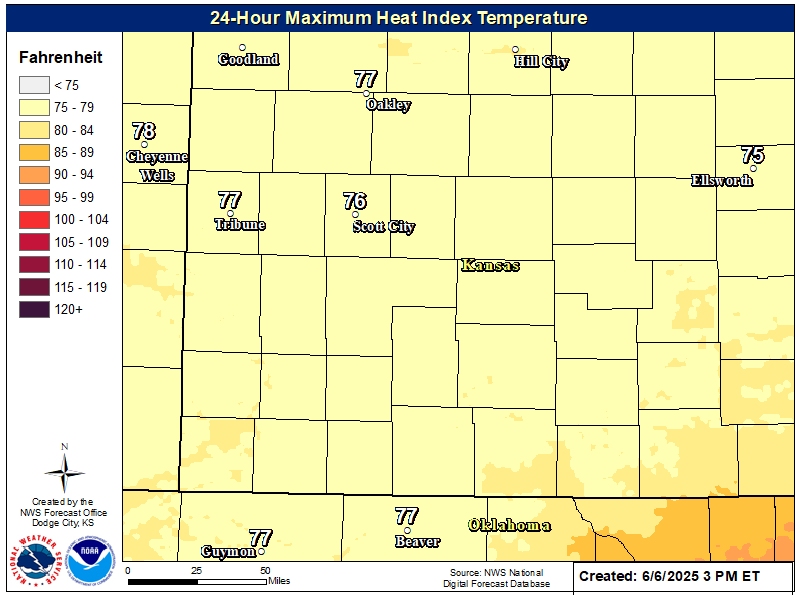 24-Hour Maximum Apparent Temperature |
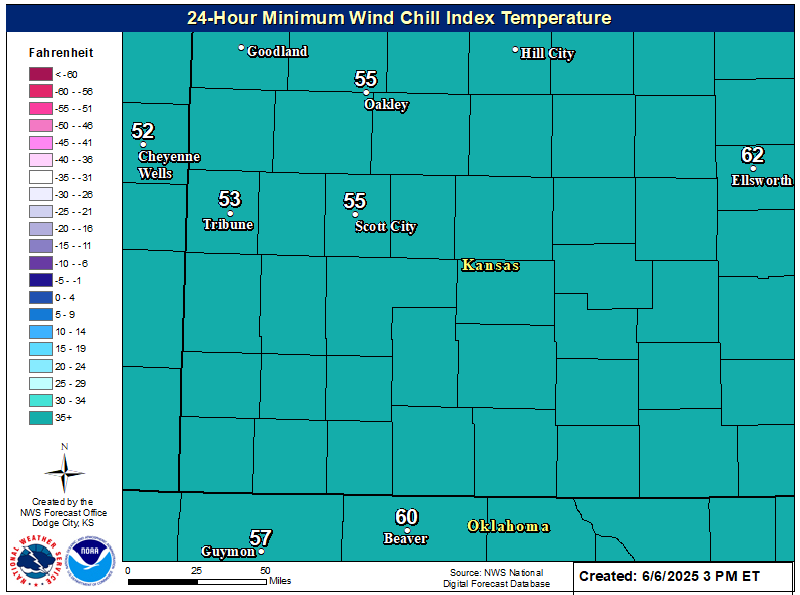 24-Hour Minimum Apparent Temperature |
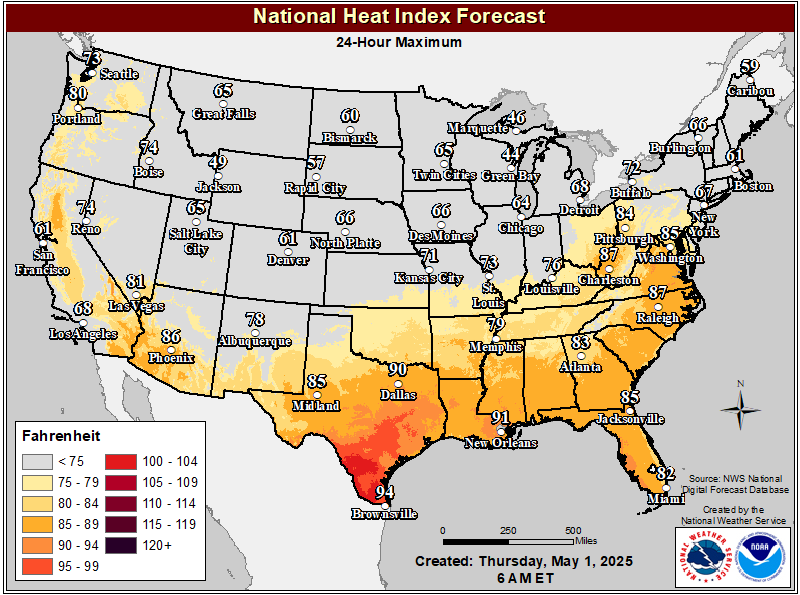 24-Hour Maximum Apparent Temperature |
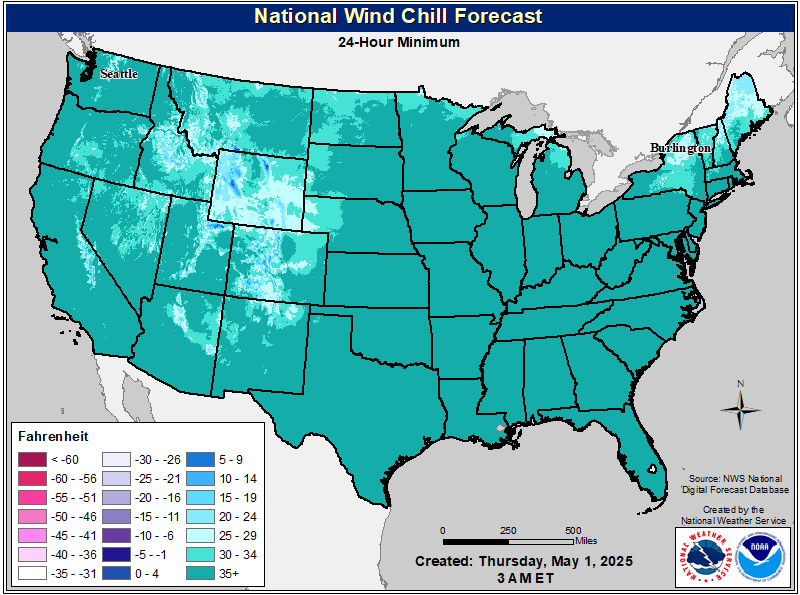 24-Hour Minimum Apparent Temperature |
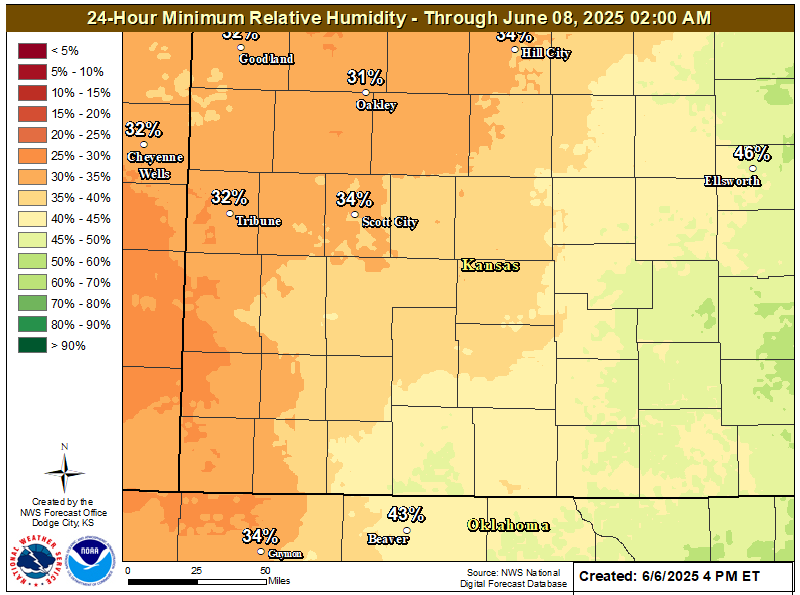
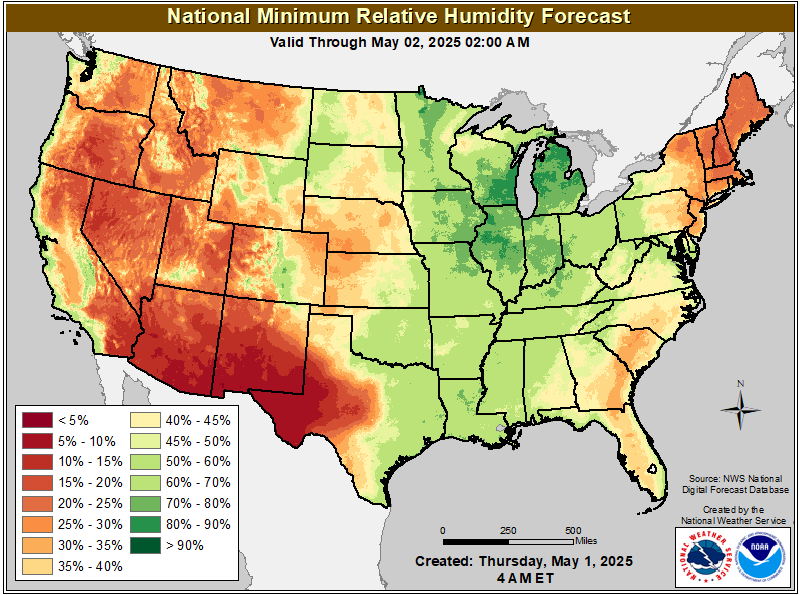
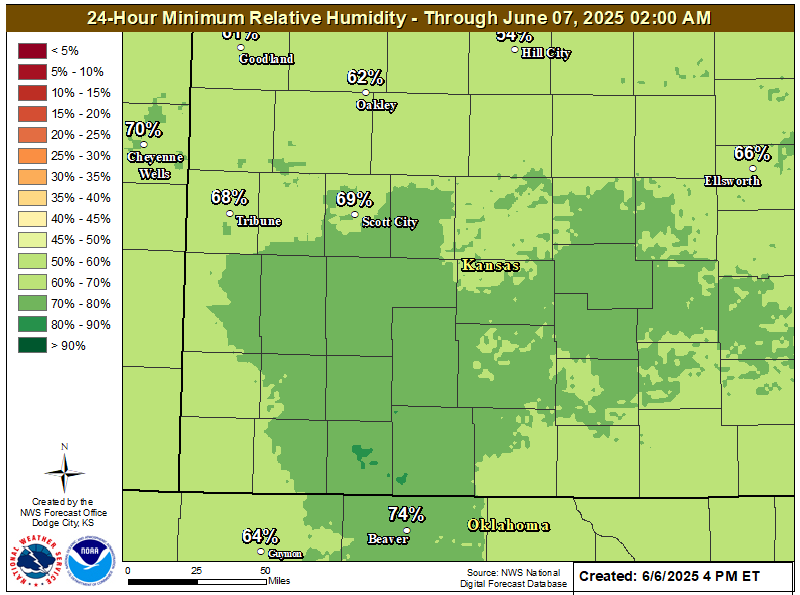 Day 1 Minimum Relative Humidity |
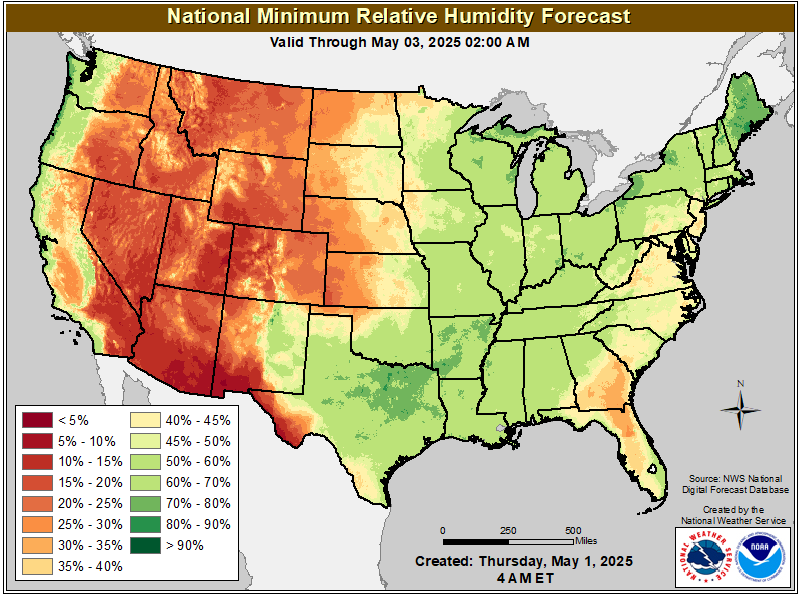
 Day 2 Minimum Relative Humidity |
|||
 Day 1 Minimum Relative Humidity |
 Day 2 Minimum Relative Humidity |
|||
 Day 1 Max RH |
 Day 2 Max RH |
 Day 3 Max RH |
 Day 4 Max RH |
 Day 5 Max RH |
 Day 1 Min RH |
 Day 2 Min RH |
 Day 3 Min RH |
 Day 4 Min RH |
 Day 5 Min RH |
 24-Hour BOX |
 24-Hour CONUS |
|
3-Day DDC |
3-Day CONUS |
 3-Day CONUS |
 DDC |
 CONUS |
 CONUS |
 DDC |
 CONUS |
 DDC |
 CONUS |
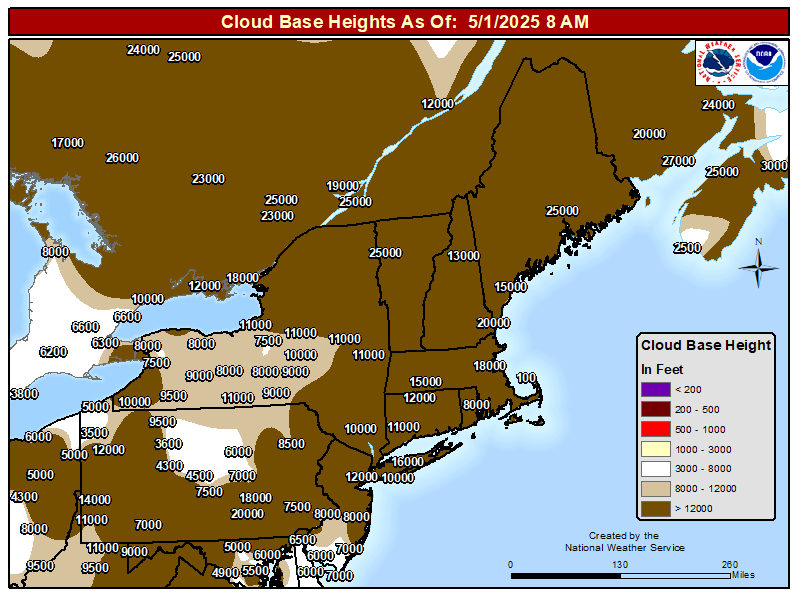 Cloud Base |
 Flight Category |
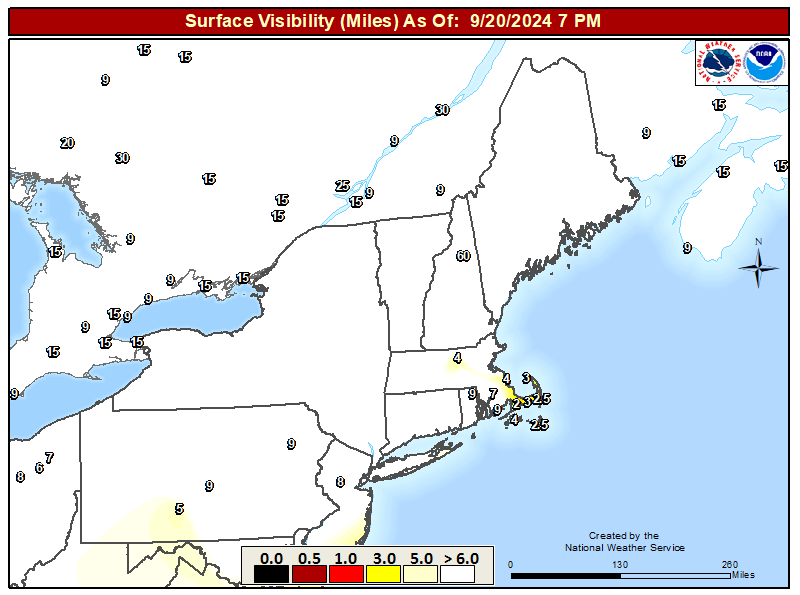 Visibility |
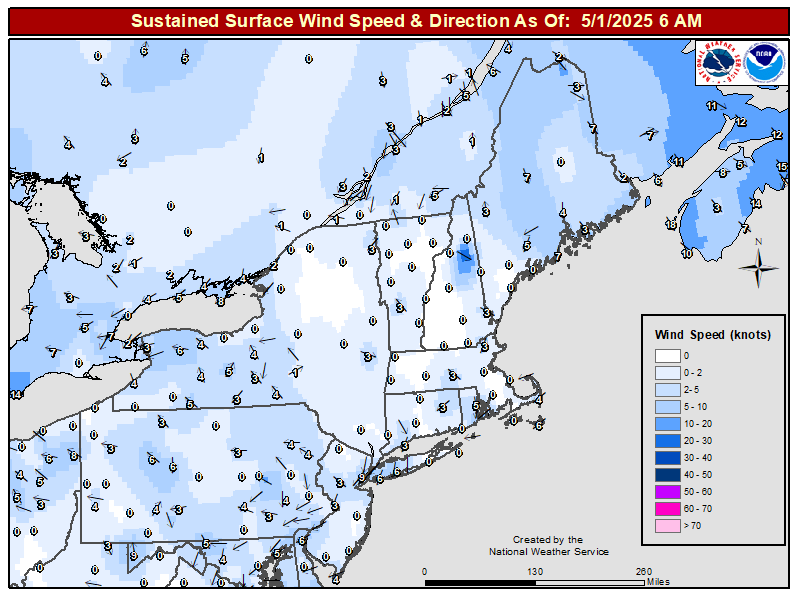 Wind |
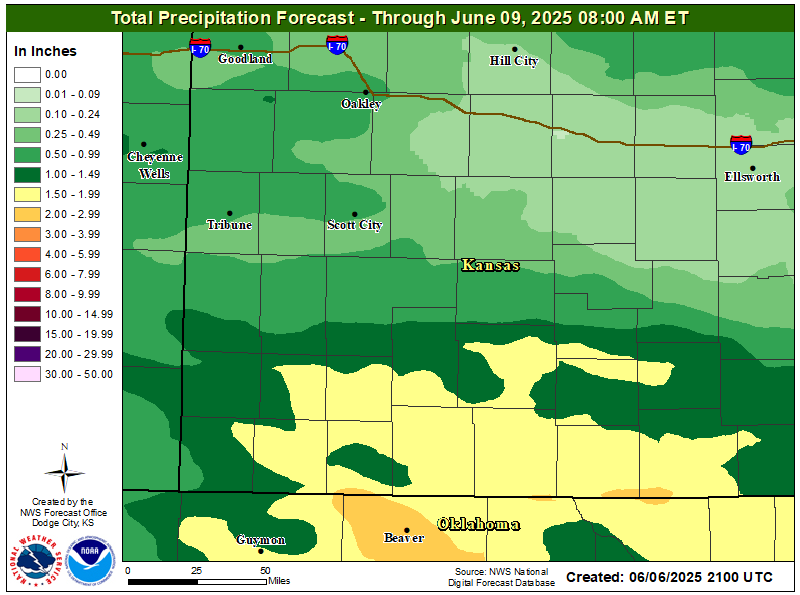
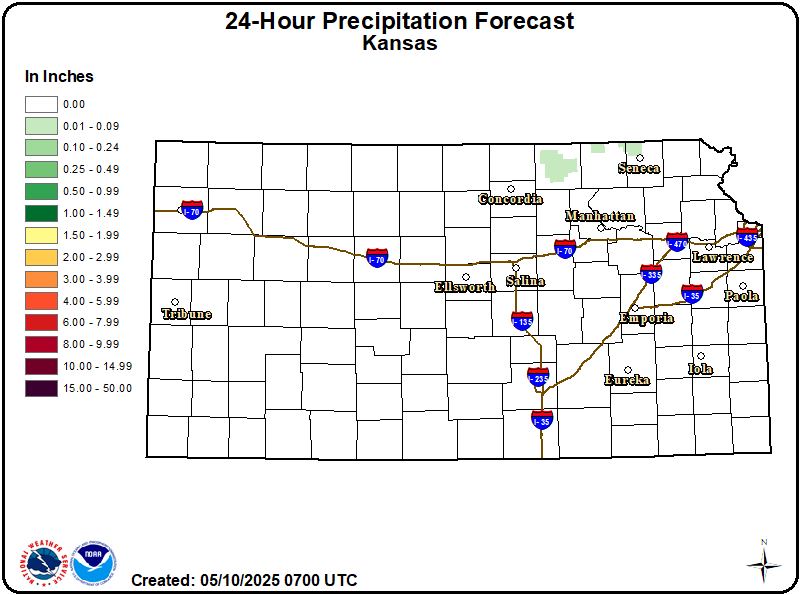 24-Hour Precipitation |
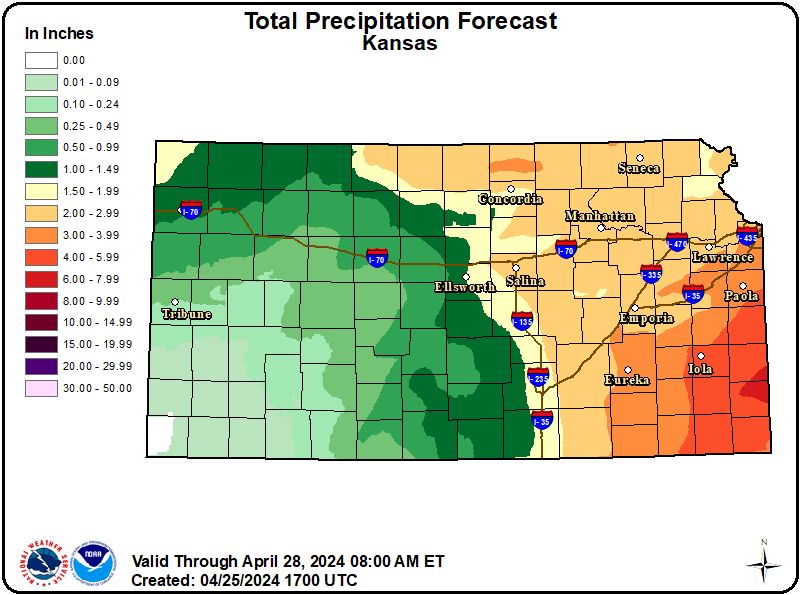 3-Day Precipitation |
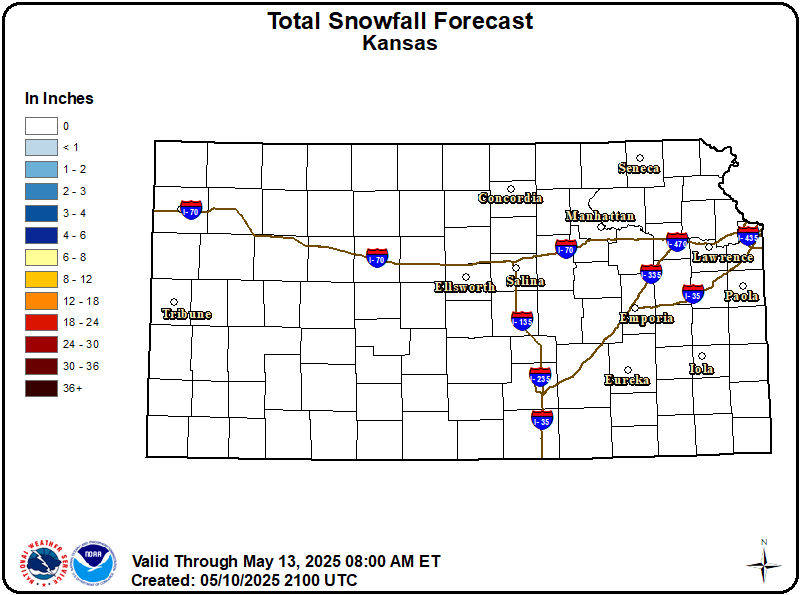 2-Day Snowfall |
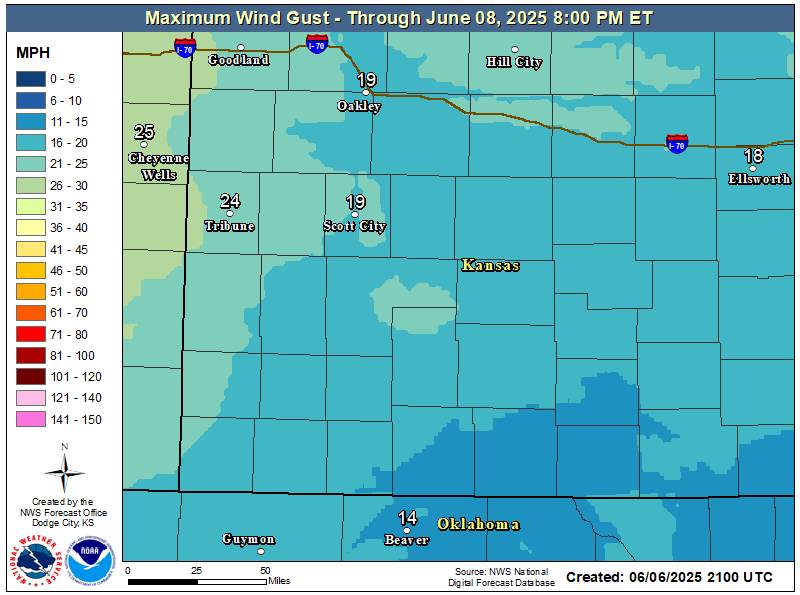
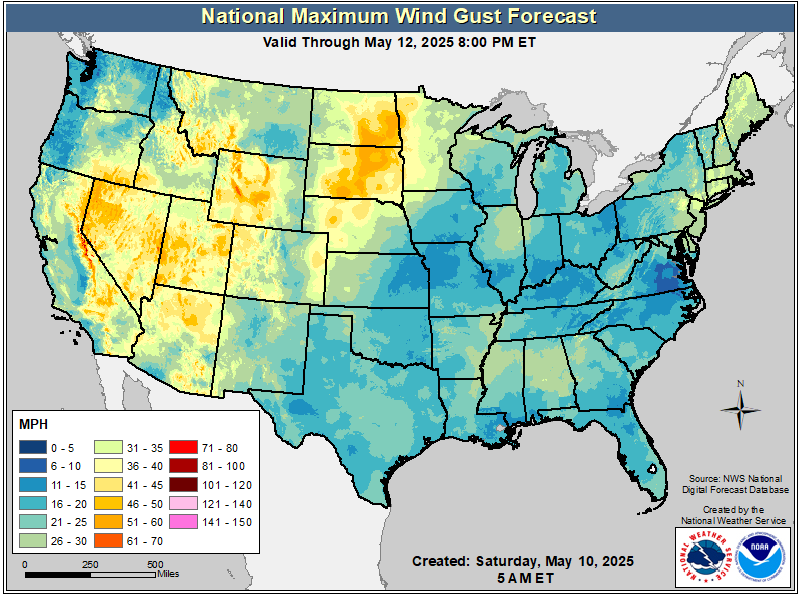
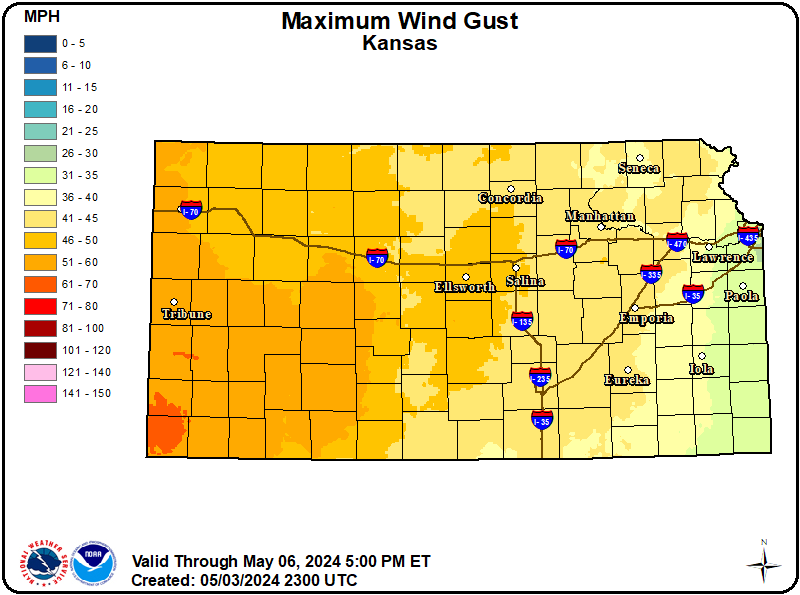 3-Day Maximum Wind Gust |
Model Output (from NOAA / NWS Sources that can be used via Social Media):
Resources:
CR Warning Impact Graphics