National Weather Service United States Department of Commerce

Heavy Rainfall in the East Wednesday; Hot Temperatures Continue in Coastal Southern California

Heavy to excessive rainfall may lead to flooding Wednesday over southwest Pennsylvania into northern West Virginia, and western Maryland. Flood Watches have been issued. An extended period of hot weather will continue for parts of coastal southern California including Los Angeles through Thursday. Heat Advisories remain in effect. Read More >

Return to DDC Home Page

Click for...


High/Low Temperatures, Precipitation, Snowfall, Snowdepth maps


Questions or comments may be directed to the webmaster


Preparedness and Safety Resources

Several .pdf files - Download Adobe Reader

In times of hazardous events and disasters, too often people are not prepared resulting in an even larger disaster. There are some steps you can take to be better prepared in case a hazardous event or disaster occurs in your region. Take the time to visit some of the following resources and get you and your family ready for the next major storm. The FEMA "Are You Ready" book is a comprehensive guide on being prepared. You can order your own copy by calling 1-800-480-2520 and selecting option 1.

Preparedness:

Winter Storms: 

Severe Thunderstorms:

Lightning:

Extreme Heat:

Extreme Cold:


Flooding and Flash Flooding:


Drought:


Ultraviolet Radiation:


Resources for Children:


Other Resources:


NOAA WEATHER RADIO

 “The Voice of the National Weather Service”

NOAA Weather Radio is the fastest and most reliable way to receive severe weather watches, warnings and advisories. Weather Radio is broadcast direct from each National Weather Service office serving Kansas through a network of 25 special frequency transmitters.  Many radio and TV broadcasters rely on weather radio to receive Emergency Alert System (EAS) information for warnings, watches and other critical information.  For the individual, newer type radio receivers with the S.A.M.E. technology can be programmed to only alert for pre-selected counties.  In addition, routine 7 day forecasts, wind chill readings, weather summaries, river stages and much more data are available on weather radio 24/7 direct from the National Weather Service.

 The All Hazards feature of the radio means that critical information such as evacuations, chemical spills, nuclear releases, toxic fumes etc from local county emergency management, law enforcement and others will be relayed on NOAA Weather Radio. In 2004, NOAA Weather Radio began relaying AMBER Alerts, a child abduction recovery program, issued by the Kansas Bureau of Investigation.

The main NOAA Weather Radio page can be found here.

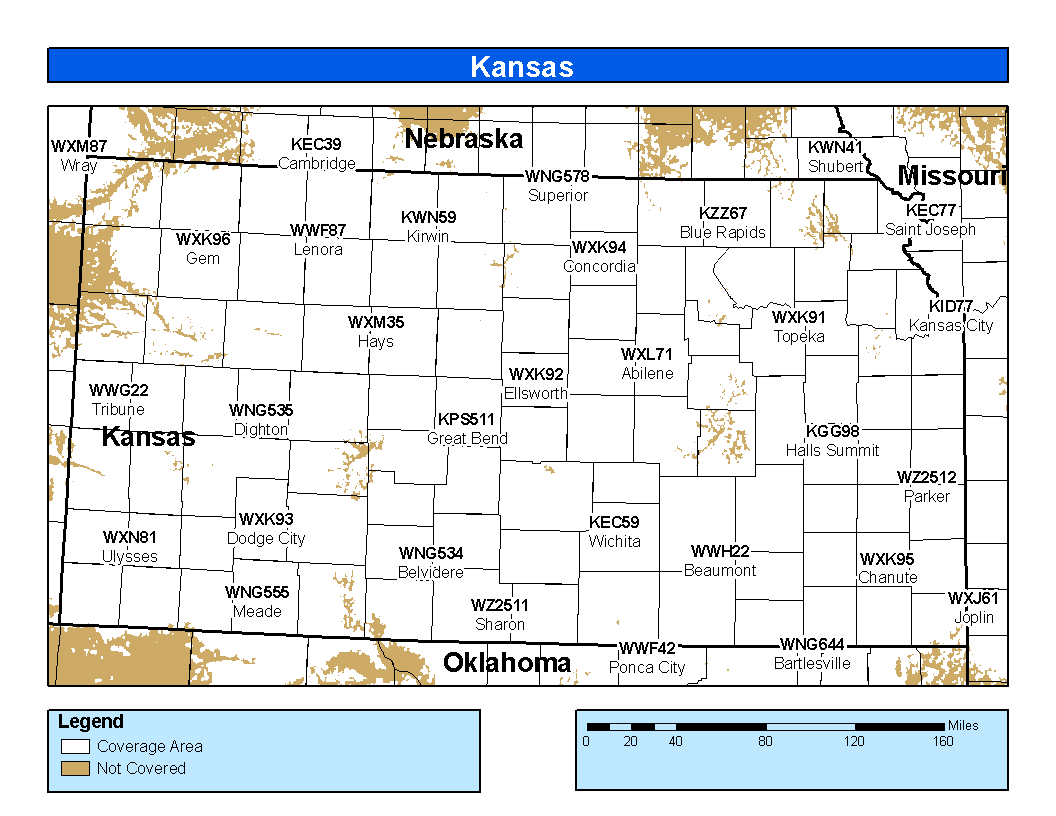
 The map below shows the latest NOAA Weather Radio coverage in Kansas . More in-depth information including county specific codes for S.A.M.E. receivers can be found at: http://www.nws.noaa.gov/nwr/CntyCov/nwrKS.htm


Southwest Kansas Skywarn


             Training and Safety Information


Severe Weather Safety Guide

These links are courtesy of the National Weather Service Office in Norman, OK.

Severe Weather Safety Guide
Spotters Field Guide


Local Products
Regional Products


National Products

Southwest Kansas
Fire Weather Information


Full Fire Weather Planning Forecast

(issued every morning by 6 am then updated as needed during the day)


SPC Day 1 Fire Outlook

SPC Day 1 Fire Weather Outlook
 SPC Day 2 Fire Outlook

SPC Day 2 Fire Weather
SPC Experimental Day 3-8 Outlook
Experimental Day 3-8 Fire Weather Outlook

Printer Friendly Version of Fire Weather Outlooks Map and Discussion

Please note: these products are issued by the NWS Storm Prediction Center and are not updated routinely.

NWS GLD Fire Weather

 Today's Weather Trivia

Today's Date is Tuesday May 20, 2025...\n ON... May 20, 1903 In Southwest Kansas, a tornado moved northeast, then east at Ashland and near Lexington. About 55 homes were damaged at Ashland. Barns were destroyed on two farms that were struck. IN 1916...A tornado struck the town of Codell, KS. Another tornado struck the town the next year, and a third tornado hit again the following year. IN 1918...In western Kansas a large tornado moved northeast from 10 miles southeast of Wakeeney. Over 200 head of cattle were killed and many others were injured. Farm machinery was carried considerable distances, and many farm buildings were swept away. Damage was $100,000. IN 1949...Eight or more tornadoes were involved along an 85 mile long track across the counties of Gray, Ford, Hodgeman and Pawnee. Newspapers in the area used headlines such as Tornado army attacks Kansas to describe the record breaking number of tornadoes, at least 40 that hit the central and western part of the state. No people were killed, but hundreds of animals were. Four funnels were seen moving northeast about 6 miles northwest of Dodge City. A tornado moved northeast from 7 miles southwest of Coldwater KS, just missing that town, and ending at Wilmore. The "huge rotating column" sent the entire town of Coldwater running to storm cellars. Most of the $200,000 damage was at Wilmore, as the entire town was torn apart. IN 1951...A tornado moved east-northeast near Scott City KS. A large barn was destroyed south of Scott City. The tornado struck five farms. IN 1957...A tornado touched down to the southwest of Kansas City and traveled a distance of 71 miles cutting a swath of near total destruction through the southeastern suburbs of Ruskin Heights and Hickman Mills. The tornado claimed the lives of 45 persons, and left hundreds homeless. It was the worst weather disaster of record for Kansas City.


Weather Trivia by month

JAN FEB MAR APR MAY JUN
JUL AUG SEP OCT NOV DEC

If you enjoyed today's weather trivia, you may also like....

  • Also from NOAA's history site - Stories and Tales of the early Weather Service includes: personal accounts of lives in the Weather Service, war tales, stories of experiences in violent weather phenomena, technological tales, and an account of NOAA in the space age.


Short Fuse Composite Charts
objective meso-analysis using hourly FSL LAPS analysis grids and FSL/NWS GFE software

 
Short Fuse Composite chart 1
Chart #1:  Surface-based Moisture Convergence, Warm Theta Advection, Theta-E
Mouseover links to view previous hours
Short Fuse Composite chart 2
Chart #2:  Surface-based CAPE, Low Level Lapse Rate (0-2.5km AGL)


  • LAPS/GFE Short Fuse Composite "Threat Area" (critical threshold values will be devloped in the future upon testing this spring)
    • Within the maximum of surface moisture convergence
    • Immediately downwind of the warm theta advection axis
    • Within the axis of highest surface based instability (CAPE and Theta-E)
    • Within the region of lowest surface based convective inhibition (0-2.5km AGL lapse rate)
    • Temporal and spatial continuity of at least 3 hours of all of the above
  • More information on the original Short Fuse Composite and its utility in nowcasting initiation and location of the most intense convective storms (that can lead to potential tornado development) can be found in this paper:
    • Jim Johnson, 1993: The "Short Fuse" Composite: An Operational Analysis Technique for Tornado Forecasting.  In The Tornado: Its Structure, Dynamics, Prediction, and Hazards (C. Church, D. Burgess, C. Doswell, and R. Davies_Jones, eds.). Geophysical Monograph 79, American Geophysical Union, Washington, D.C. pp. 605-610.   Click HERE! to read document in .pdf format.
    • Discussion of the old and new technique is offered HERE.
  • Some information on the generation of these graphics:
    • The charts are currently updating at :35 past the hour.  (Future plans are to hopefully run LAPS earlier to get the valid time graphics updated perhaps as early as :20 past the hour.
    • The surface moisture flux convergence graphic is computed locally using MSAS hourly analysis wind fields (instead of LAPS).  MSAS uses a better quality control algorithm to filter out poor wind observations, versus the LAPS analysis scheme.  Testing has concluded that the moisture convergence field offered a better signal using MSAS winds in most convective events.
    • Warm Theta Advection, Theta-E, and CAPE graphics are all the internally calculated grids from within LAPS itself.  (Future plans are to also calculate Theta Advection using MSAS winds, but the "potential temperature advection" grid from LAPS itself tends to have less noise than moisture convergence).
       
  • Latest Changes & Recent Events:
    • (6/20/2005)  We have changed Chart 2 to remove surface-based CIN and use, instead, 0-2.5km AGL low level lapse rate.  A discussion on this change can be found HERE
    • (10/5/2005)   Version 1.0 of AWIPS Short Fuse Composite is now available on the NWS AWIPS Local Applications Database.
    • (10/5/2005)  A two-part Powerpoint presentation "Using the Short Fuse Composite to Forecast Severe Convection" is now available which was presented at the 2005 9th Annual High Plains Conference.
      Part I - "History of the SFC in the AFOS Era"
      Part II - "The Next Generation SFC" which includes Case Study examples from April 10, June 9, July 3, and August 19 2005.
Questions or comments regarding the graphics can be directed to Mike Umscheid (application developer).

See anything missing? Let us know and we might add it.

Please e-mail our webmaster for questions or comments


Facebook pages for NWS offices in our region
 
Dodge
City
Goodland Hastings Topeka  Wichita Amarillo Pueblo


National Centers

NOAA

SPC WPC CPC  Fire Aviation


Chaser Weather!     Latest Text Products     Model Data

Still can't find what your looking for? Feel free to email our webmaster who will redirect you to the page you are looking for!


Return to Previous Page