|
Welcome to the Michigan Drought Dashboard. This page hosts information and resources about current drought conditions and impacts as well as forecast and historical information. The following websites provide detailed Michigan-specific drought information.
Localized Drought Information Statements issued by NWS Weather Forecast Offices can be found below. |
 |
US Drought Monitor Changes
| 1 Week Change | 2 Week Change |
 |
 |
|
|
|
| 1 Month Change | 3 Month Change |
 |
 |
|
|
|
| 6 Month Change | 1 Year Change |
 |
 |
Resources
Latest Precipitation and Temperature Trends
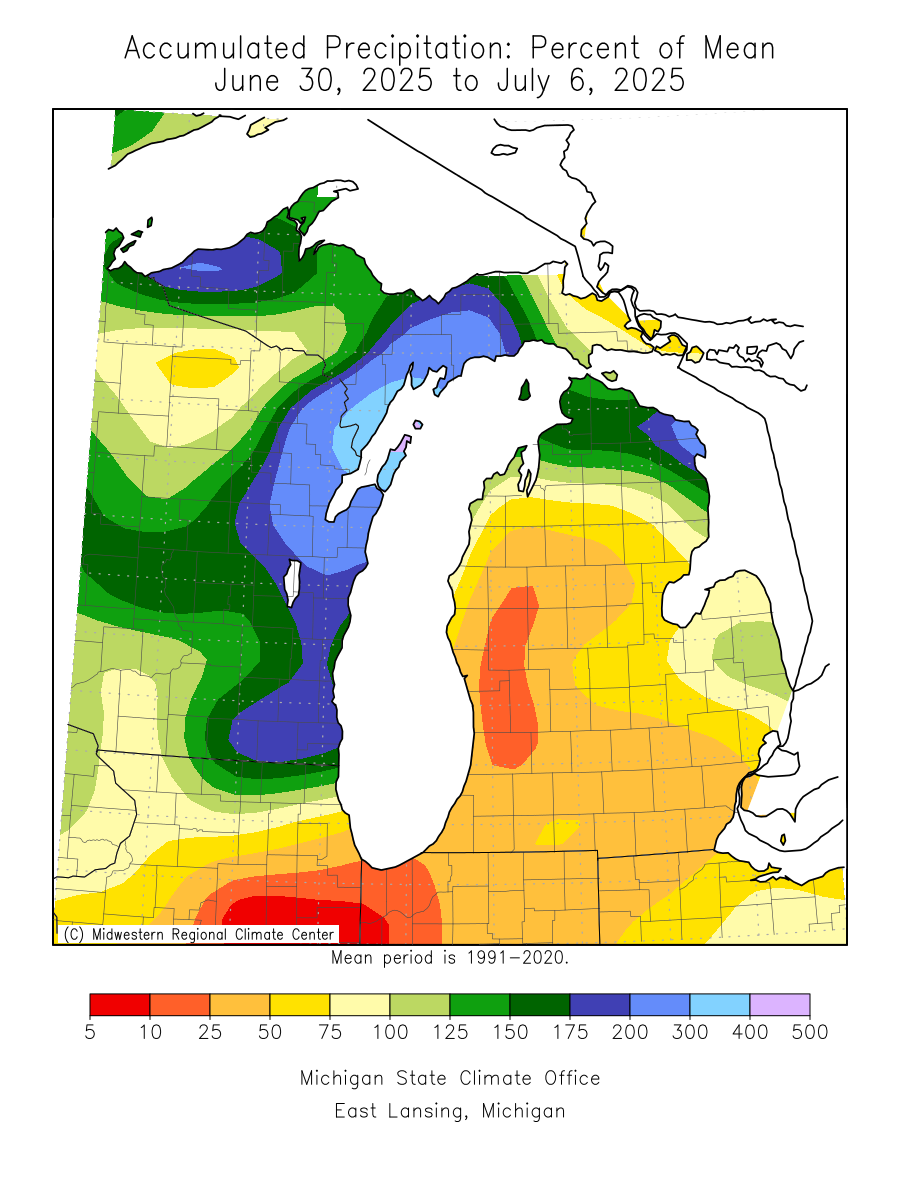
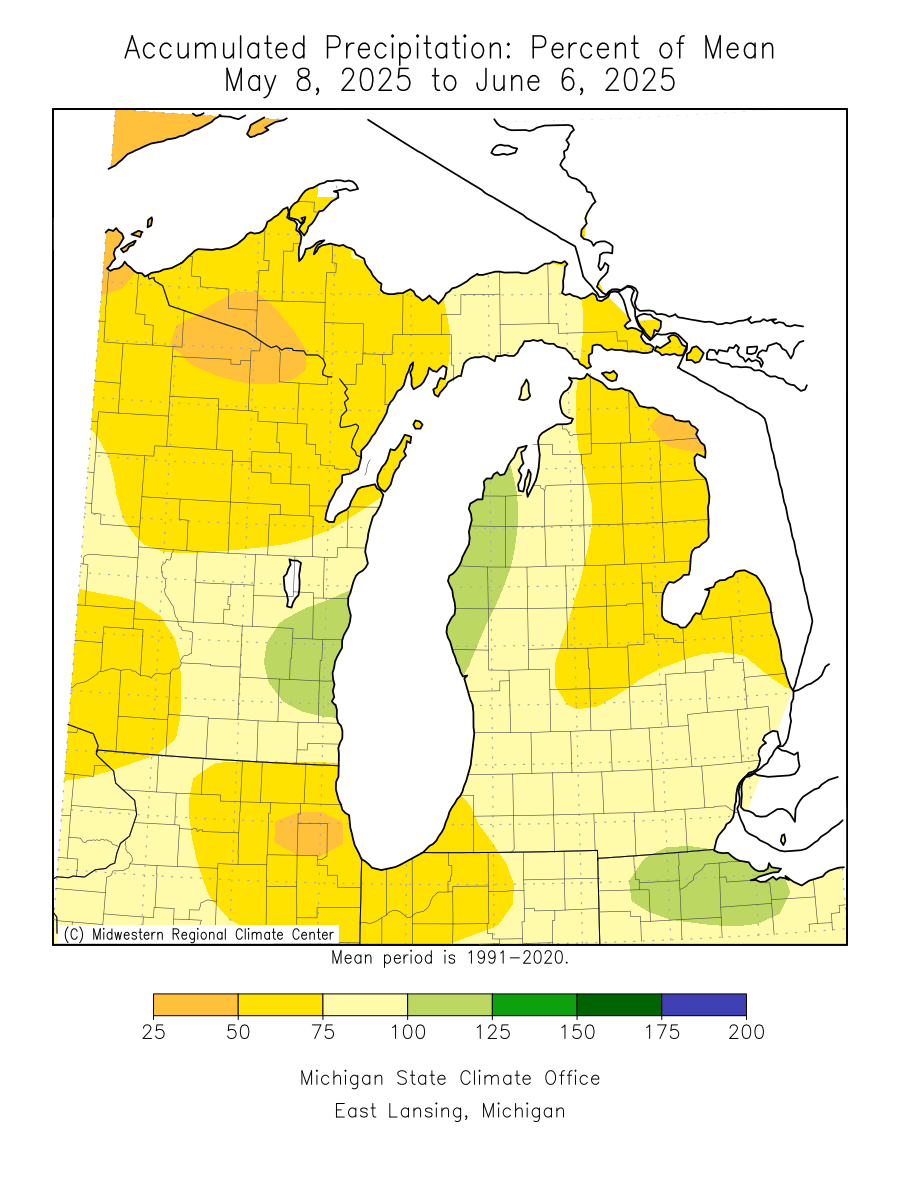
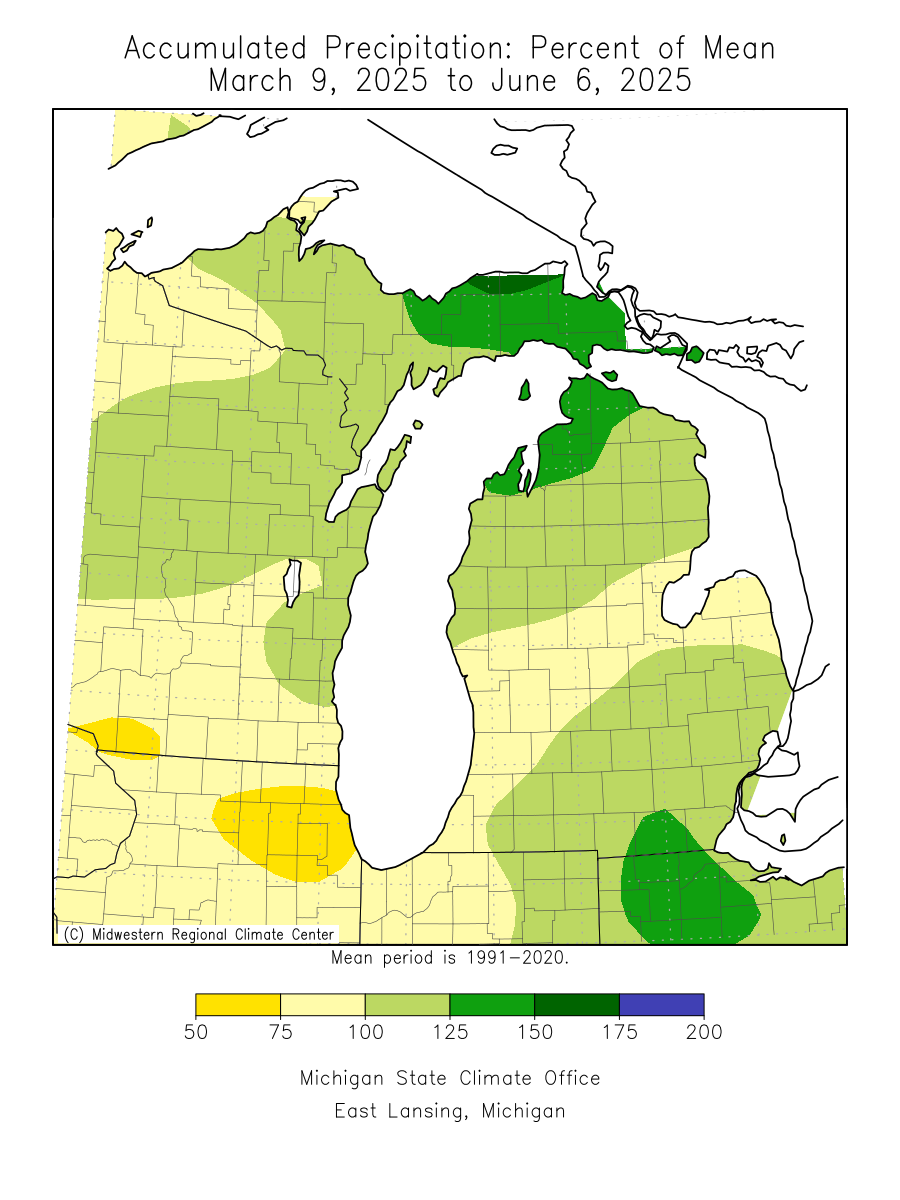
| Precipitation Percent of Mean | ||
| 7 Day | 30 Day | 90 Day |
 |
 |
 |
|
|
||
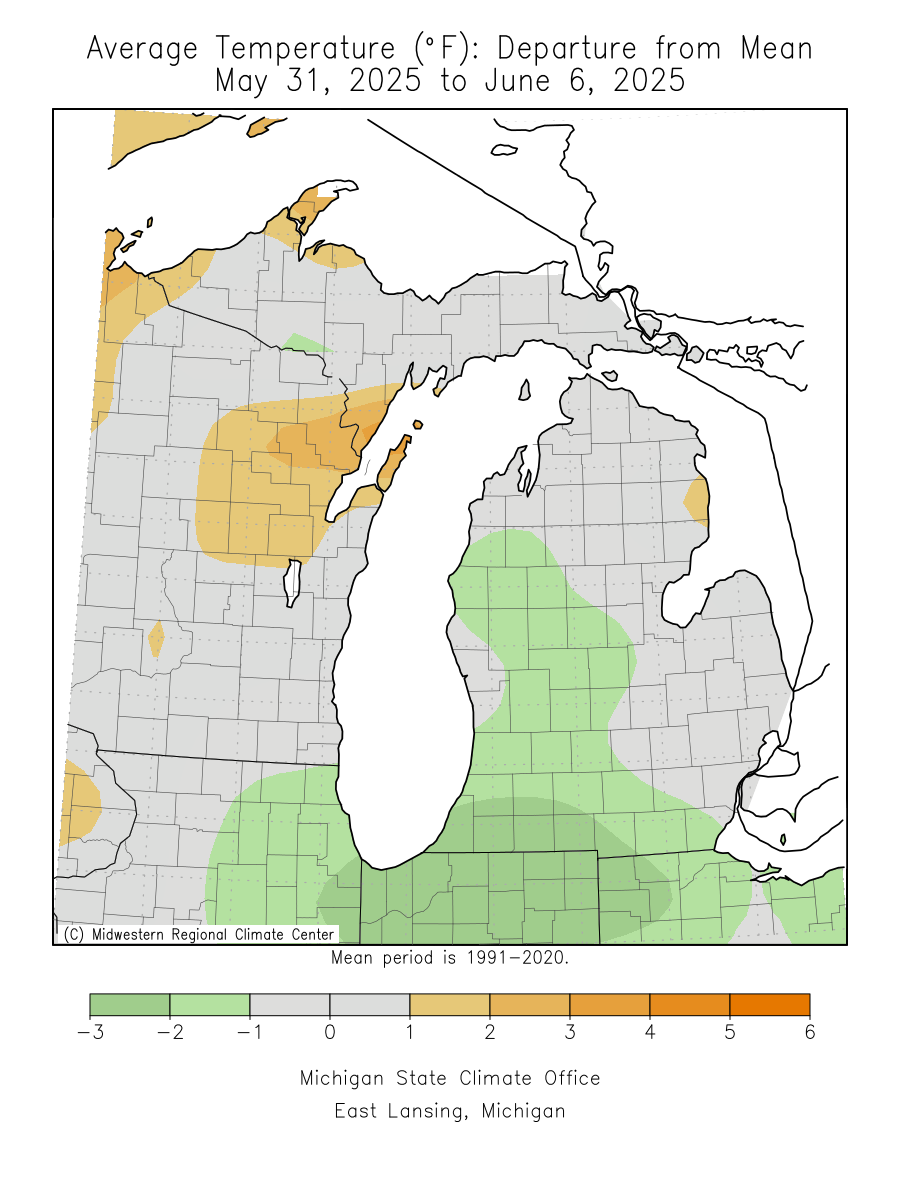
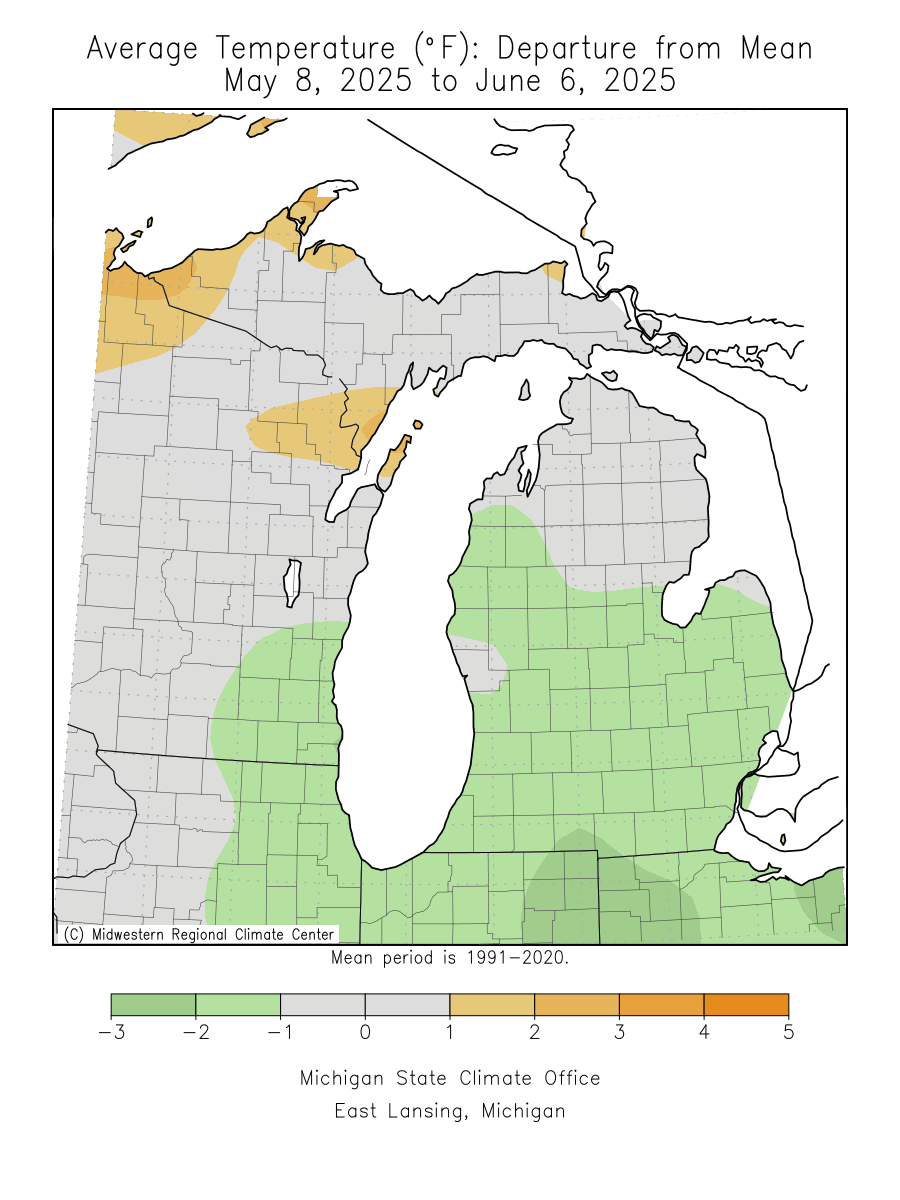
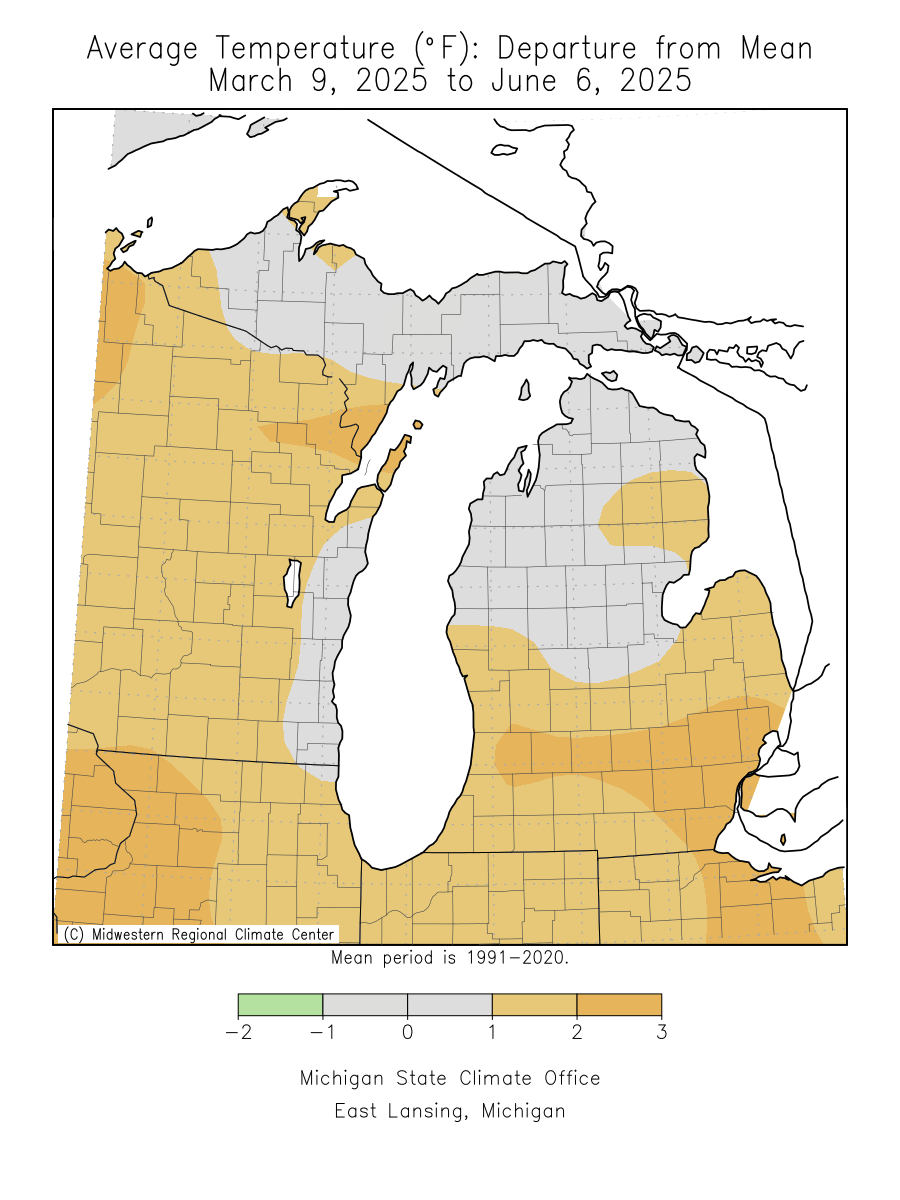
| Temperature Departure from Mean | ||
| 7 Day | 30 Day | 90 Day |
 |
 |
 |
|
|
||
| Standardized Precipitation Index (SPI) Definition |
||
| 30 Day | 60 Day | 90 Day |
 |
 |
 |
|
|
||
| ASOS Year-To-Date Plots | ||
| Grand Rapids | Kalamazoo | Lansing |
 |
 |
 |
|
|
||
| Detroit | Flint | Saginaw |
 |
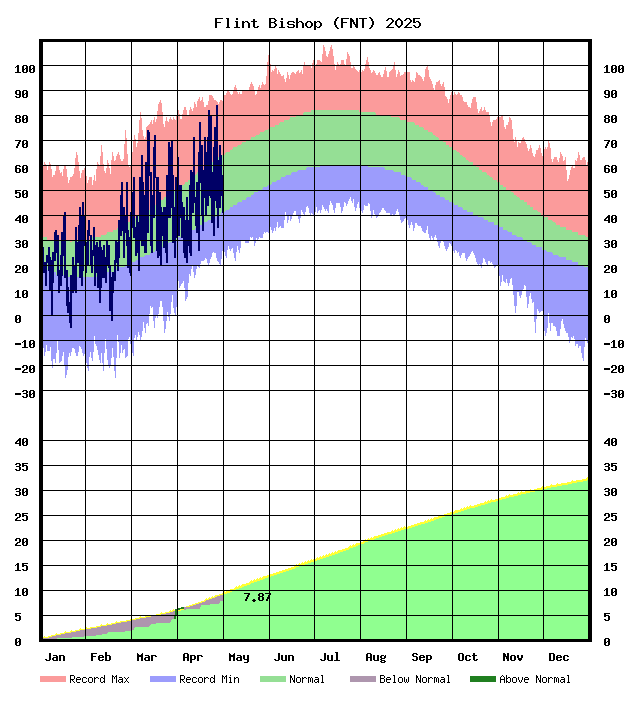 |
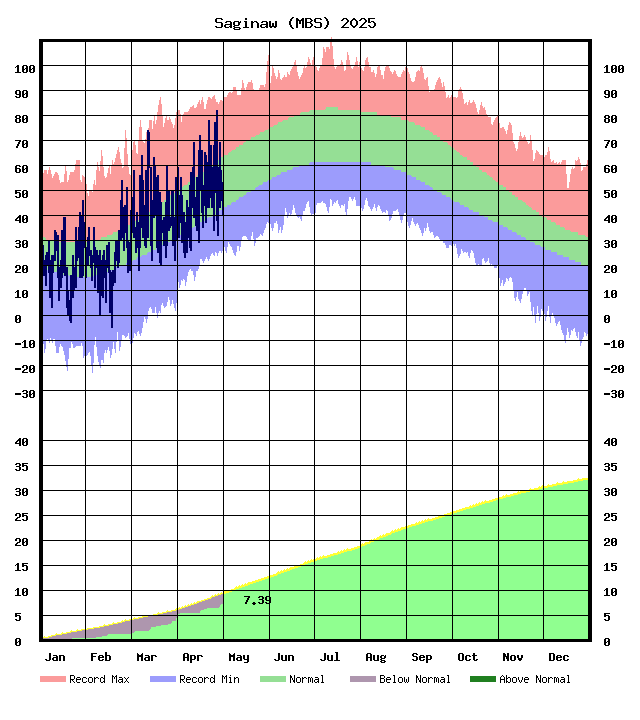 |
|
|
||
| Marquette | ||
 |
||
Resources
Impacts
| Evaporative Demand Drought Index (EDDI) | |
| 1 Week | 2 Week |
 |
 |
|
|
|
| 1 Month | 3 Month |
 |
 |
| Soil Moisture | |
| Daily Soil Moisture Anomaly | Daily Soil Moisture Percentile |
 |
|
|
|
|
| Monthly Soil Moisture Anomaly | Monthly Soil Moisture Percentile |
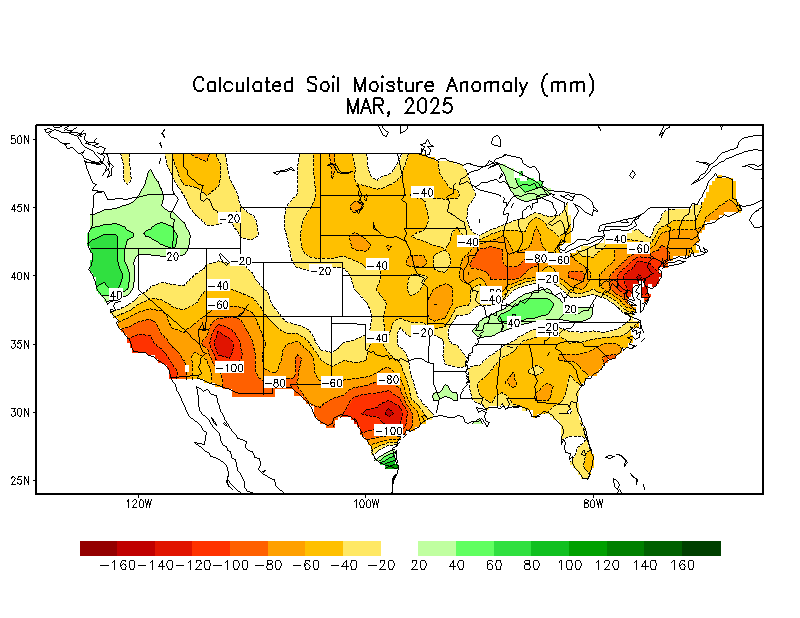 |
|
|
|
|
| Ensemble Mean Soil Moisture Anomaly | |
 |
|
| NDMC Composite Drought Indicator | ||||||||||||||||||||||||||||||||||||||
| Short-Term | Mid-Term | Long-Term | ||||||||||||||||||||||||||||||||||||
 |
 |
 |
||||||||||||||||||||||||||||||||||||
|
||||||||||||||||||||||||||||||||||||||
| Flash Drought Conditions Indicator | ||||||||||||||||||||||||||||||||||||||
 |
||||||||||||||||||||||||||||||||||||||
|
||||||||||||||||||||||||||||||||||||||
| Vegetation Drought Response Index (VegDRI) |
 |
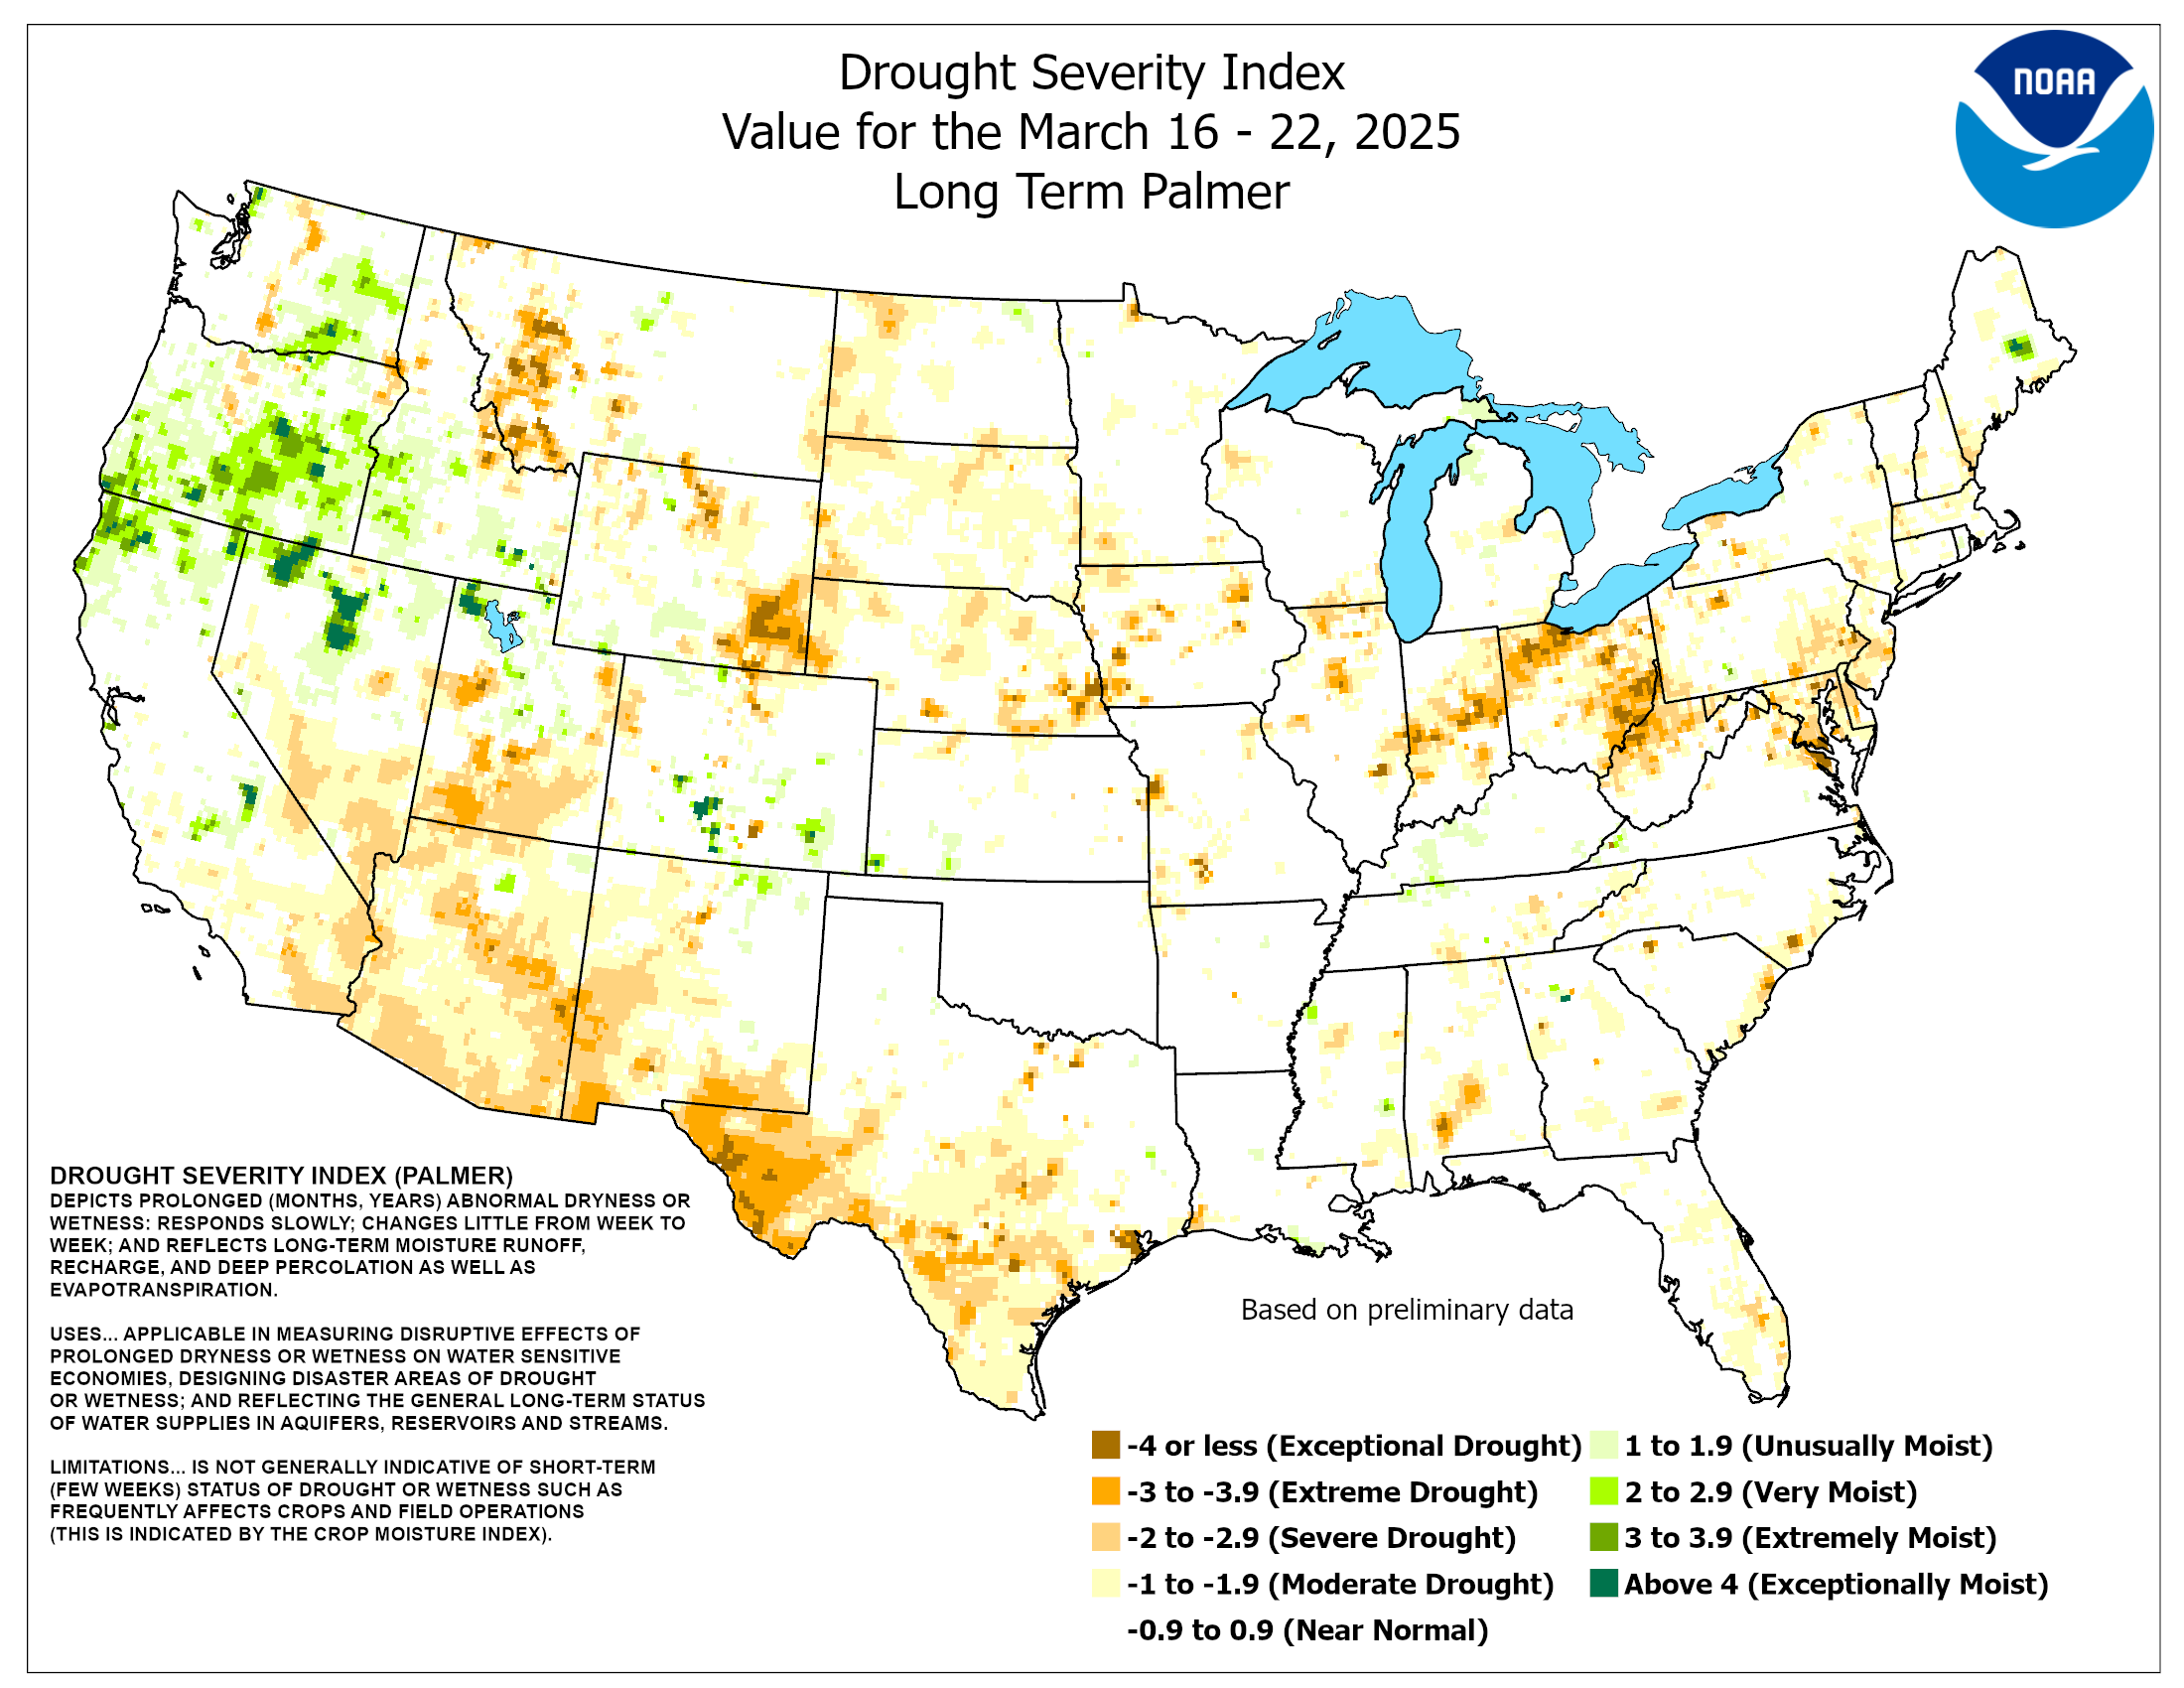
| Palmer Drought Severity Index Definition |
|
| Drought Severity Index (Long Term Palmer) |
Crop Moisture Index |
 |
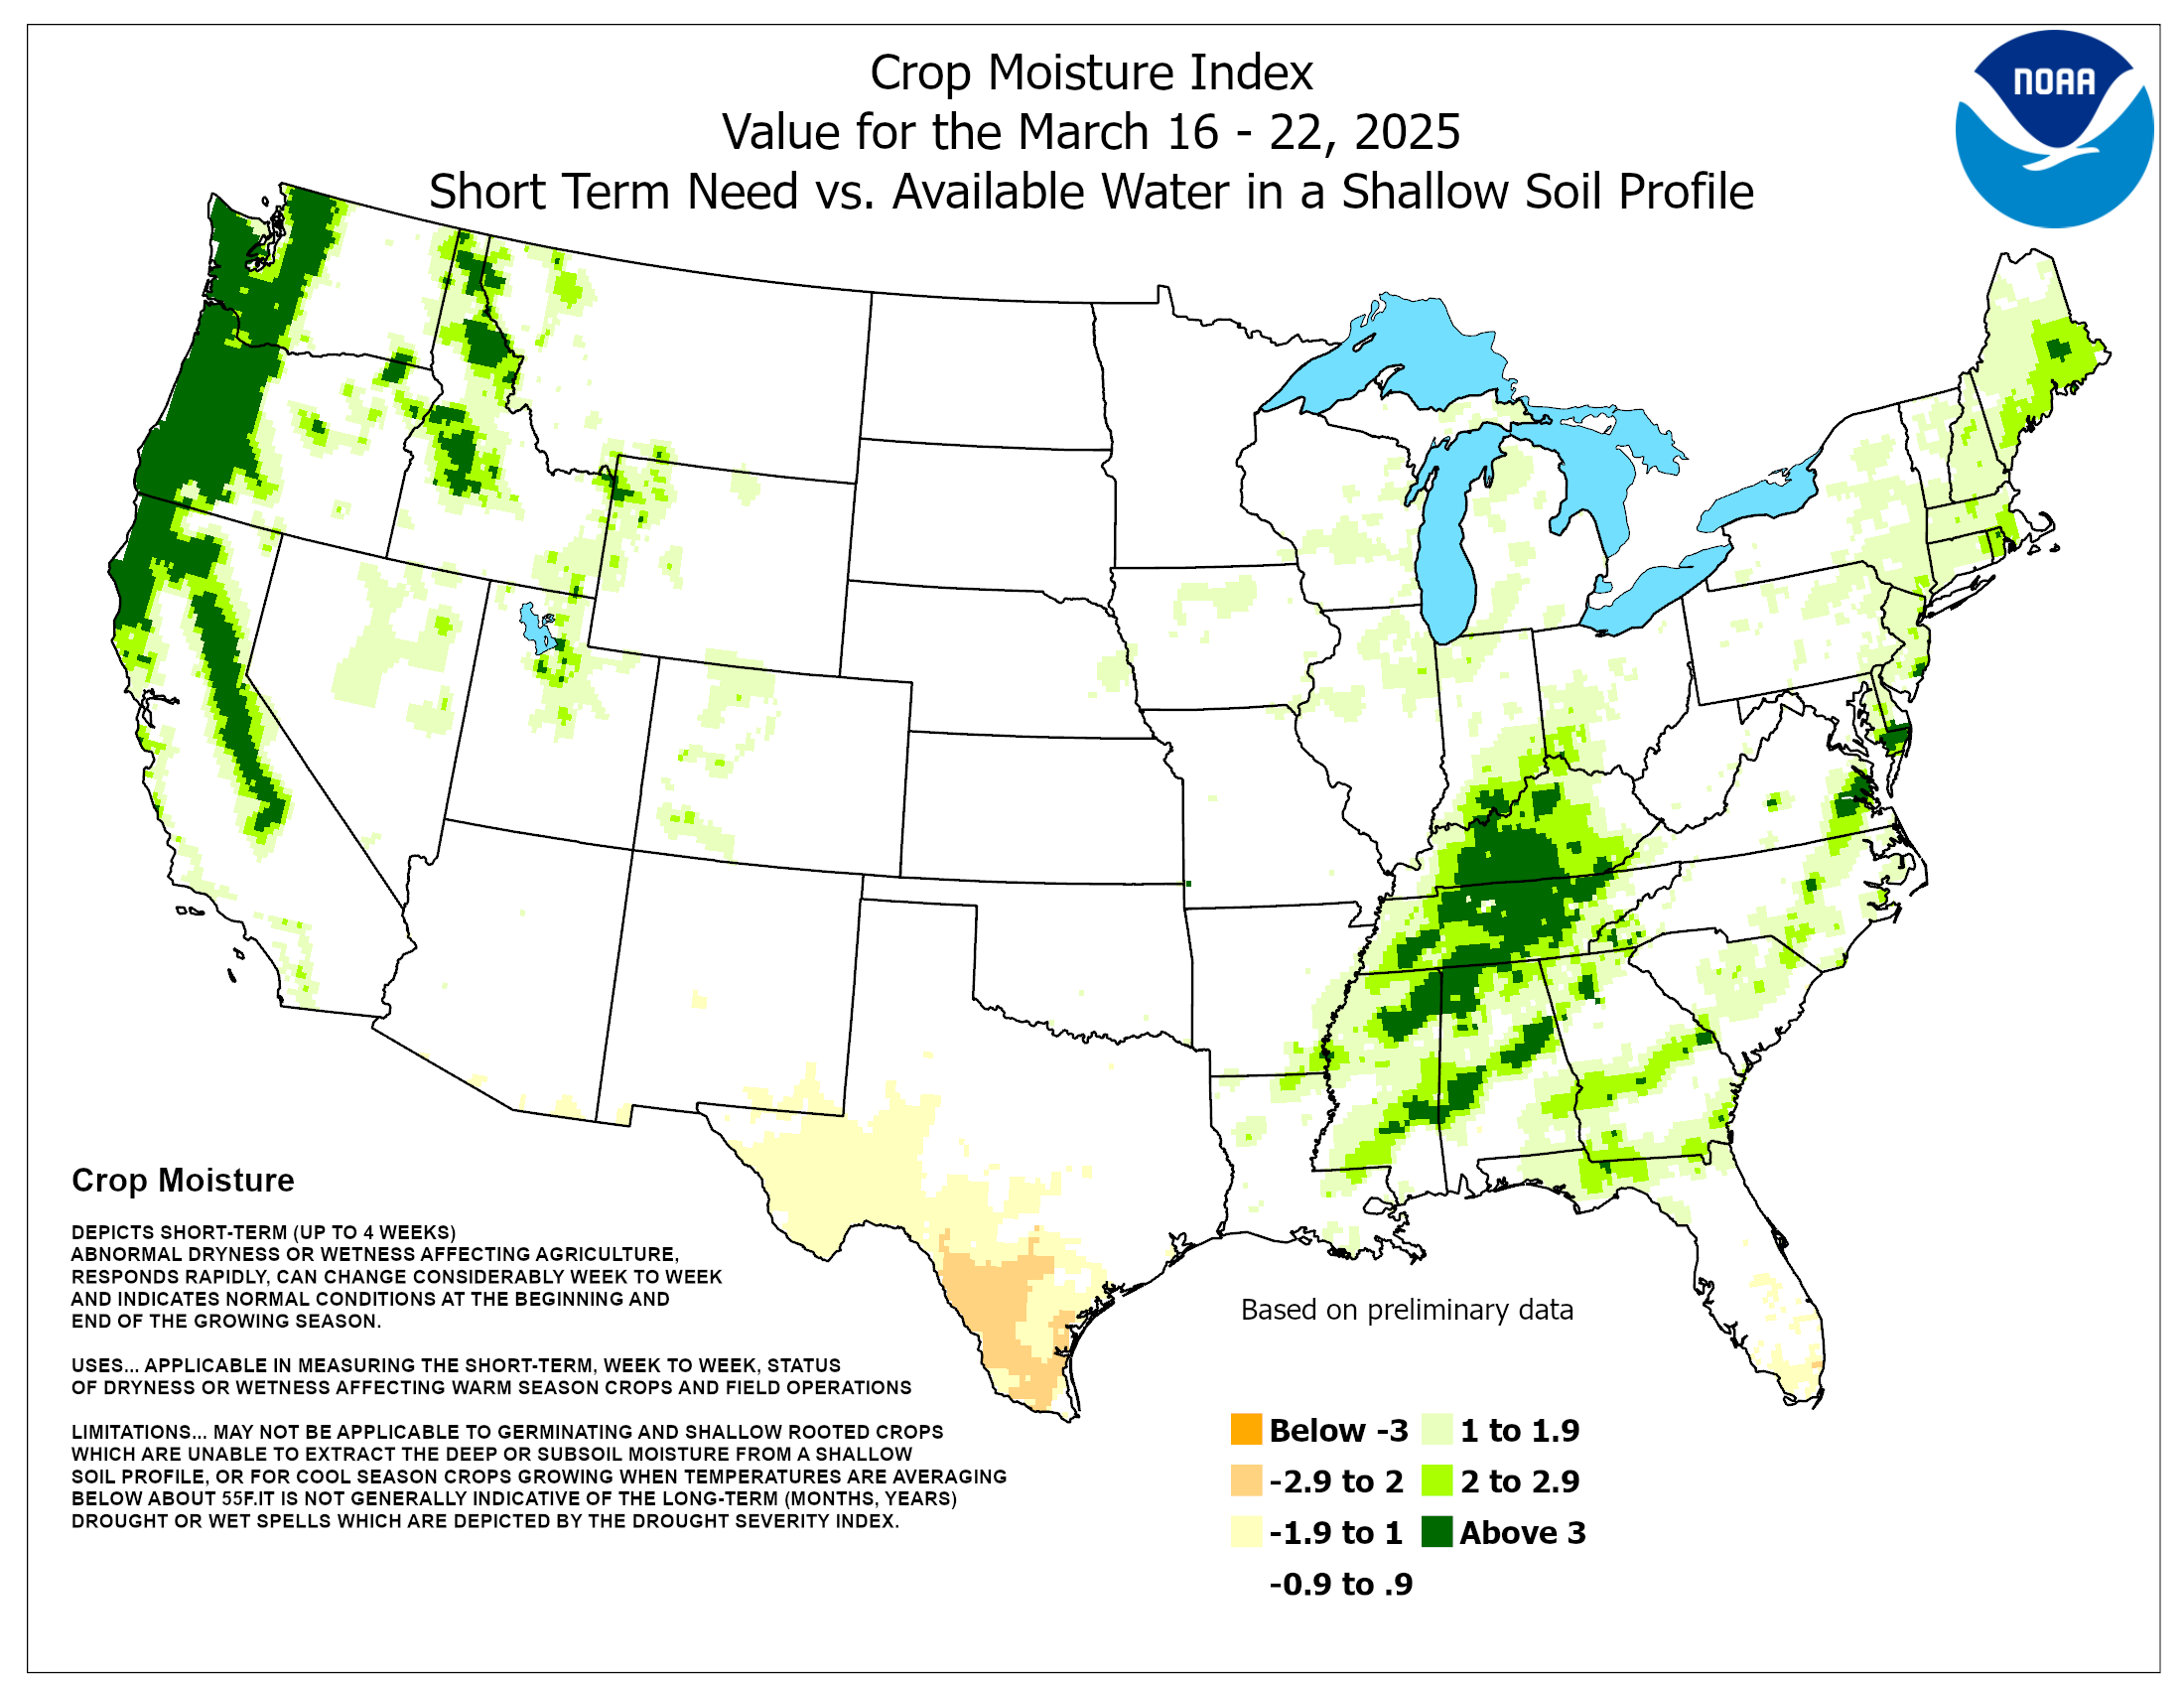 |
Fire Weather
| Michigan Burn Permits |
 |
Michigan Fire Weather Decision Support Dashboards
Lower MI Upper MI
Resources
Water Resources
| USGS Michigan Water Conditions |
 |
Resources
Snow
| NOHRSC Regional Snow Analyses | ||
| Snow Water Equivalent | Snow Depth | Average Snowpack Temp |
 |
 |
 |
|
|
||
| SWE Change | Snow Precipitation | Snow Melt |
 |
 |
 |
|
|
||
| Blowing Snow Sublimation | Surface Sublimation | Non-Snow Precipitation |
 |
 |
 |
| NWS North Central River Forecast Center Modeled Snow Water Equivalent | ||
| Simulated SWE | SWE Percentile | |
 |
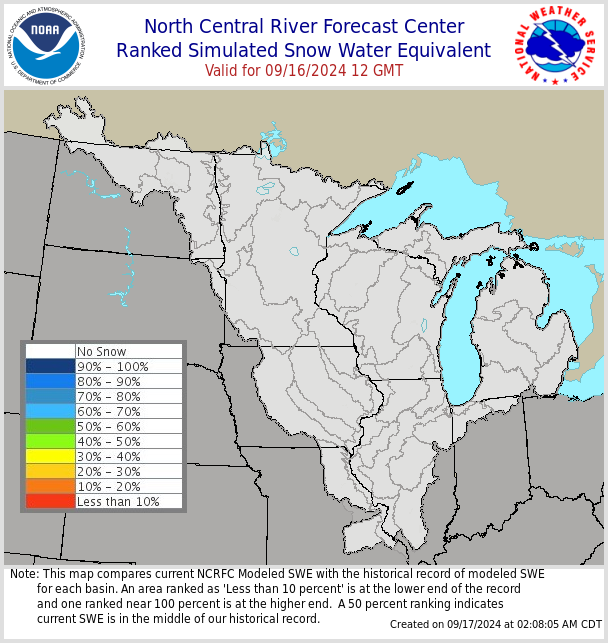 |
|
| MRCC Climate Watch Accumulated Snowfall Percent of Mean | ||
| 7 Day | 30 Day | Seasonal |
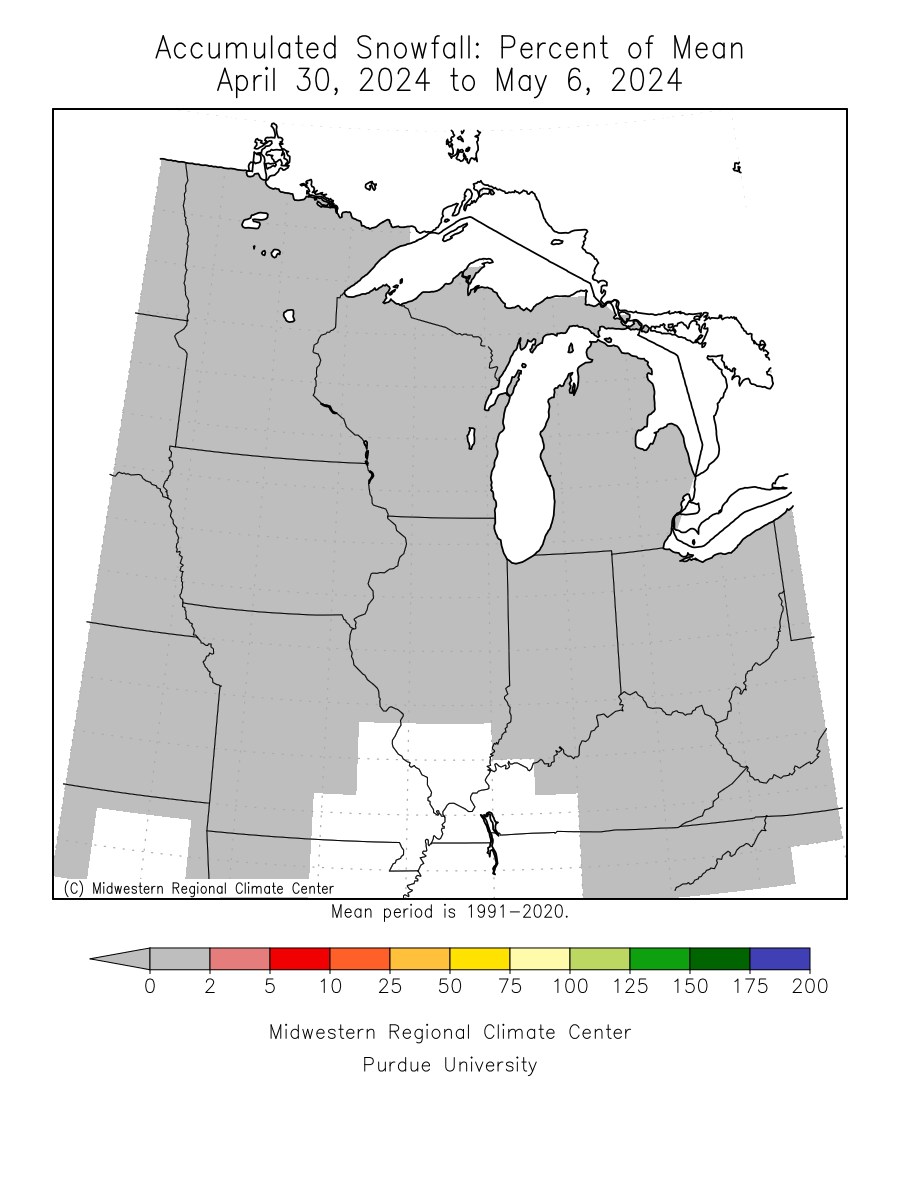 |
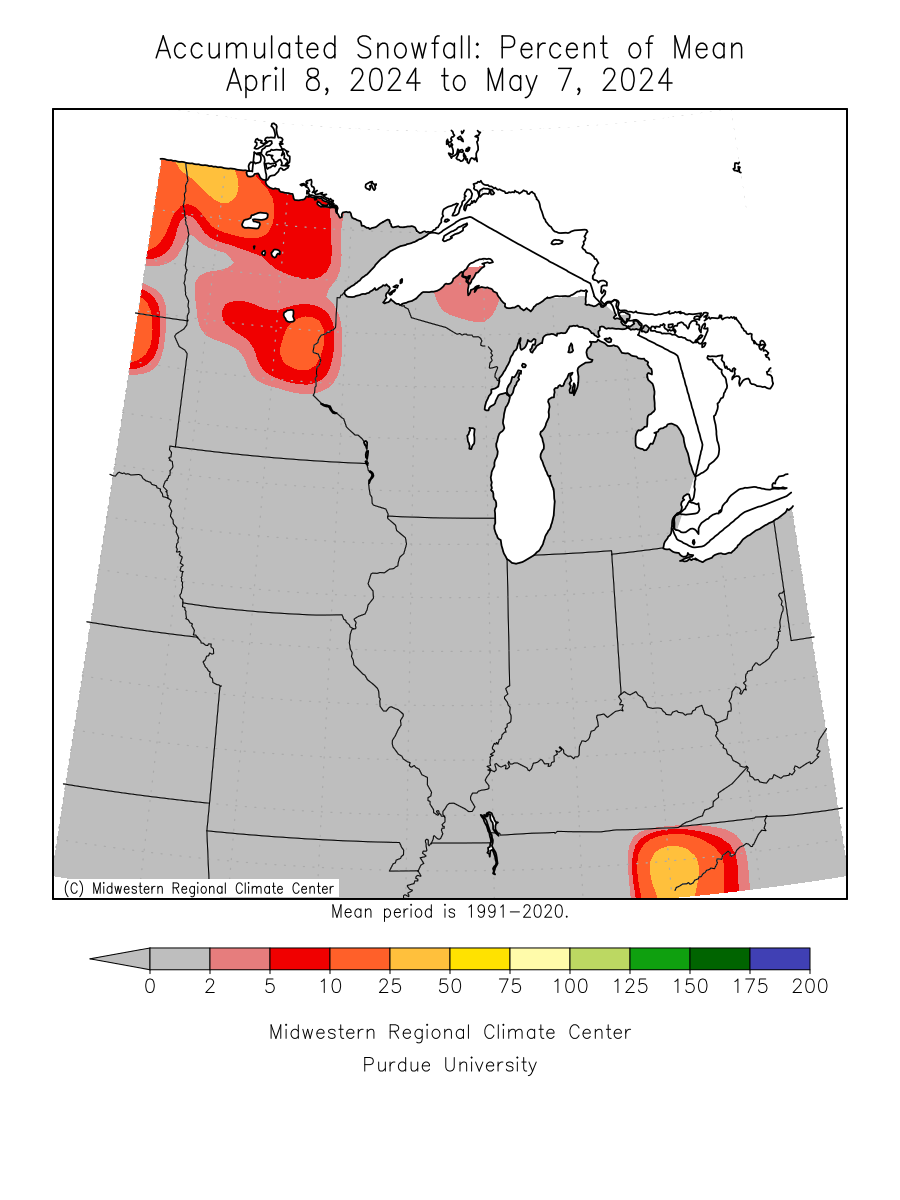 |
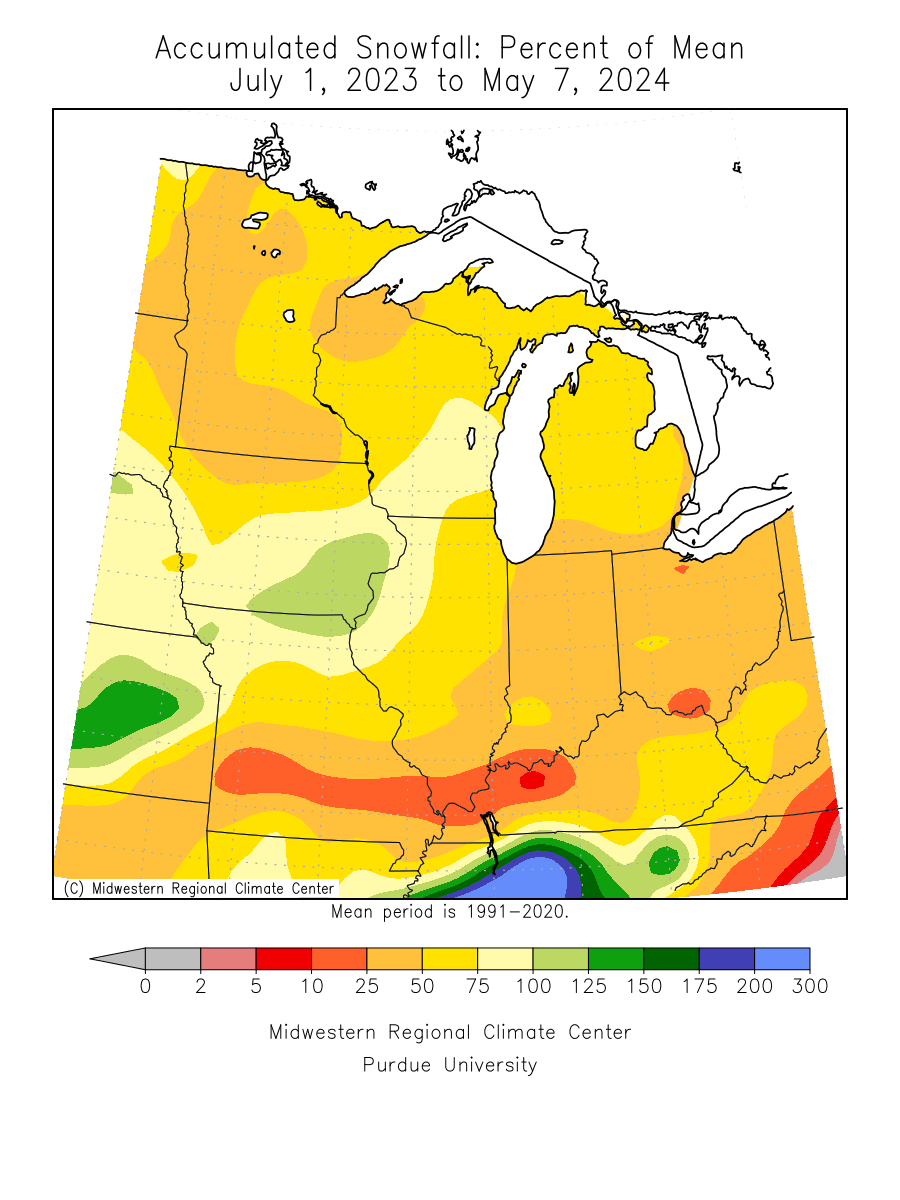 |
Resources
Forecasts & Outlooks
| WPC 7-Day Quantitative Precipitation Forecast (QPF) | |
 |
|
|
|
|
| CPC 6-10 Day Outlooks | |
| Temperature | Precipitation |
 |
 |
|
|
|
| CPC 8-14 Day Outlooks | |
| Temperature | Precipitation |
 |
 |
|
|
|
| CPC Monthly Outlooks | |
| Temperature | Precipitation |
 |
 |
|
|
|
| CPC Seasonal Outlooks | |
| Temperature | Precipitation |
 |
 |
|
|
|
| CPC Drought Outlooks | |
| Monthly | Seasonal |
 |
 |
Resources
Past Droughts
| Notable Droughts Since 2000 | |
| 2003 | 2005 |
 |
 |
|
|
|
| 2007 | 2010 |
 |
 |
|
|
|
| 2012 | 2021 |
 |
 |
Resources
Acknowledgements
Images courtesy of...
  |
 |
 |
| NOAA/NWS | Midwestern Regional Climate Center |
High Plains Regional Climate Center |
 |
 |
 |
| US Geological Survey | National Drought Mitigation Center |
MI Department of Natural Resources |


