This page is based largely on research from Mitchell, Erfani, et al from Desert Research Institute, Reno, NV; and also further research from this author.
Examining the U.S. Desert Southwest Monsoon: A Look at the Onset of, and Climatology of the Monsoon For New Mexico
1. Introduction
The large scale flow pattern of predominantly west to east flow associated with the polar jet stream (either of low or high amplitude character) is generally observed over most of continental United States during the cold season (October through April), and gradually progresses to a lighter, less active flow of the warm season (May through September) as the polar jet stream weakens and recedes north. This causes a general reversal of flow for much of the southern United States as the semi-permanent Bermuda high pressure ridge extends west across much of this area. This eventually leads to a regional phenomena known as the Southwest Monsoon, also named the North American Monsoon (NAM). This is marked at the surface by a persistent thermal surface low or trough usually located over Arizona or southeastern California, while aloft a frequent, but not constant, flow with an easterly to southerly component develops over the Desert Southwest. This upper pattern is formed by the Bermuda high pressure ridge and the secondary high pressure cell within the ridge, often referred to as the North American Monsoon regional high pressure. This overall pattern marks a significant increase in surface dew point temperatures, along with a sharp increase in layered moisture (precipitable water) throughout the lower and middle atmosphere.
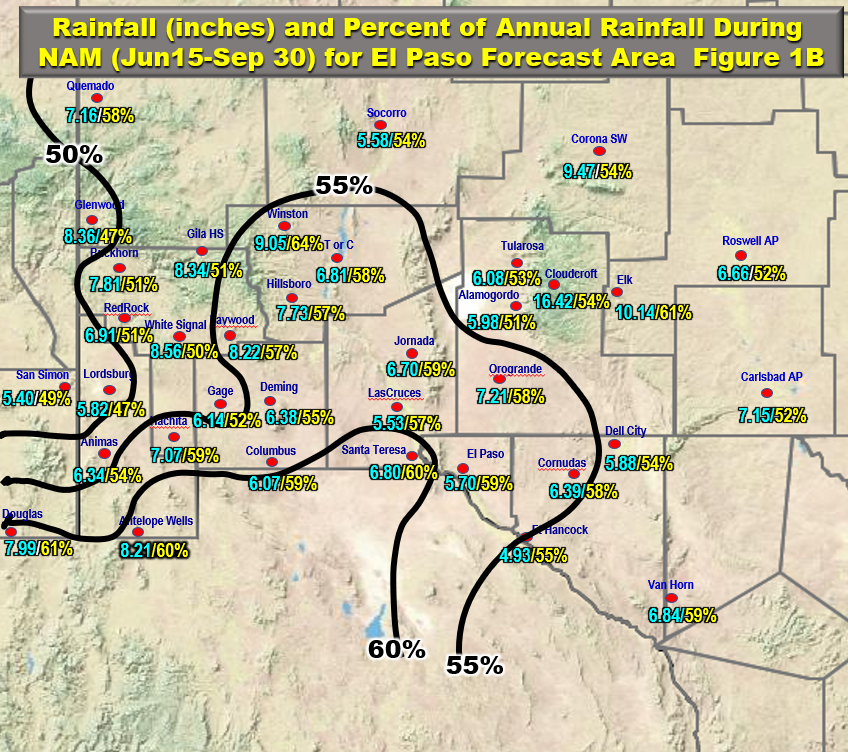
This reversal of seasonal flow is very important to New Mexico, as well as Arizona and even the Mojave Desert of southeastern California and extreme southern Nevada. Most of New Mexico, along with Arizona, receive 40-60% of their annual precipitation totals during the monsoon season (See figs. 1A and 1B). A wet monsoon season often can break up any ongoing drought, while a dry monsoon season can intensify an ongoing drought, or begin a new period of drought. There are of course, drawbacks to a wet monsoon as the summer rains can often lead to flash flooding, which can produce loss of life and extensive property damage.
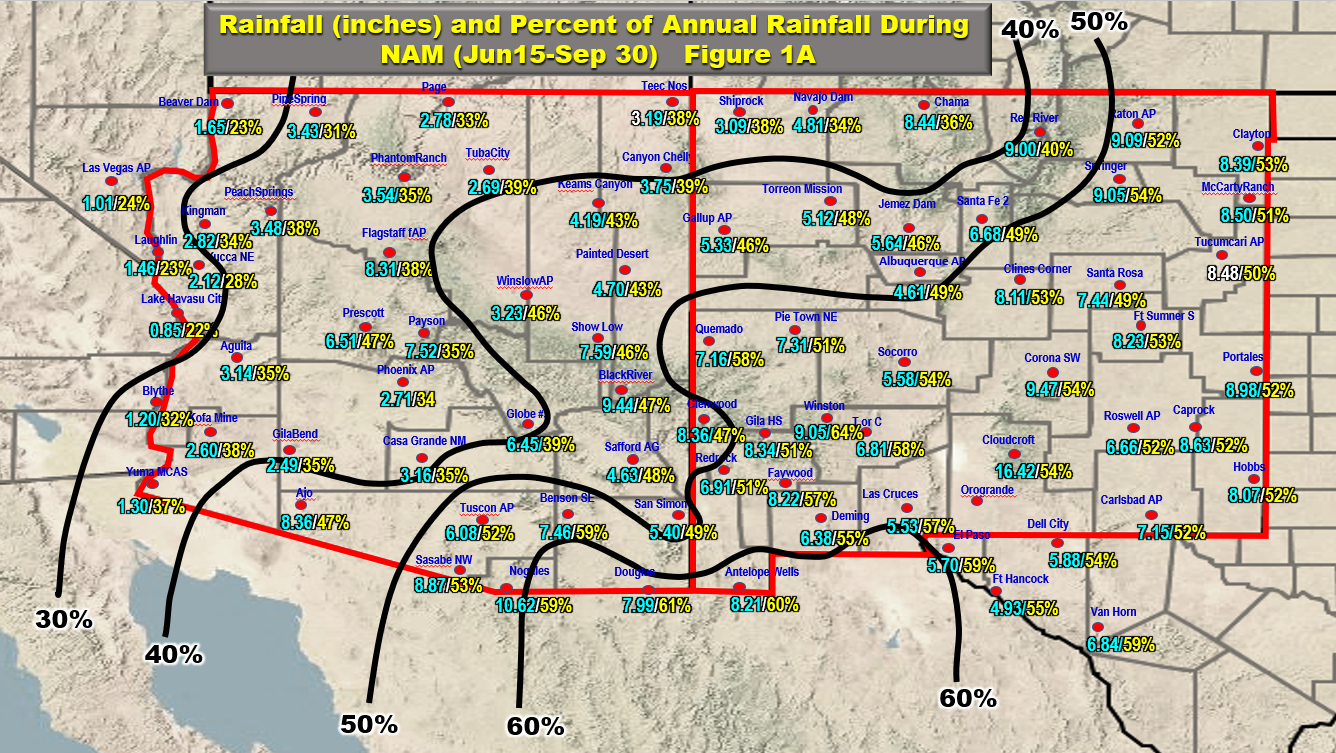
1A
1B
2. Geographical context.
Map below shows area (Northern Gulf region) that is referred to in this presentation.

Map 1
3. Characteristics of the moisture sources of New Mexico
Gulf of California: Lies in a northwest to southeast orientation between the Baja Peninsula and the northwest coast of mainland Mexico (see map above). Its length is roughly 650 miles long on a northwest-southeast axis, while its width varies from about 60 to 120 miles. Water temperatures in the Gulf generally reach their minimum in early to mid February of around 25ºC at the entrance to the Gulf, and around 15ºC at the northern end. The water temperature then begins to slowly increase through March, with the rate of warming accelerating in April and May. The northern zone (see Map 1) sees a very rapid warming, and by early May is typically within a few degrees of the entrance. Maximum temperatures in the Gulf peak from about late July to late September or early October (28-32ºC), and then start to slowly cool. The warming is due mostly to the increased insolation of spring and summer, and also by various coastal currents. This pattern has been found to occur in a similar fashion every year, much like the Monsoon itself. Mitchell, Erfani, et al, have found that the values of 26C and 29C appear to be critical thresholds in the developmental process of the NAM. See Fig 2 for beginning times of these values.
Gulf of Mexico: Bounded on the northern half by the Gulf Coast from Texas to Florida and on the southern half by Cuba and the eastern coast of Mexico (see Map 2). Its east west length is roughly 1000 miles at its widest, and about 500-750 miles north to south. Water temperatures in the Gulf usually reach their minimum in early to mid February of 18-25ºC (cooler adjacent to the coast). Maximum temperatures peak around mid July to mid September (28-31ºC).
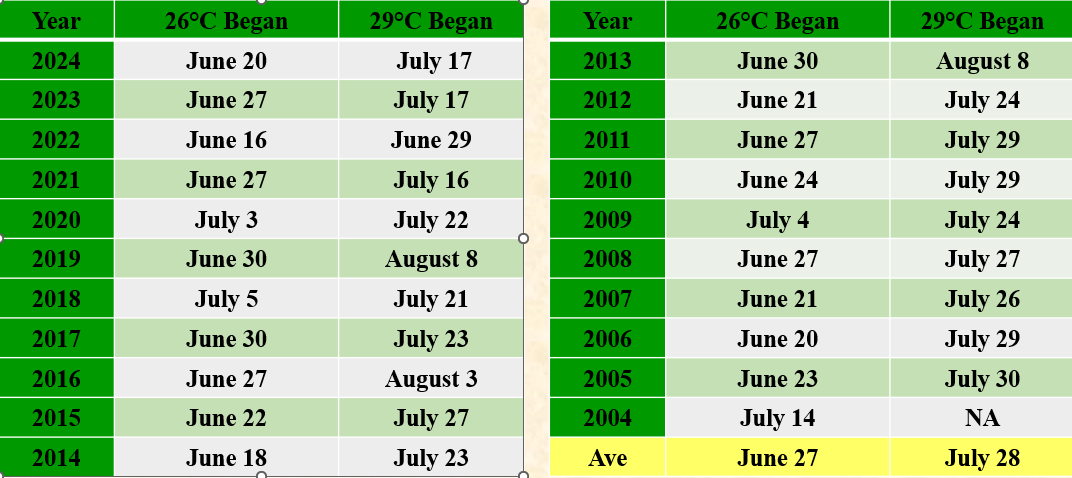
Fig 2
4. Components of the NAM development:
A. Sea Surface Temperature:
The northern GOC, our main area of interest, is the last area of the GOC to warm up. In the spring it is usually 3-5C colder than the southern zone and lags about one month behind in warming up. By late April it finally begins catching up with the remainder of the Gulf and typically experiences a rapid warm up through May as the warm waters to the south surge northward. M2002 showed that there is a strong correlation between certain SST’s in the northern GOC and the onset of the Monsoon rainfall. Specifically, they found that when the water temperature reaches 26ºC, convection and rainfall generally begin over Arizona about 3-14 days afterward. Other researchers (Zang 1993) have reported that 26C is a good threshold for deep convection in the tropics. The northern GOC finally warms toward this threshold in June and typically reaches it by the last week of June or the first week of July. Mitchel, et al, also showed a distinct correlation between Monsoon rainfall upon northern GOC reaching a temperature of 29°C for Arizona/New Mexico. It was found on average that 70% of the annual Monsoon rainfall fell after the 29C over the northern GOC was reached. Furthermore, it was found that rainfall rates dramatically increased from around .02 inch/day to .06-.09 inch/day.
B. Surface and low level:
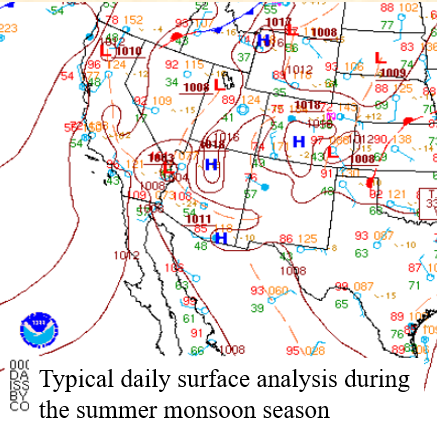
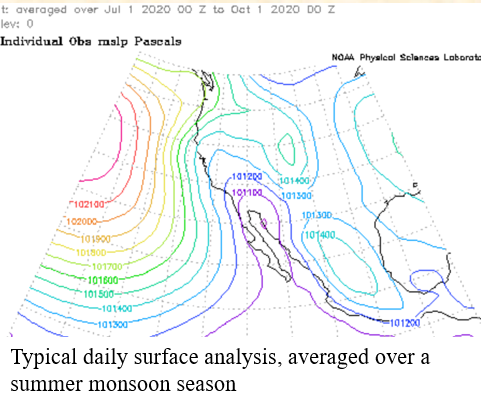
Sea level pressure pattern is an important ingredient of the Monsoon season. A semi-permanent thermal low pressure center or trough develops over the area of far southern Nevada, southeast California and western Arizona. This allows a broad east or southeast flow at the surface and low levels across New Mexico to transport Gulf of Mexico moisture in. Unfortunately, it is not a good predictor of the Monsoon onset, as the low/trough begins forming in May and June as surface temperatures increase across the Desert Southwest.
C. Outgoing Longwave Radiation (OLR):
Measured by satellite and can be used by proxy for deep convection in the Tropics. Convection produces extensive cirrus anvil clouds that emit relatively cold temperatures. This corresponds to lower OLR values and thus can show where convection is likely occurring. Zhang (1993) found that OLR <240 W m2 appear to be associated with dense cirrus anvil clouds and deep convection in the tropics. We can use OLR fields to trace the northward propagation of the convection toward New Mexico. Since convection usually develops shortly after the Monsoon pattern develops,OLR would be a trailing indicator of the Monsoon beginning. Both the warming of the GOC SST and cool OLR field propagate northward with the length of the season. See Fig. 3.
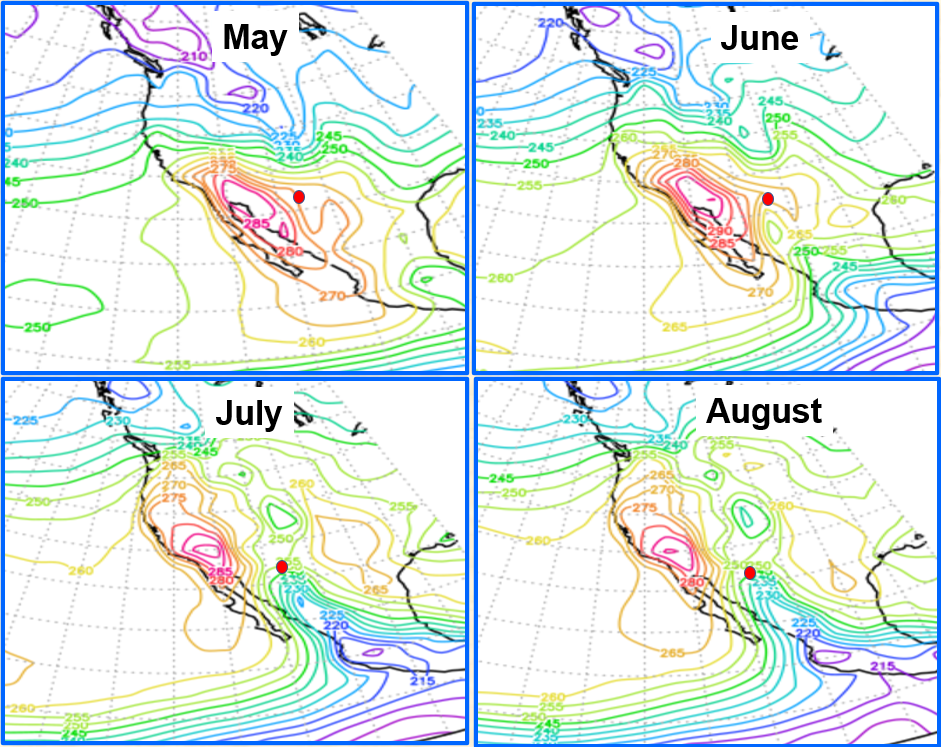
Fig 3
D. Upper air flow and heights:
This study looked at both 500mb and 250mb constant pressure levels. From Figs. 5a and 5b, you can see the upper level height increases propagate northward in a similar manner to OLR and SST. By early June the NAM high pressure center is typically over the Sonoran Desert of northern Mexico. Then by July the center sits over Arizona and New Mexico where it will usually sit through the end of August and beginning of September, though it will frequently wander around the Four Corners states, plus Nevada, California, and Texas. The position of this NAM high pressure center is critical for the distribution of Monsoon rainfall. Though the maps show the mean 500mb high over the Four Corners’ states and Texas, the NAM high will migrate on a daily and weekly basis around this area. If the high centers right over New Mexico, the associated subsidence cap usually inhibits all convection other than a few thunderstorms over higher terrain. If the high centers east of the area over eastern Texas then tropical moisture is allowed northward over the area and dense convection is likely. See Figs 4, 5, 6.
500mb mean flow
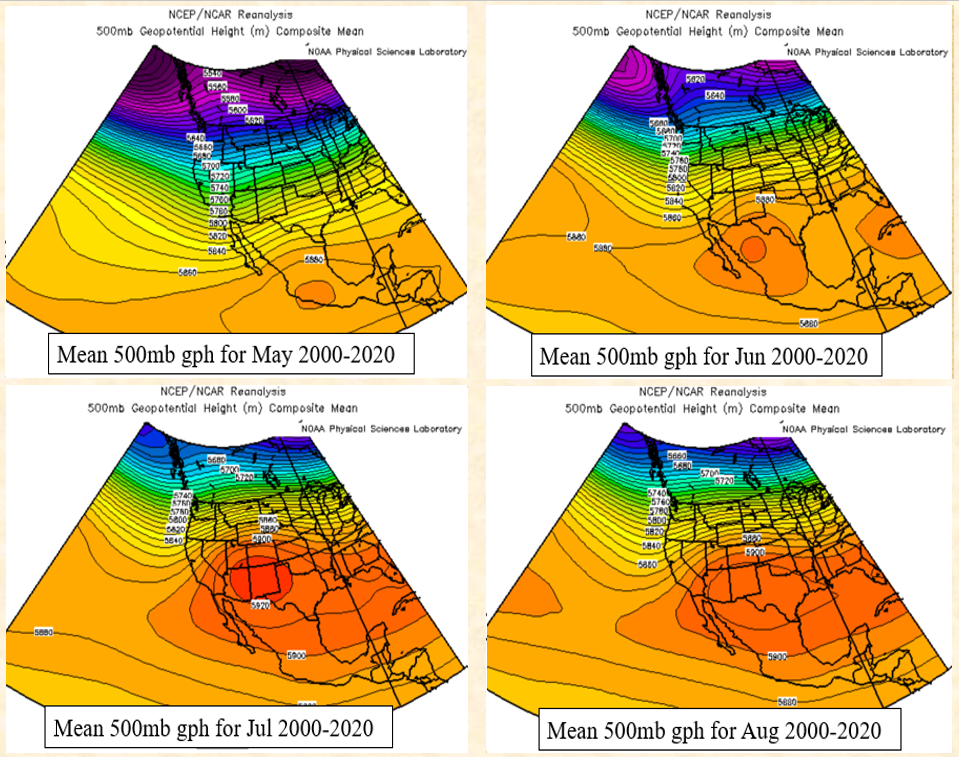 Fig 4
Fig 4
250mb mean flow
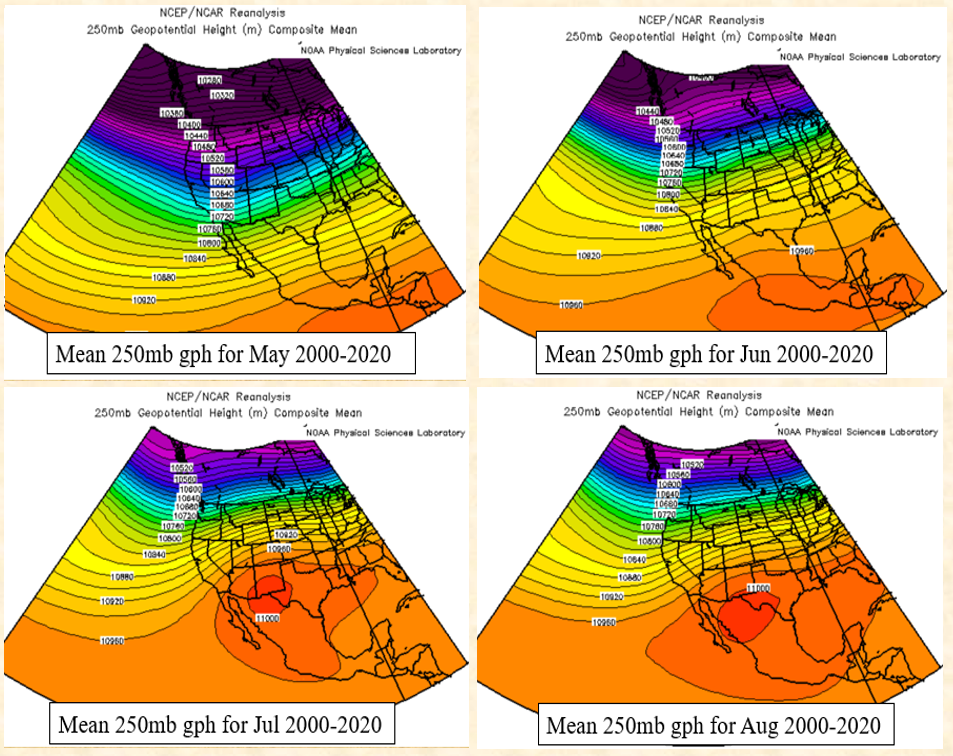 Fig 5
Fig 5
Favorable/not favorable areas for the upper high
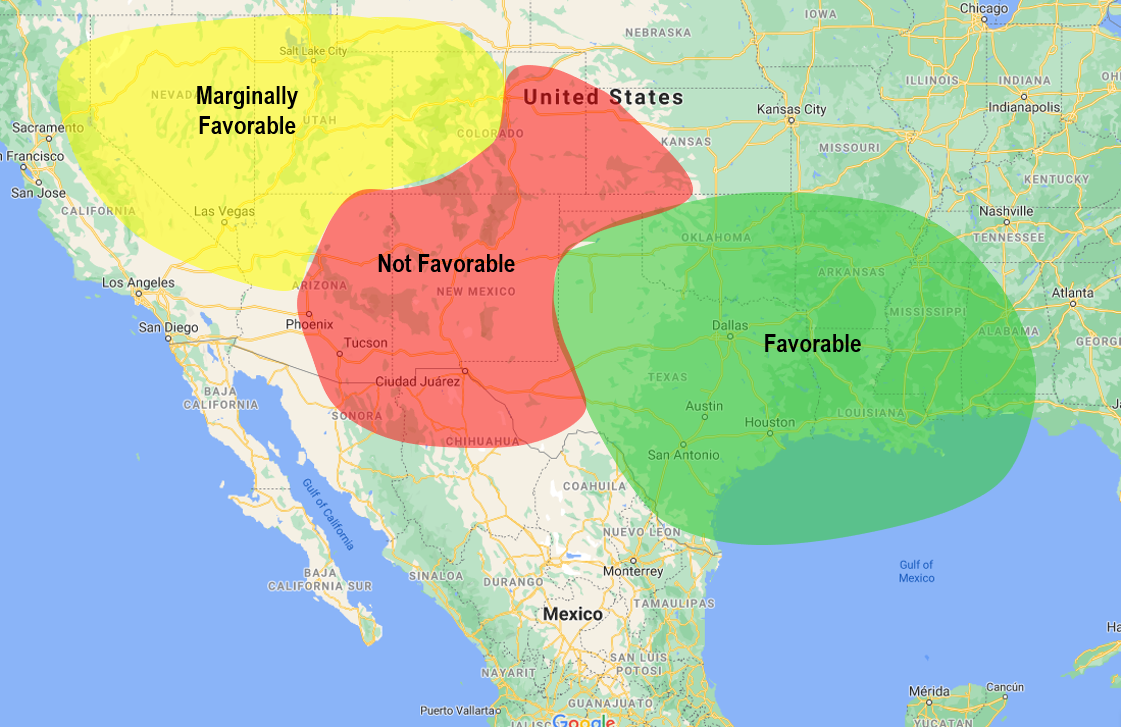 Fig 6
Fig 6



 Follow us on X
 Follow us on Facebook
 Follow us on YouTube
 EPZ RSS Feed