


×
FAQs:- 1. To provide feedback on this website, you may send email to the following addresses:
- Northern Maine - carwebmaster@noaa.gov
Southern Maine and New Hampshire - gyx.webmaster@noaa.gov
Massachusetts, Rhode Island - box.webmaster@noaa.gov
Connecticut, New York - okx.webmaster@noaa.gov
New Jersey, Delaware - phi.webmaster@noaa.gov
Eastern Chesapeake Coast, and Virginia -akq.webmaster@noaa.gov
Western Chesapeake Coast, DC, and Virginia - lwx.webmaster@noaa.gov
Northern North Carolina Coastlines - wxobs.mhx@noaa.gov
Northern South Carolina and Southern North Carolina Coast -ilm.webmaster@noaa.gov
Northern Georgia and Southern South Carolina Coast - nws.charlestonsc@noaa.gov - 2. How are these forecasts made?
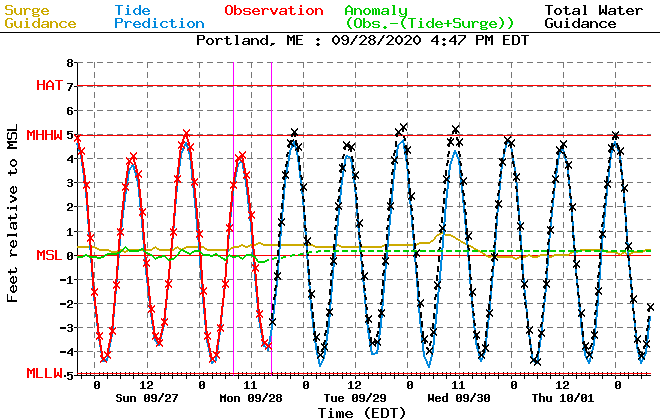
- The forecaster uses computer model guidance, climatology, and bias calculations, along with their understanding of the complex interactions of tides, waves, weather, and water levels to make these forecasts.
- 3. Why are some locations always "grayed" out?
- The colors indicate forecast flood categories for the chosen tide cycle (slider bar in upper left). The colors are dependent on the weather offices sending the "table” information below the hydrograph. For some locations the tables are not provided due to a variety of factors:
- Forecasting knowledge is still under development
- Occasionally, the forecast high tide time is already past the current time
- A few locations are considered “river forecasts” but are also tidal in nature; these locations will never have forecast tables.
- 4. How were the Potential Coast Flood Extent Layers created?
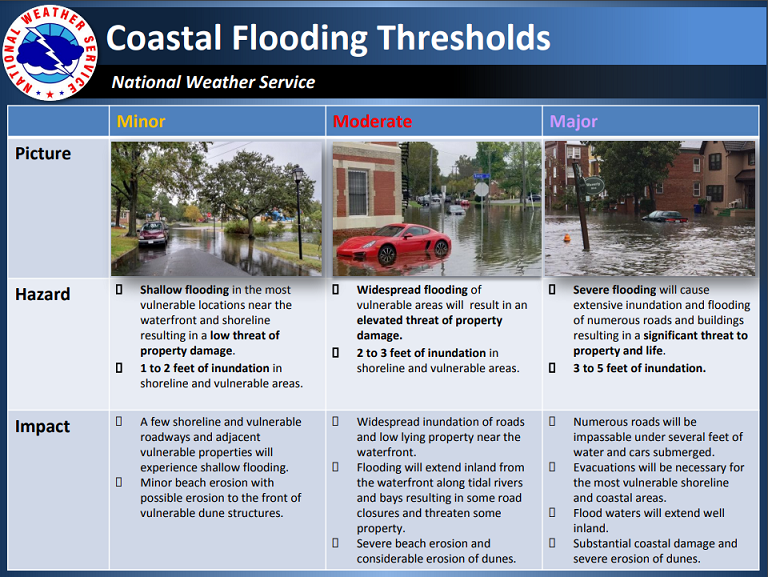
- The National Weather Forecast offices have created the impact-based flood categories for individual tide gauge locations in collaboration with local Emergency Managers and other local officials. The impact categories represent the threat to the community based on the flooding of roads, infrastructure, businesses and homes resulting in a threat to property and life. For the Potential Coast Flood Extent Layers, the NWS collaborated with the NOAA "Digital Coast" staff who are the agency experts in digital elevations and geospatial analysis methods. NOAA “Digital Coast” applied their methodologies of depicting inundation applying them to the NWS flood thresholds creating these potential flood impact layers.
These flood category- based layers can be used in conjunction with NWS forecasts (either from coastal flood warnings and/or tide gauge forecasts from this web page). Note: The flood category thresholds and extent layers are representative of expected average of conditions based on the water level only. Other factors such as waves, winds, rainfall, and winter/ice conditions can create inland extents of flooding beyond what are depicted in these layers. The layers do not depict water depth.
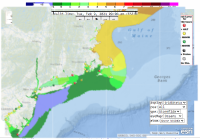
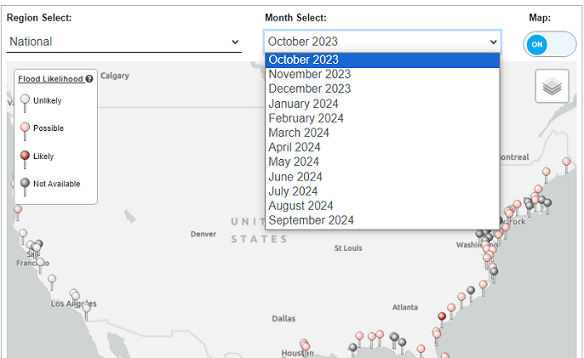
Coastal Flood Threat Display
Selected View:
- Coastal Hazard Map
- Water Level Quicklook
- Inundation and Impact Resources
- Local Resources
- Forecast Display
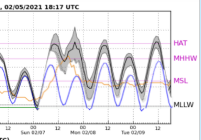
High Tide Cycle


X
popup
Coastal Hazard Overlays
Loading...
Data Overlays
Observed Wave Height
Forecasts and Observations
 Forecast and Observations available
 Observations only
 Forecast table only
Observed Wave Height
Forecasts and Observations
Flood categories provided by NWS forecast tables below graphs - Select tide cycle in upper left.
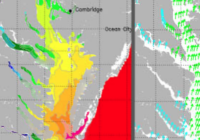
Major Flooding
Moderate Flooding
Minor Flooding
No Flooding
No forecast this cycle
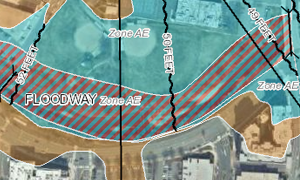
Experimental Potential Coastal Flood Extent Maps (How to use this information?)
Low-lying Areas Low-lying areas are hydrologically "unconnected" areas that may also flood." Minor Extent Represents the potential inland extent of flood waters during Minor flooding. Map does not represent water depth. Water depth will vary within the highlighted area. Moderate Extent Represents the potential inland extent of flood waters during Moderate flooding. Map does not represent water depth. Water depth will vary within the highlighted area. Major Extent Represents the potential inland extent of flood waters during Major flooding. Map does not represent water depth. Water depth will vary within the highlighted area. Major +1 Ft Extent Represents the potential inland extent of flood waters when water levels are 1 ft above the start of Major flooding. Map does not represent water depth. Water depth will vary within the highlighted area. Major +2 Ft Extent Represents the potential inland extent of flood waters when water levels are 2 ft above the start of Major flooding. Map does not represent water depth. Water depth will vary within the highlighted area. Major +3 Ft Extent Represents the potential inland extent of flood waters when water levels are 3 ft above the start of Major flooding. Map does not represent water depth. Water depth will vary within the highlighted area.
Low-lying Areas Low-lying areas are hydrologically "unconnected" areas that may also flood." Minor Extent Represents the potential inland extent of flood waters during Minor flooding. Map does not represent water depth. Water depth will vary within the highlighted area. Moderate Extent Represents the potential inland extent of flood waters during Moderate flooding. Map does not represent water depth. Water depth will vary within the highlighted area. Major Extent Represents the potential inland extent of flood waters during Major flooding. Map does not represent water depth. Water depth will vary within the highlighted area. Major +1 Ft Extent Represents the potential inland extent of flood waters when water levels are 1 ft above the start of Major flooding. Map does not represent water depth. Water depth will vary within the highlighted area. Major +2 Ft Extent Represents the potential inland extent of flood waters when water levels are 2 ft above the start of Major flooding. Map does not represent water depth. Water depth will vary within the highlighted area. Major +3 Ft Extent Represents the potential inland extent of flood waters when water levels are 3 ft above the start of Major flooding. Map does not represent water depth. Water depth will vary within the highlighted area.
Opacity
Note:The potential coastal flood extent overlays illustrate the extent of potential stillwater flooding at a flood category threshold, not the depth. The layers do not account for the effects of wind, rainfall, wave action, erosion, subsidence, or future construction.
Federal Inundation and Impact Resources
 |
FEMA Flood MapsFEMA flood map service is the official public source for flood hazard information produced in support of the National Flood Insurance Program. |
 |
NOAA Sea Level Rise ViewerProvides depictions of sea level rise and potential coastal flooding impact areas. |
 |
NOAA’s Coastal Flood Exposure MapperHelps to start your community discussions about hazard impacts with maps of your area that show people, places, and natural resources exposed to coastal flooding. |
 |
NOAA Sea Level Calculator.Explore how sea levels and coastal flooding have changed in frequency and magnitude for your chosen location. |
Federal Coastal Flood Model Guidance
| Note: Model guidance does not provide estimates of the entire water level at the coast. Actual water levels for a coastal flooding event may vary due to factors such as rainfall and wave action. Please see Coastal Hazard Map for official National Weather Service forecasts. | |||
 |
ETSS Storm Surge ModelThis product is experimental total water level model guidance for tide gauges. Water level guidance is for extra-tropical storms. |
 |
PETSS Storm Surge ModelThis product is experimental total water level probabilistic model guidance for tide gauges. Water level guidance is for extra-tropical storms. |
 |
ESTOFS Storm Surge ModelThis product is experimental total water level model guidance for tide gauges. Water level guidance is for extra-tropical storms. |
 |
NOS Regional OFS Modelsperform nowcast and short-term (0 hr. - 48 hr.) forecast predictions of pertinent parameters (e.g., water levels, currents, salinity, temperature, waves) and provides them to users. |
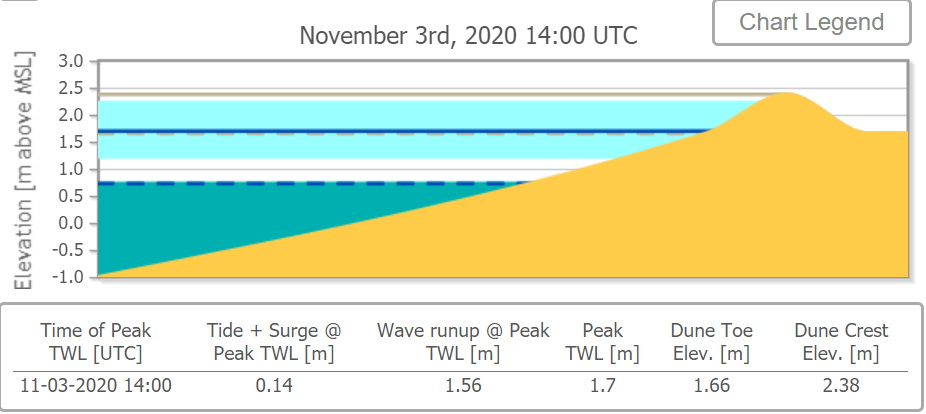 |
USGS Total Water Level & Coastal Change Forecast ViewerTool displays total water level forecasts and coastal change predictions along the U.S. coastline using local beach characteristics. This tool graphically displays dune erosion/overtopping potential. |
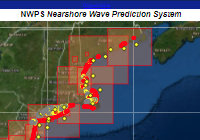 |
Nearshore Wave Prediction System (NWPS)provides high-resolution nearshore wave model information using WFOs forecast wind grids. |
Other Coastal Resources
 |
NOS Tides & CurrentsHomepage to numerous coastal water level resources. |
 |
NOS Sea Level & Coastal Flooding InformationHomepage to national source for coastal inundation data and sea level trends. |
.PNG) |
USGS Coastal Change Hazards ViewerFind information on extreme storms and coastline changes. |
 |
Monthly High Tide Flooding OutlookThe Monthly High Tide Flooding Outlook shows when and where above-normal high tides and high tide flooding may be experienced. |