Overview
|
Updated 2/27/19 An intense winter storm developed over the southern Plains and rapidly intensified as it moved northeast into Wisconsin the night of Saturday, February 23 into Sunday, February 24. As the storm system approached Wisconsin on Saturday evening, a widespread area of heavy mixed precipitation moved in from the southwest, initially producing widespread rain, freezing rain, sleet and eventually heavy snow. Freezing rain produced glaze up to a 1/2 inch over parts of central Wisconsin causing numerous power outages by early Sunday morning. The mixed precipitation quickly changed over to heavy snow across much of central and northern Wisconsin shortly after midnight and continued through mid-morning Sunday producing a broad swath of 10 to 16 inches of snow. As the surface low began to depart the area Sunday morning, it continued to rapidly intensify. This resulted in very strong westerly winds gusting to 50 to 60 mph, producing widespread blowing and drifting snow and whiteout conditions which continued throughout the day on Sunday. The blizzard conditions were most prevalent over central and northern Wisconsin where the heaviest snow fell. Travel on most roads across the forecast area, especially west of the Fox Valley was not recommended (see map to right). Across east-central Wisconsin and the Fox Valley where considerably less snow fell, the strong westerly winds produced occasional whiteout conditions in open areas on north-south roads including interstates I-43 and I-41, creating treacherous travel conditions. Shortly after 11 am on February 24, a motorist was killed and 71 others injured in a 131 vehicle pileup on I-41 near Neenah. The traffic crash is thought to be the largest in state history. As the system continued to move away from Wisconsin Sunday night, it ushered in very cold arctic air. By the morning commute on Monday, the combination of cold temperatures and strong westerly winds produced wind chills from 20 to 30 below zero. |
|
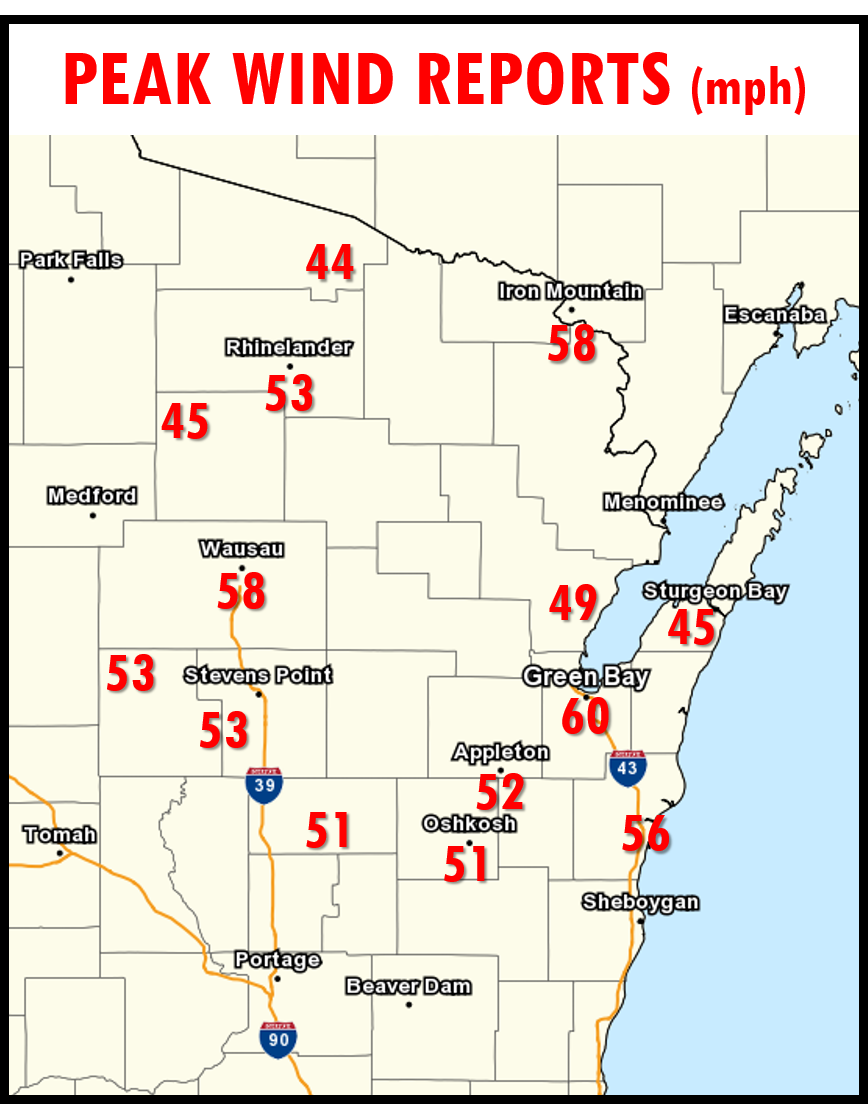
Peak Wind Gusts
During the morning of Sunday February 24, 2019, westerly winds increased rapidly across the entire forecast area as departing surface low pressure system continued to intensify. Wind gusts reported during the day on Sunday generally ranged from 50 to 60 mph. Although the snow had pretty much ended by mid-morning Sunday, the strong winds created considerable, widespread blowing and drifting snow and blizzard conditions especially in open areas. North-south roads across the forecast area were most vulnerable to white-out conditions with the strong westerly winds. The strong winds continued well into the evening hours.
.png) |
 |
||
| Peak Wind Reports During Winter Storm | Wind Reports of Airports Only |
|
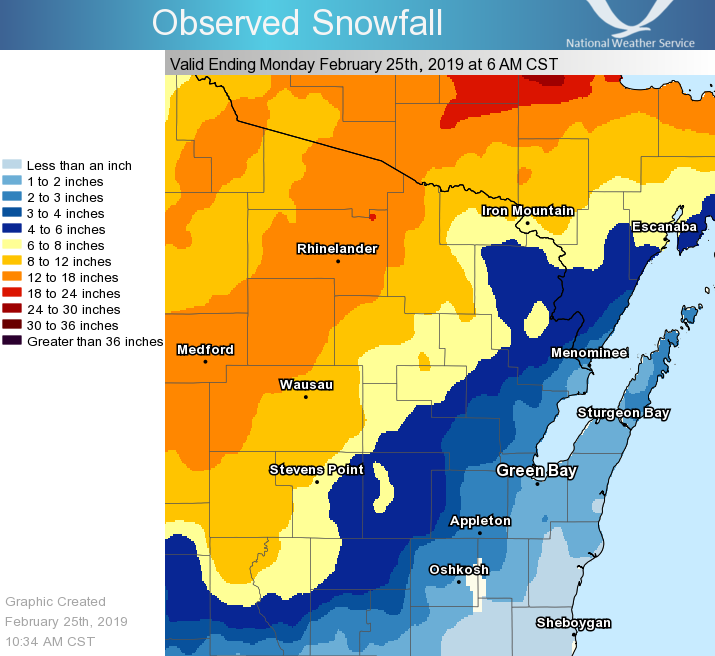
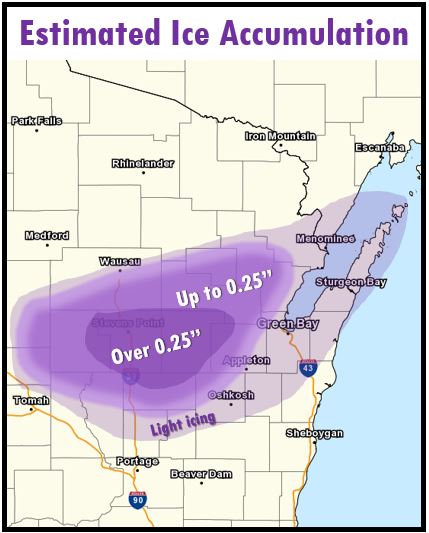
Estimated Storm Total Snowfall And Ice Accumulation
As the winter storm approached the forecast area from the southwest on Saturday evening, there was enough warm air aloft initially, such that the precipitation fell as rain, freezing rain and some sleet before changing to heavy snow. The most significant ice accumulations on Saturday evening occurred west of the Fox Valley, across parts of Wood, Portage, Waupaca and Waushara counties where numerous power outages were reported. Up to 4500 residence were reported to be without power in Portage and Waupaca counties alone. Lighter ice accumulations extended northeast across the northern Fox Valley into Door county. Right around midnight Sunday morning, the mixed precipitation rapidly changed to snow over central Wisconsin. In fact after receiving nearly a half inch of ice accretion earlier in the night, the city of Plover (Portage County) reported heavy snow that was falling at a rate of nearly 2 inched per hour! Between midnight and 4 am Sunday morning, Plover received nearly a half foot of snow! Heavy snowfall quickly expanded northeast across central and northern Wisconsin with a swath of 10 to 16 inches of snow on the ground by early Sunday afternoon.
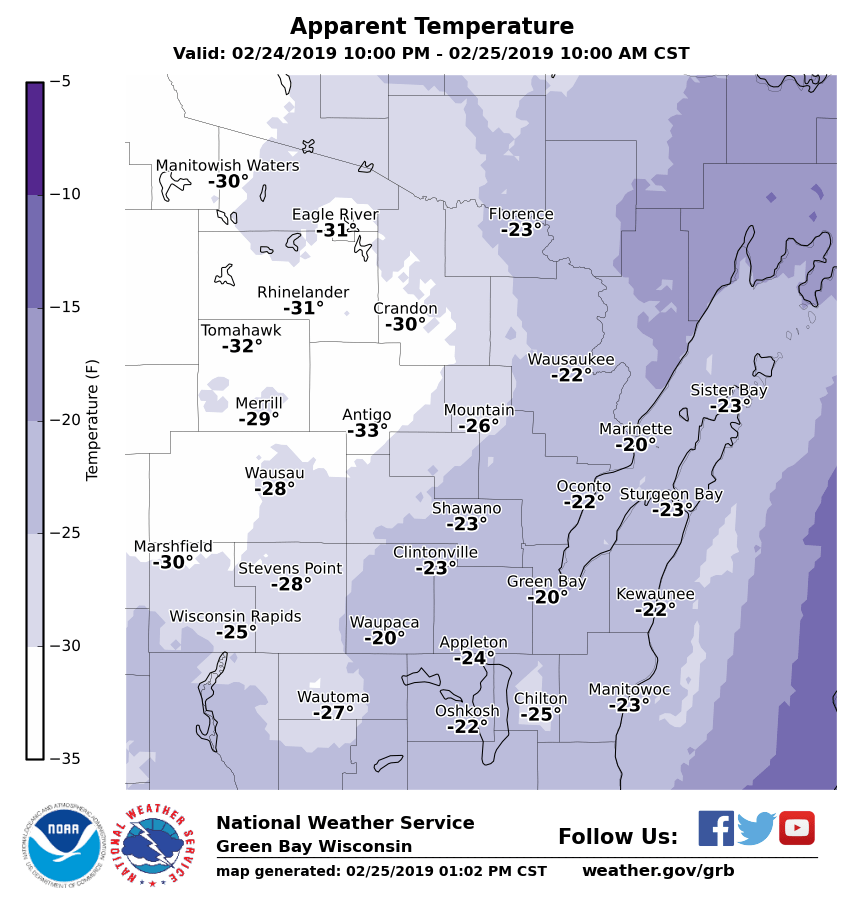
As the storm continued to depart Sunday night, it ushered in much colder arctic air to start out the work week. By the time folks were off to work and school Monday morning, the combination of cold temperatures and strong winds combined to produce wind chills from 20 to 30 below zero (see below). Roads conditions remained very hazardous Monday morning as drifting snow continued and standing water quickly froze overnight on area roads, sidewalks and parking lots. Unfortunately, more accidents were reported on area roads during the Monday morning commute.
Photos
 |
 |
 |
 |
|
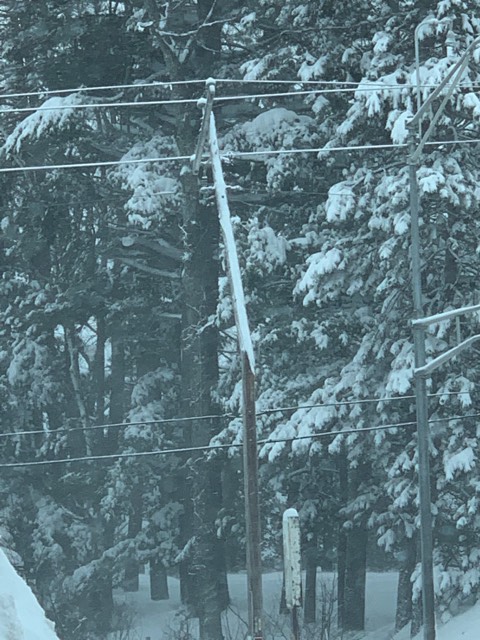
Snapped power pole. Courtesy Trevor Rodman |
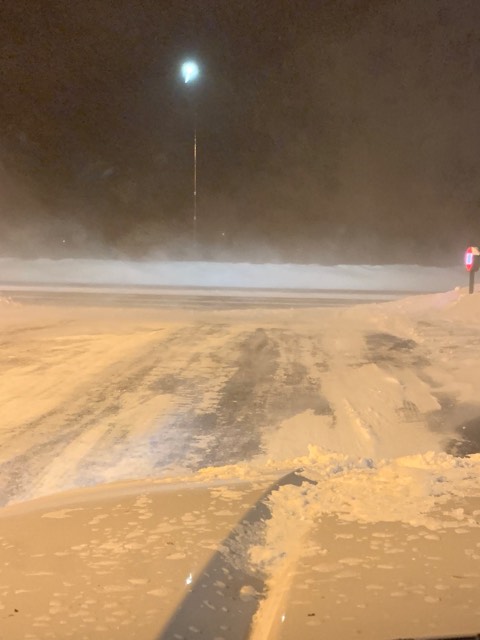
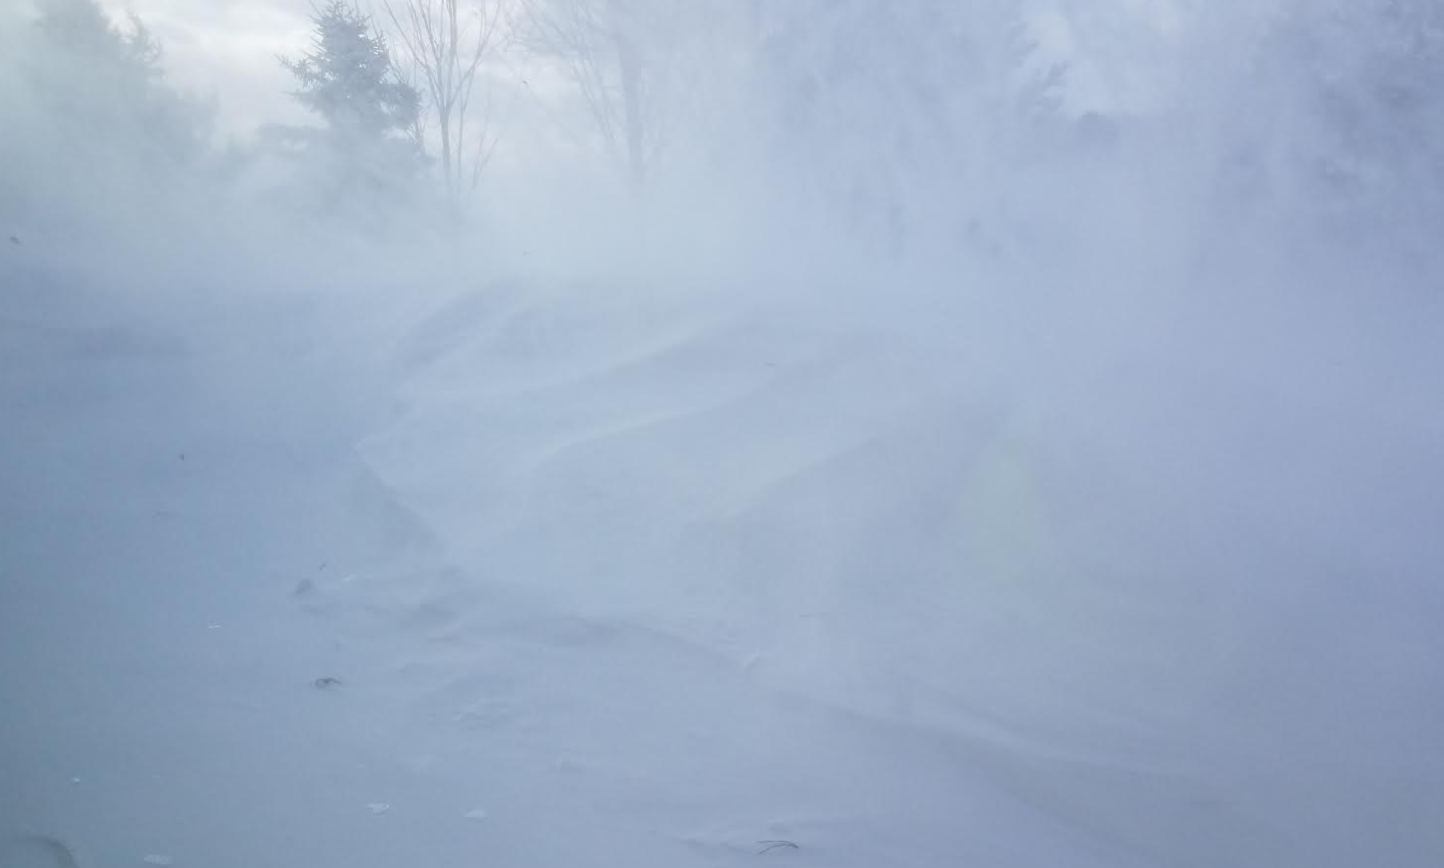
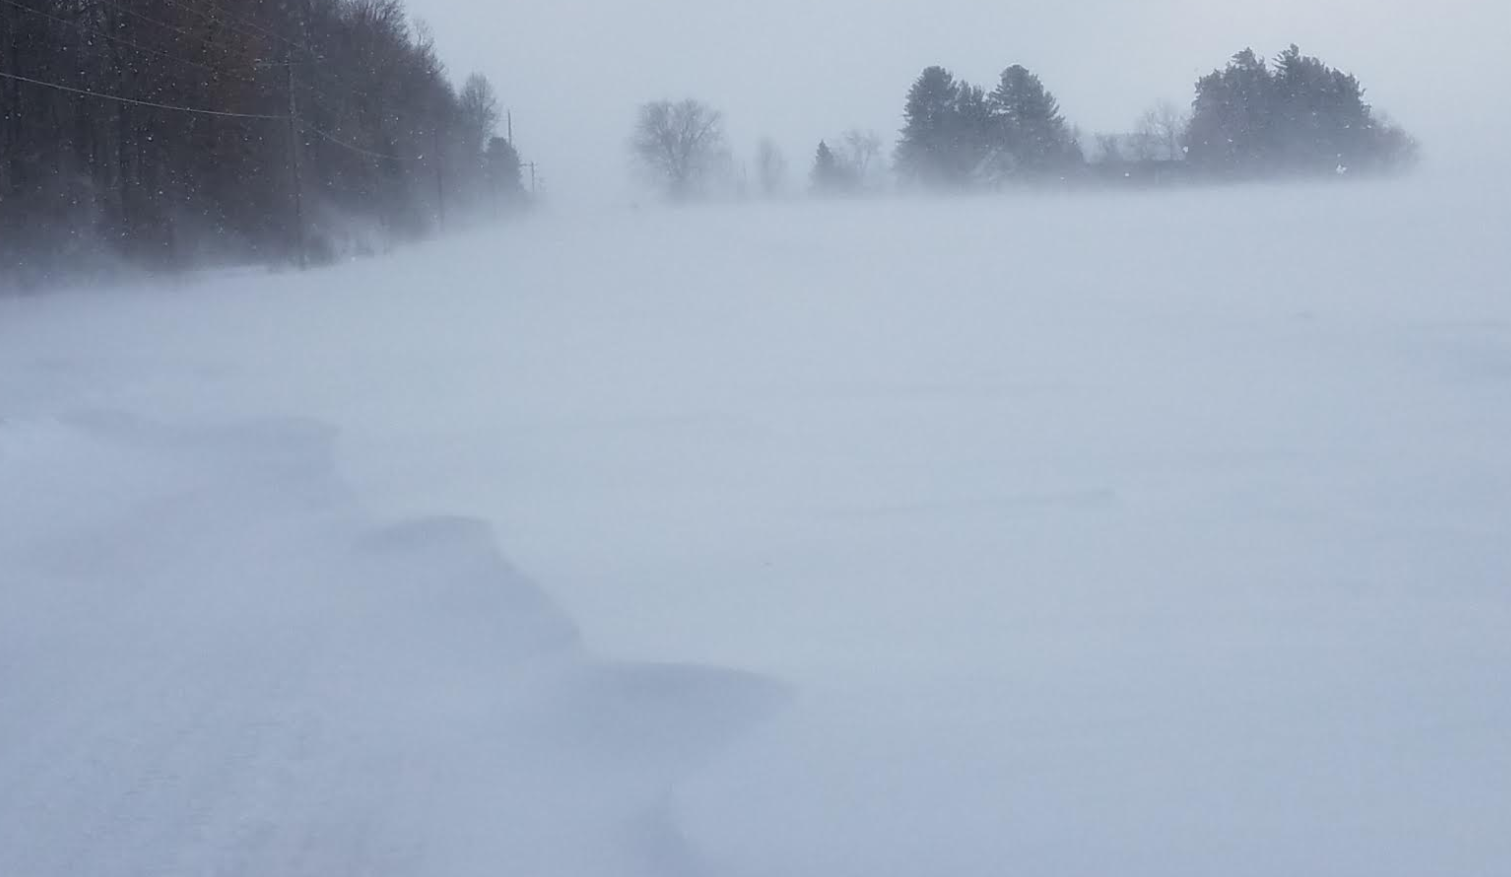
Blowing snow near Minocqua. Courtesy Trevor Rodman |
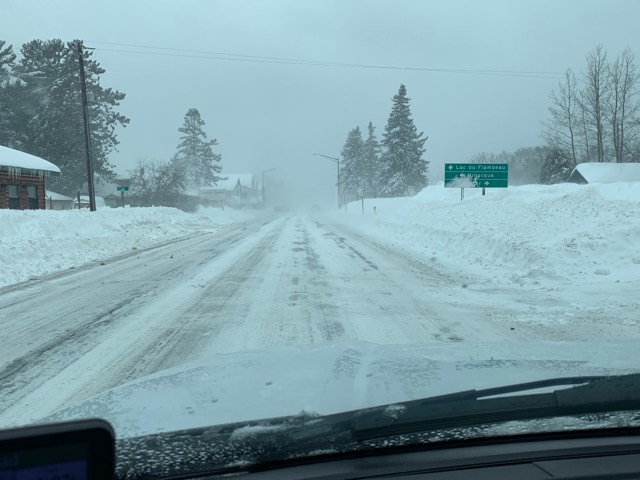
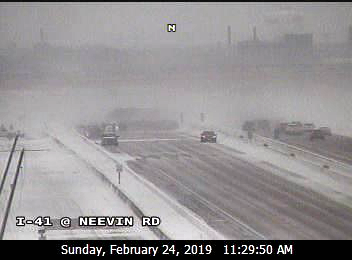
Blowing snow in Oneida County. Courtesy Trevor Rodman | US 41Traffic Cam Near Neenah |
 |
 |
||
|
Marathon/Clark County line. |
Marathon/Clark County line. |
Radar
 |
 |
 |
 |
| Entire storm radar evolution from Saturday evening through midday Sunday. | As the storm approached, heavy mixed precipitation, including freezing rain, moved in from the southwest. | Between midnight and 6am Sunday morning heavy snow prevailed across much of the forecast area. | Storm continued to intensify as it began to depart late Sunday morning. High winds in its wake produced dangerous blizzard conditions. |
Environment - GOES-16 Satellite Imagery
Below are various GOES-16 satellite animations illustrating the evolution of the intensifying winter storm as viewed from a geostationary satellite. The water vapor animation in Figure 1 shows the evolution of the system as it moved northeast from NW Missouri to Northeast Wisconsin. The heaviest snow fell generally along the southern edge of the dark blue enhanced area just northwest of the upper-level circulation. The intrusive wedge of orange/dark orange colors in this animation represents very dry air in the low to middle portion of the atmosphere (referred to as the "dry slot"). The dry slot is a common feature of mature winter storms. In rapidly intensifying and strong winter storms, the dry air often originates form the lower stratosphere and descends into the middle or even lower troposphere.
Figure 2 below is a combination of GOES-16 satellite spectral bands designed to highlight clouds of various depths and altitudes. This particular combination of spectral bands is referred to as the Nighttime Microphysics RGB. The animation shown in Figure 2 below is during the period from about midnight until 6 am Sunday morning. This was the period when the heaviest precipitation was falling over central and north-central Wisconsin. The yellow/cream colored clouds (e.g., Illinois, Indiana and lower Michigan) are mainly low-level clouds composed mainly of water droplets and/or super-cooled water. The speckled maroon colored clouds over eastern Minnesota, central and northern Wisconsin into Upper Michigan are multi-layered clouds that are quite deep and cold. This was generally where the heaviest snowfall was falling at this time. Also note the rapidly developing circulation over northeast Wisconsin toward the end of the loop. The winter storm was strengthening rapidly at this time. Near-surface winds south and southwest of this circulation were increasing rapidly by day-break Sunday morning.
Figure 3 is a high resolution visible image, starting just after sunrise on Sunday morning and ending around 10 am CST. It shows the impressive circulation just north of the City of Green Bay. In the wake of this circulation, surface winds continued to increase with widespread surface wind gust of 45 to 55 mph across much of Wisconsin. Although most of the snowfall had ended by this time, widespread whiteout conditions due to blowing and drifting snow were reported over much of central and north-central Wisconsin by this time. Westerly winds were also increasing rapidly by 10 am over much of east-central Wisconsin as well, creating localized ground blizzard conditions especially in exposed areas along Interstates I43 and I41 just south of Green Bay, Wisconsin.
Figure 4 is a GOES-16 spectral band combination designed to highlight clouds of various altitudes and distinguish ice from water clouds. This animation is also during the morning of Sunday February 24 when blizzard or near blizzard conditions were widespread across much of Wisconsin. The whitish or light aqua colored clouds are primarily low clouds composed of water droplets. The orange-tinted clouds are generally thick clouds extending deeper into the troposphere and are compose mainly of ice crystals. The bright green areas on the far left side of the animation is actually snow-covered ground. Note that you can see some of the land features like rivers and lakes across southeast Minnesota into northeast Iowa by the end of the loop. This imagery helps forecasters better distinguish snow cover from low clouds that can sometimes look quite similar in traditional visible imagery.
Figure 5 is similar to Figure 2 but focused on the circulation over northeast Wisconsin around 10 am Sunday morning. Note the yellowish wedge extending west across northern Wisconsin. This region represents the very dry air (dry slot) that actually wrapped around the intensifying circulation, temporarily scouring our most of the moisture/precipitation over northern Wisconsin. Compare the animation in Figure 5 to the NWS Green Bay WSR-88D radar data animation for approximately the same time in Figure 6. Also note in Figure 6 the area of light to moderate snow (white/purple colors) across east-central Wisconsin. This area of snow was very near the center of the upper-level circulation.
 |
 |
 |
| Figure 1. Water Vapor (Band 7) | Figure 2. Nighttime Microphysics RGB | Figure 3. 2 km Visible (Band 2) |
.gif) |
 |
 |
| Figure 4. Day Cloud Phase RGB | Figure 5. Nightime Microphysics RGB | Figure 6. NWS Green Bay (GRB) Radar |
Additional Environmental Data
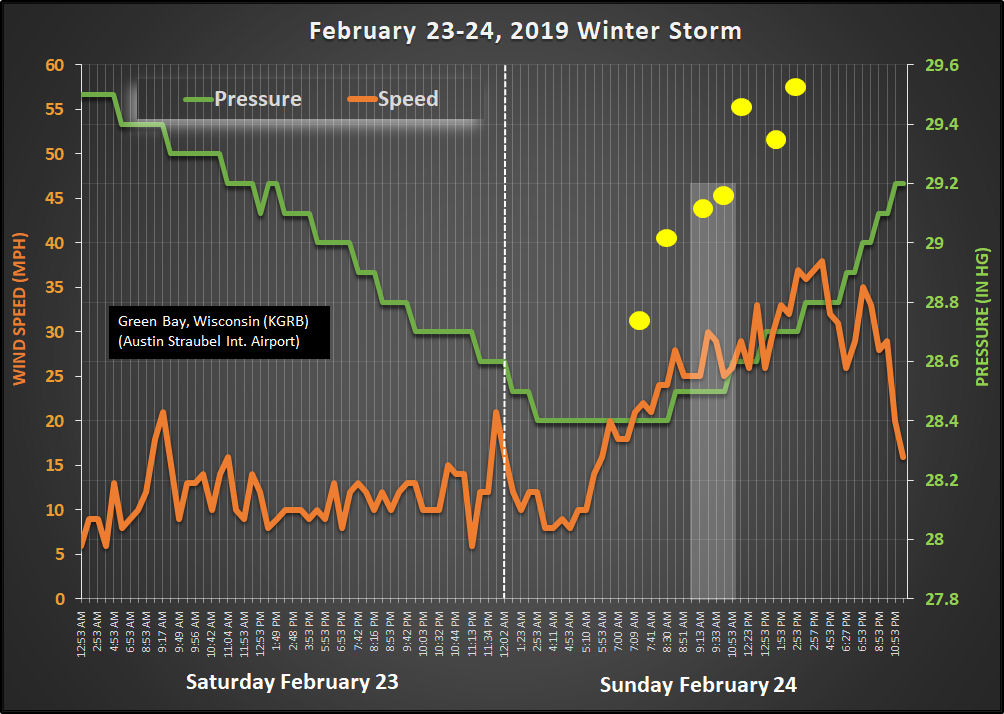
The animation in Figure 7 (below) shows the Mean Sea Level Pressure (MSLP) pattern associated with the intensifying winter storm as it moved across Wisconsin early Sunday February 24, 2019. The intensifying surface low pressure center passed very close to the city of Green Bay between about 4 am and 6 am CST Sunday morning. Note how tight (compact) the isobars (lines of equal pressure) are in the wake of the departing surface low. This tight pressure gradient led to the very strong westerly winds that caused blizzard conditions across much of the area. Shown in Figure 8 (below) is the surface pressure (in Hg) and average wind speed (mph) trends at Austin Straubel International Airport in Green Bay Wisconsin (KGRB) during the period from 12 am Saturday February 23 through 11:30 pm Sunday February 24. The yellow dots denote some peak wind gusts (mph) during the day on Sunday February 24. The grayish vertical bar denoted on the graph represents the approximate 2-hour period ending at 11 am Sunday (shortly before the deadly multi-vehicle pile-up on Interstate I41). The incident occurred about 35 miles south of the city of Green Bay. The pressure trace (green line) shows that after several hours of rapidly falling pressure, surface pressure starting to rise shortly after 8 am CST Sunday morning as the surface low began to move out over Lake Michigan. Note also how the surface winds speeds (orange line) increased dramatically after 8am CST Sunday morning. By about 11 am CST, westerly winds at the surface were averaging between 25 and 30 mph with occasional gusts of 40 to 45 mph. The winds continued to increase during the afternoon reaching average speeds of 35 to 40 mph with occasional gusts of 55 to 60 mph by 3 pm CST. The strong winds continued to cause considerable blowing and drifting snow during the afternoon on Sunday, hampering rescue efforts following with the I41 multi-vehicle pile-up.
 |
 |
|
| Figure 7. Mean Sea Level Pressure | Figure 8. Pressure and Wind Trace (KGRB) | More to come... |
 |
Media use of NWS Web News Stories is encouraged! Please acknowledge the NWS as the source of any news information accessed from this site. |
|


.jpg)