
Dangerous heat will expand from the Gulf Coast into the Southern Plains and Desert Southwest through week's end. Additional extreme heat impacting the Pacific Northwest will shift to the northern Plains by the weekend. Tropical Storm Bertha is expected to continue to impact portions of the northern Gulf Coast from the western Florida Panhandle to southeastern Louisiana through tonight. Read More >
A couple of severe thunderstorms impacted the Hanford County Warning Area as well as the Sacramento Valley (likely maximized by left-exit region jet dynamics in Sacramento's area) on Feb 2nd, 2019. One of the severe thunderstorms produced a tornado in Mariposa County.
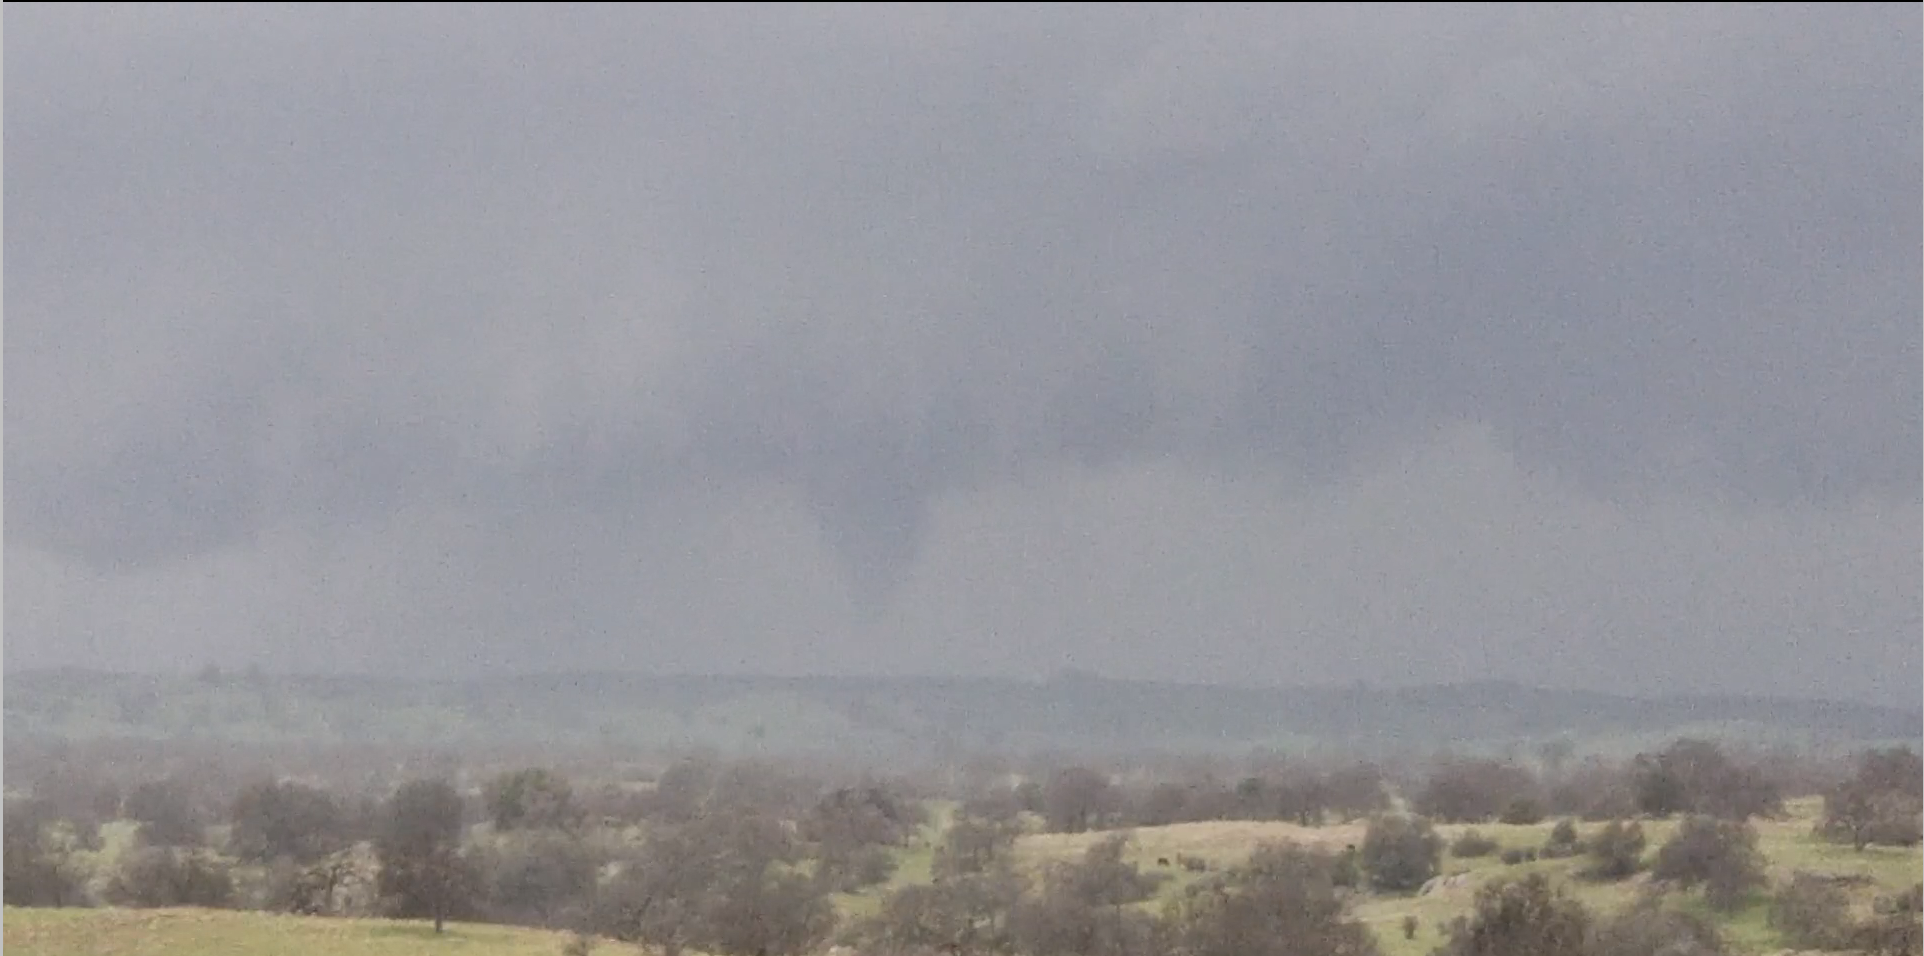
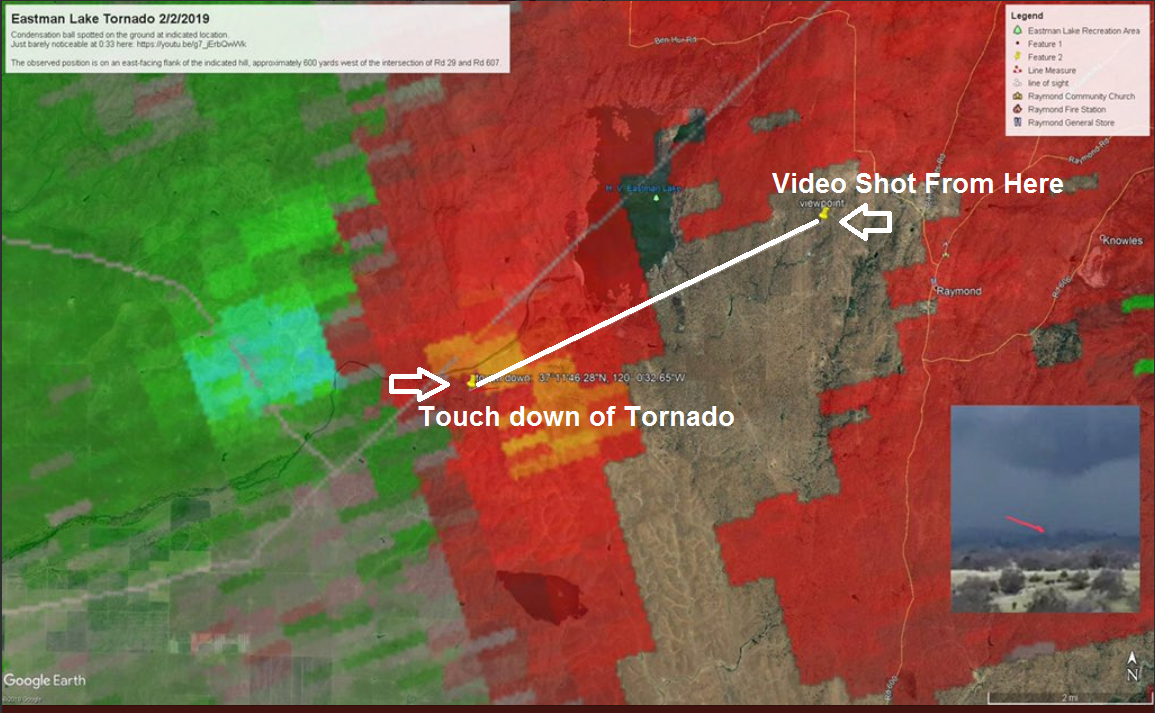
Full Video at the link below.
https://www.youtube.com/watch?v=sW5PpMFjkgc
Video and photos courtesy of Stephen Kinnett and Ryan Kinnett.
A weakening closed low and associated cold front came through the valley on Feb 2nd, with the cold frontal passage occurring around 11a to 1p in the San Joaquin Valley. There was a noticeably sharp reflectivity gradient over the office around 11:00 AM PST. After the front skies cleared quickly, and surface temperatures began to rise via solar heating into the low 60’s with dew points around 50 degrees.
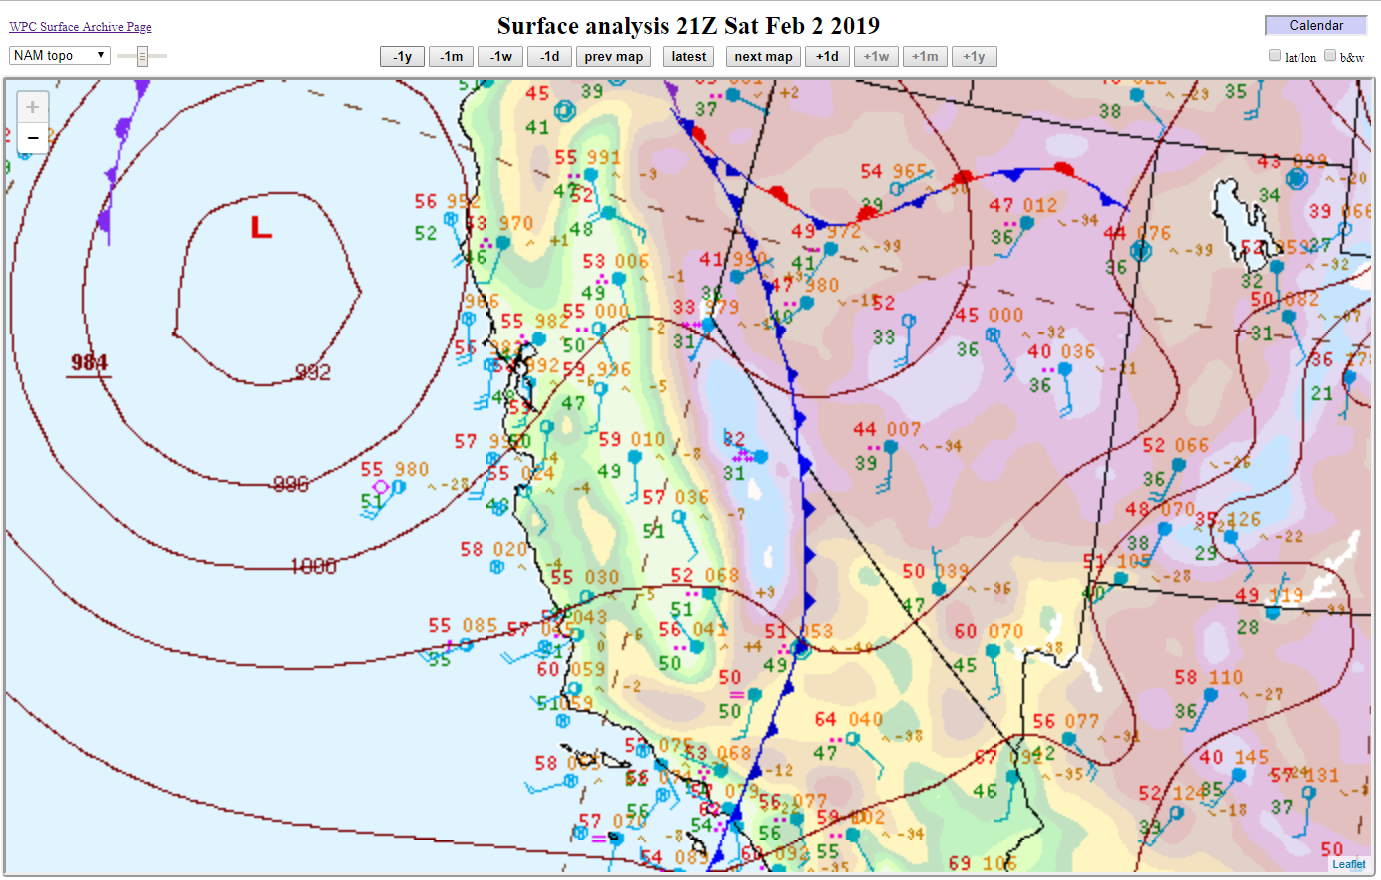
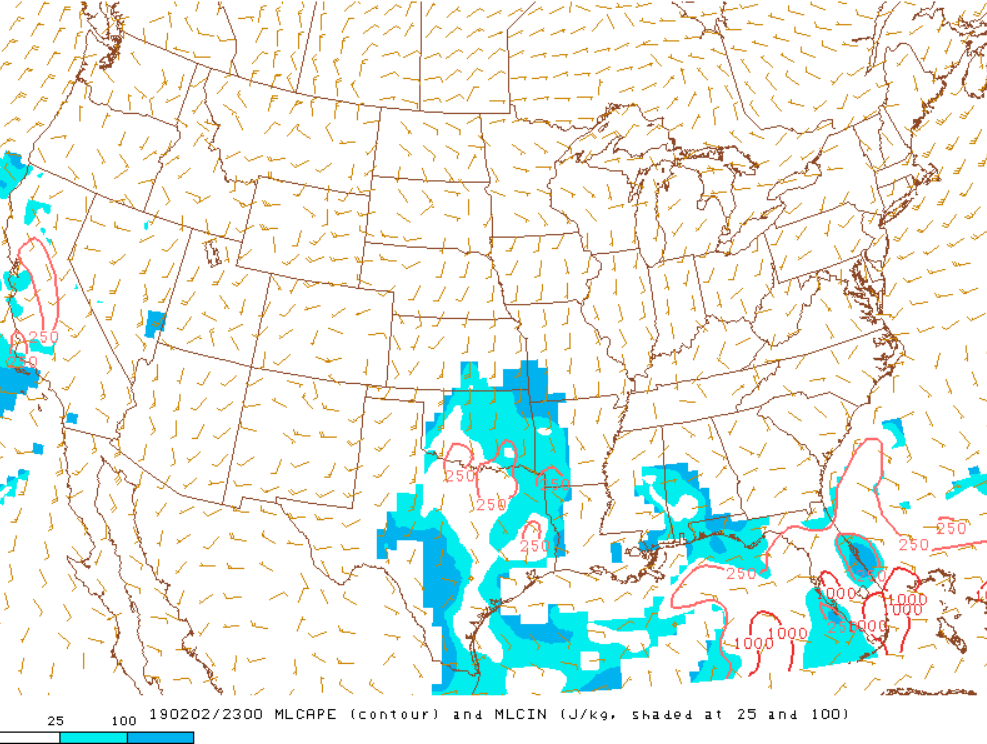
This low level heating occurring in tandem with synoptic cooling/cold air advection aloft, which gave us adequate thermodynamics/lapse rates for convective development in our area. Both Surface Based and 100 mb Mixed Layer CAPE were in the 250-500 j/kg range, which is more than enough for severe weather in the San Joaquin Valley compared to climatology.
Cells almost immediately began to form in western Fresno County behind the front, but were short-lived. Stronger cells formed on the Merced/Modesto County border around noon where near-surface instability was higher (surface temps in the low 60’s) – these storms were left-movers associated with a cold air advection regime/post frontal backing of winds with height. Just after 2 PM PST, surface temperatures reached low 60’s in southwestern Madera County, which became the second focal point for convective initiation on Feb 2nd. These storms behaved slightly differently than the storms to the north – they moved right of the mean wind.
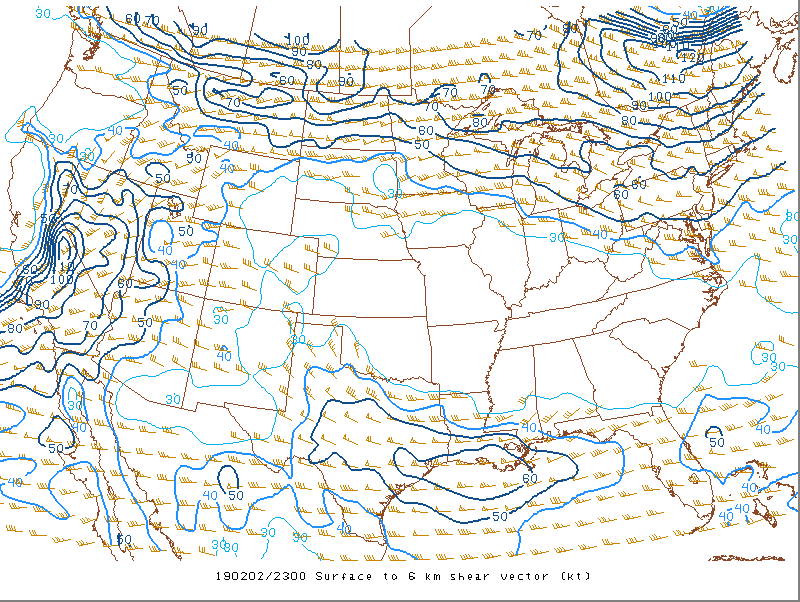
Possibly the difference in the storm motion could be due to local differences in hodograph structure in the eastern portion of the valley compared to the western portion of the valley. Surface winds after 1p in the central/western portion of the valley were mostly out of the west, with winds aloft coming from the south.
In the eastern valley, surface winds had a south/southeasterly component (same wind direction aloft), which would indicate a veering of winds aloft with height. This could be due to the topographical difference between the flat western/central and the hilly eastern portion of the valley, where surface winds can form a barrier jet that comes out of the southeast.
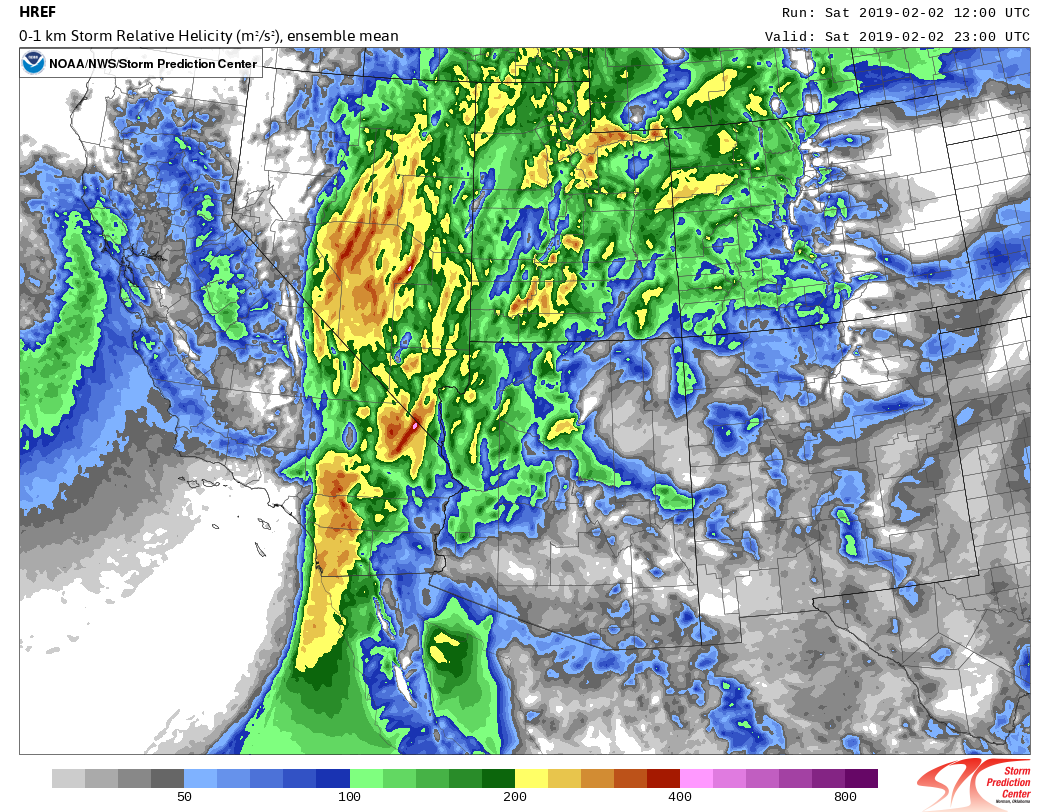
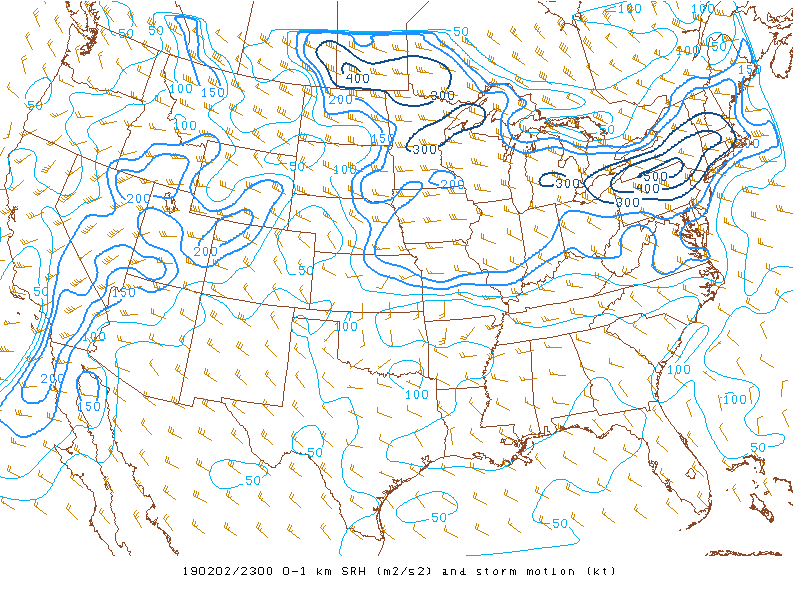
In other words, winds were turning clockwise with height in eastern Madera, Mariposa, and Fresno Counties instead of turning counterclockwise with height due to topographical differences. The southeast-oriented barrier-jet increased 0-1 km storm relative helicity values to around 100-150 m^2/s^2 after 2 PM in the eastern portion of the San Joaquin Valley, which well exceeds minimum criteria for funnel cloud development. (HREF forecast values attached below at 3 PM PST).
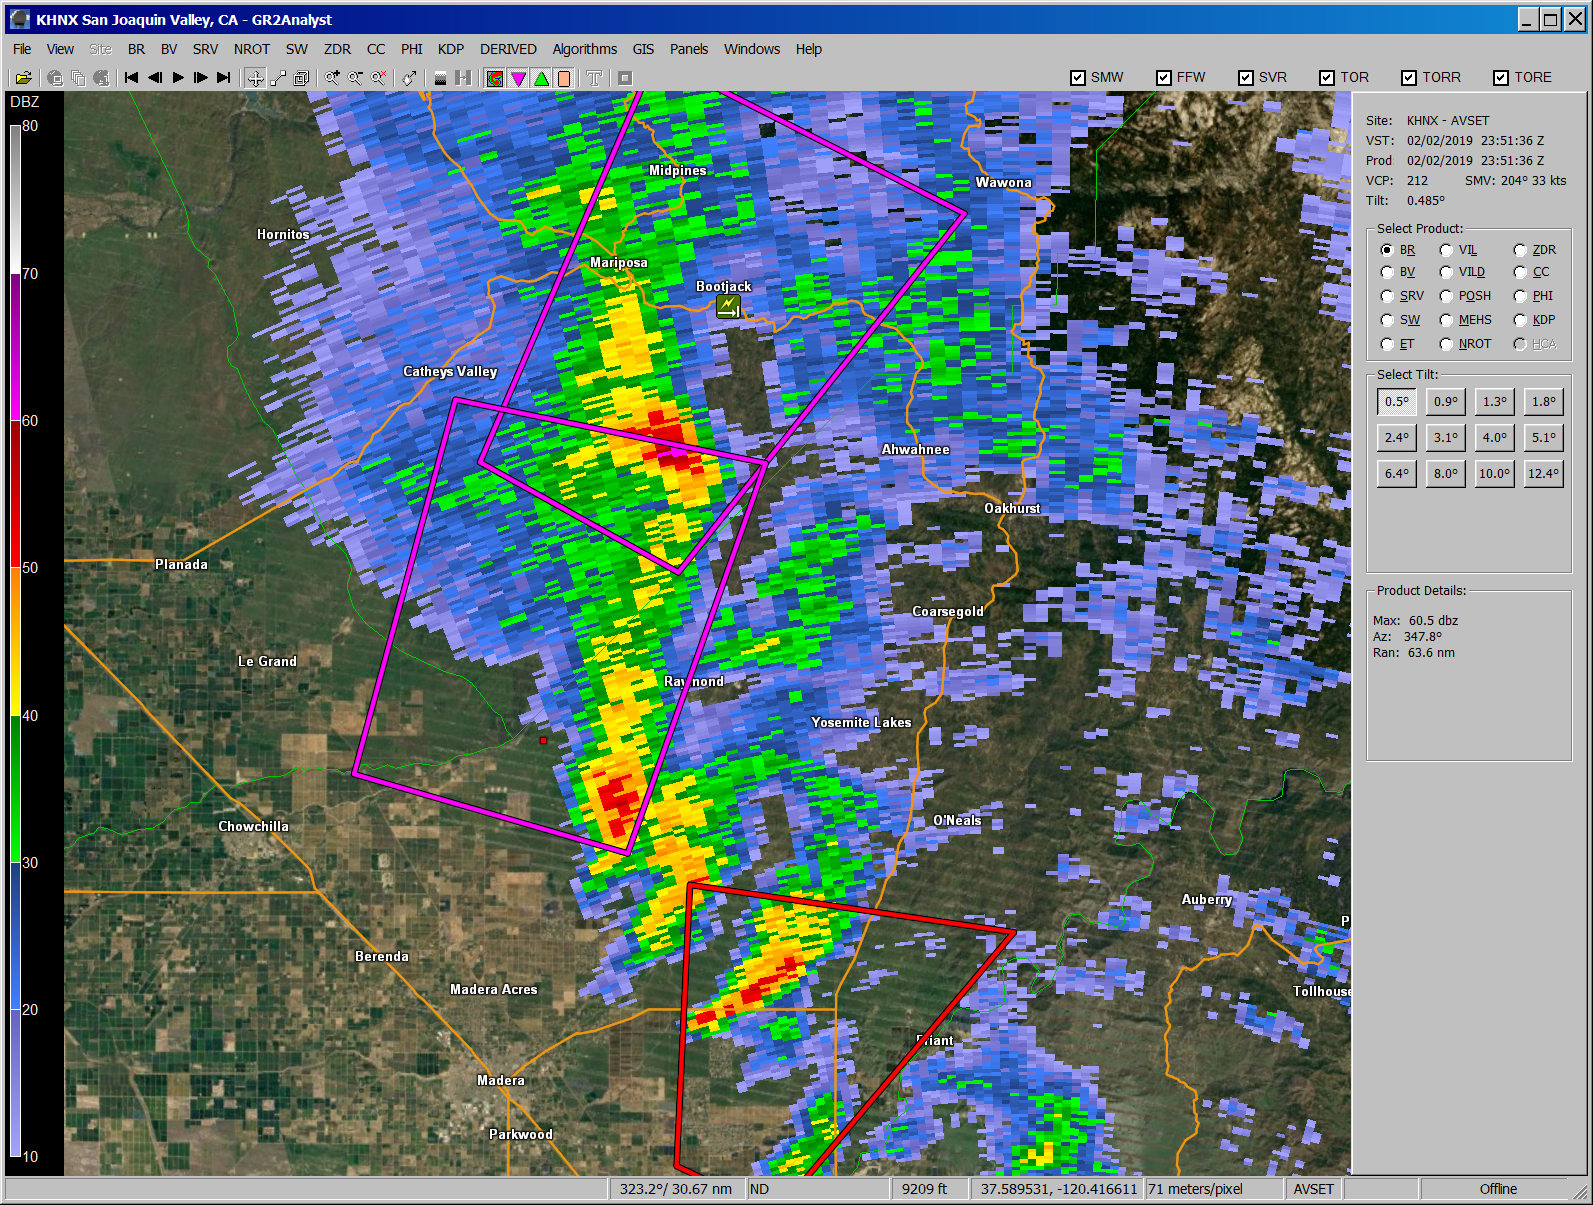
These storms -- two in particular -- were moving northeast and quickly intensified to severe criteria by 3:13 PM PST. Both were warned for one inch hail, 60-70 mph winds, and the possibility of a tornado. Surface Based CAPE was in the 100-500 J/KG range per the High Resolution Ensemble Forecast. There is some elevation in this area, which could aid in mechanical lift/orographically forced updraft intensification.
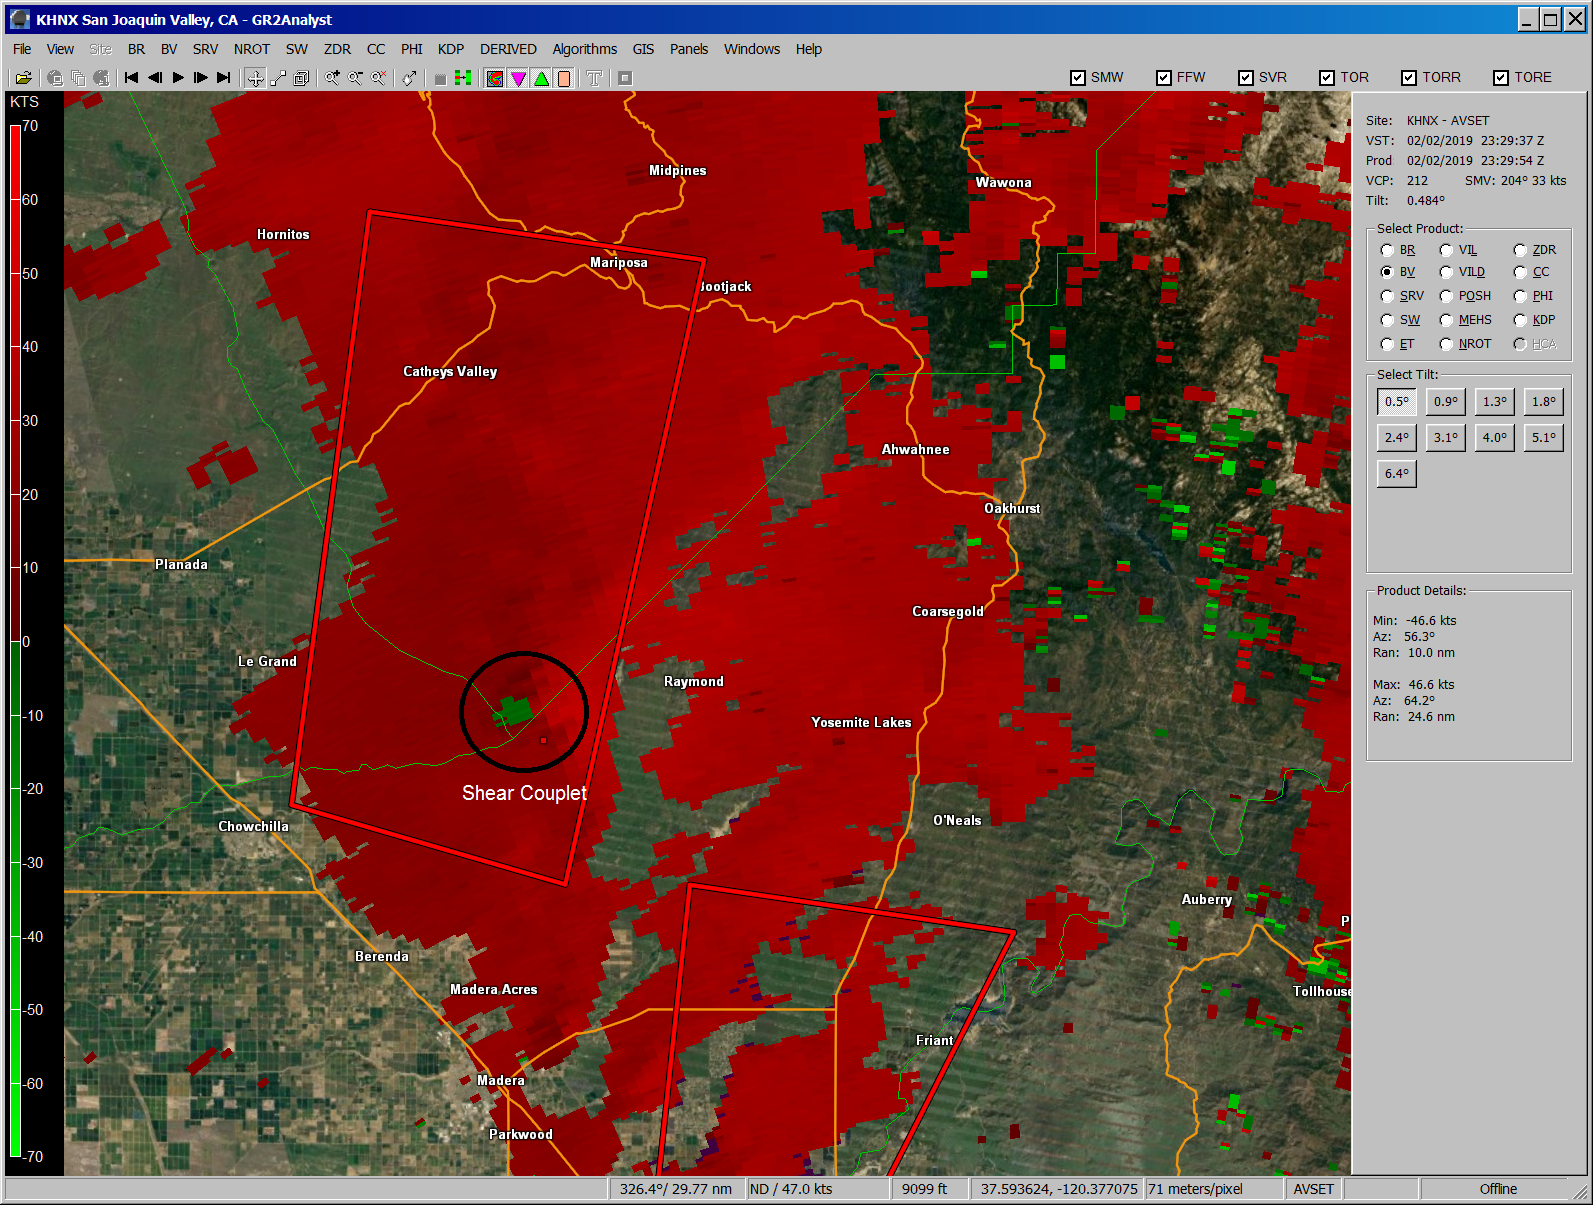
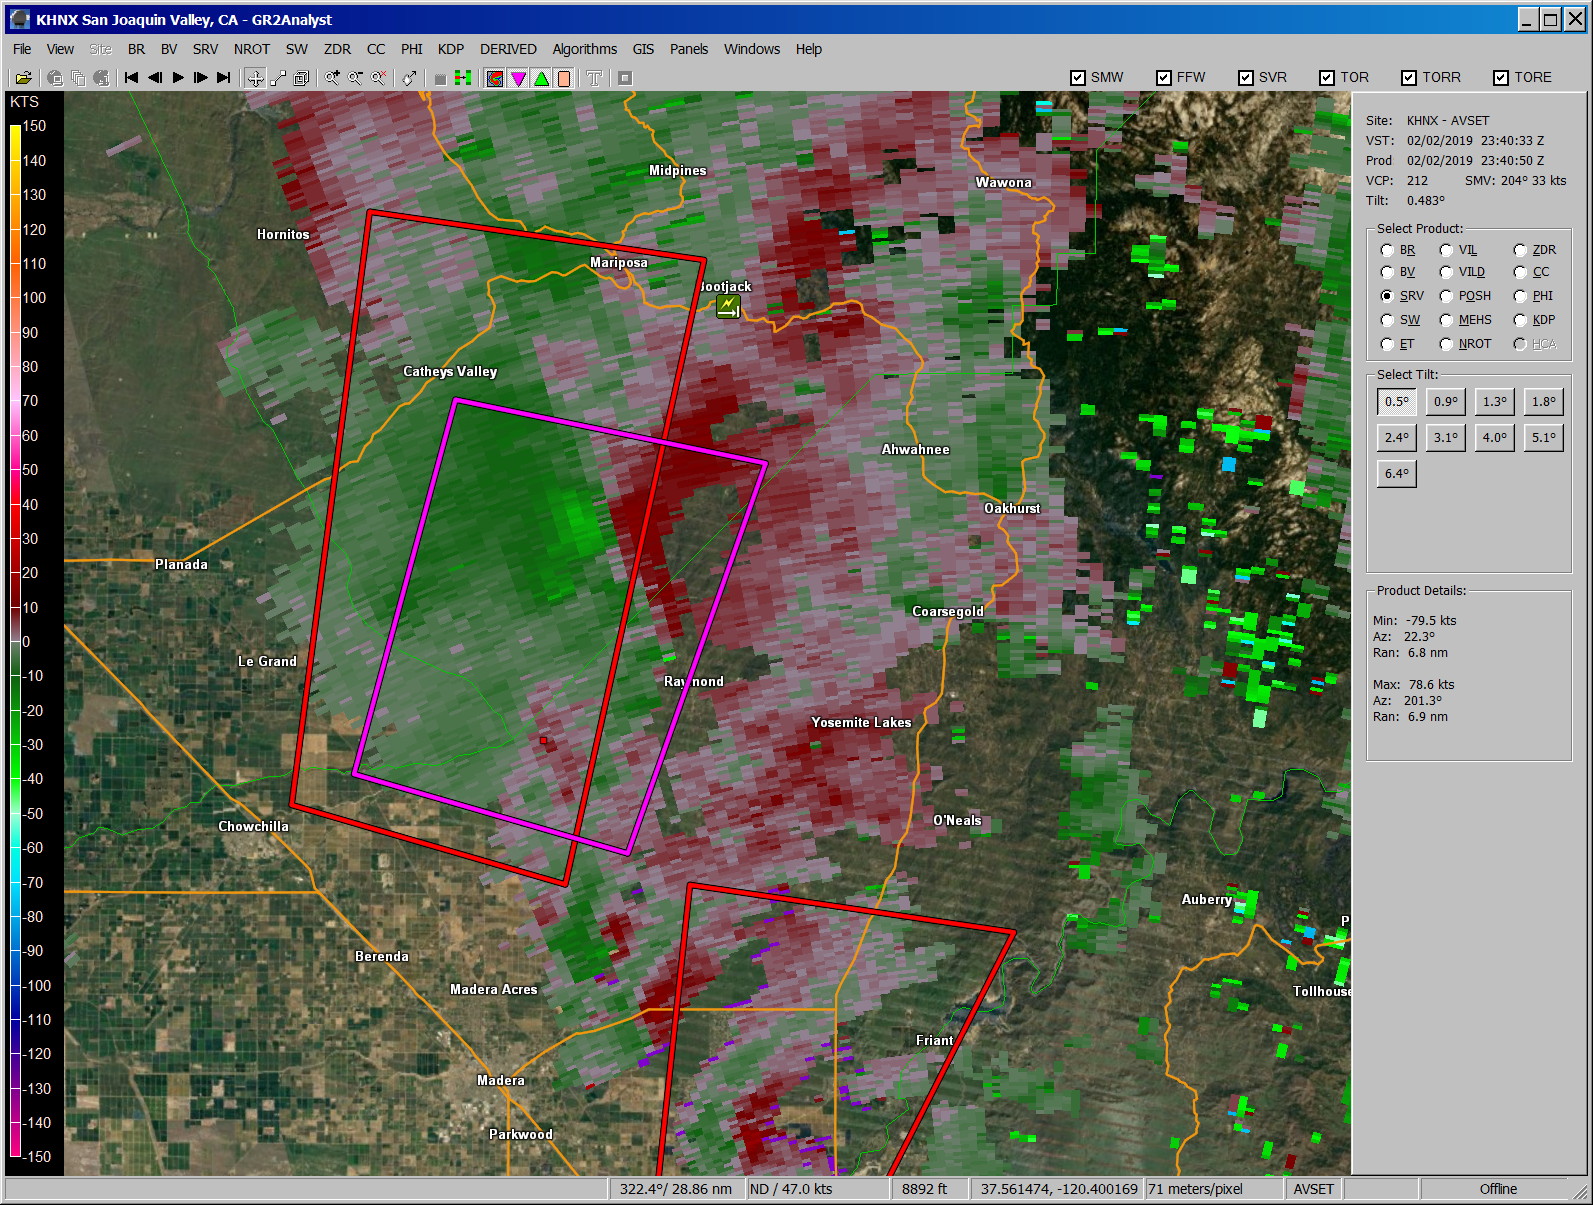
The northwestern of the two storms (east of Chowchilla) intensified rapidly, and eventually formed a 53.3 knot velocity couplet (26.65 knot Rotational Velocity), which is a very impressive radar signature for the San Joaquin Valley.
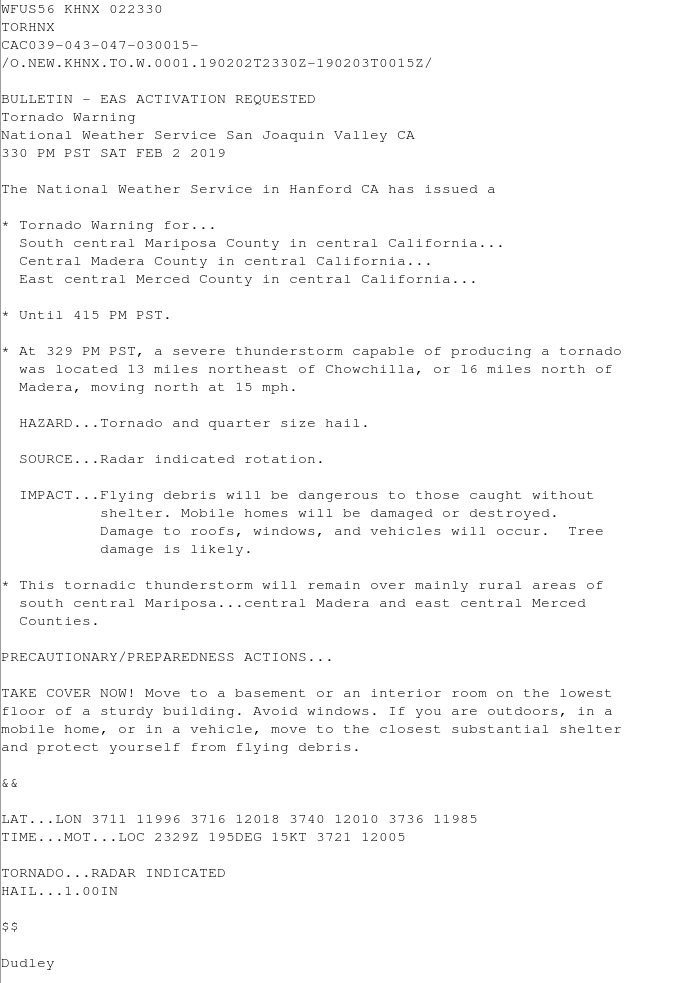
A tornado warning was issued for this storm around 3:30 PM PST – a spotter at Eastman Lake reported a funnel cloud around 3:35 PM.
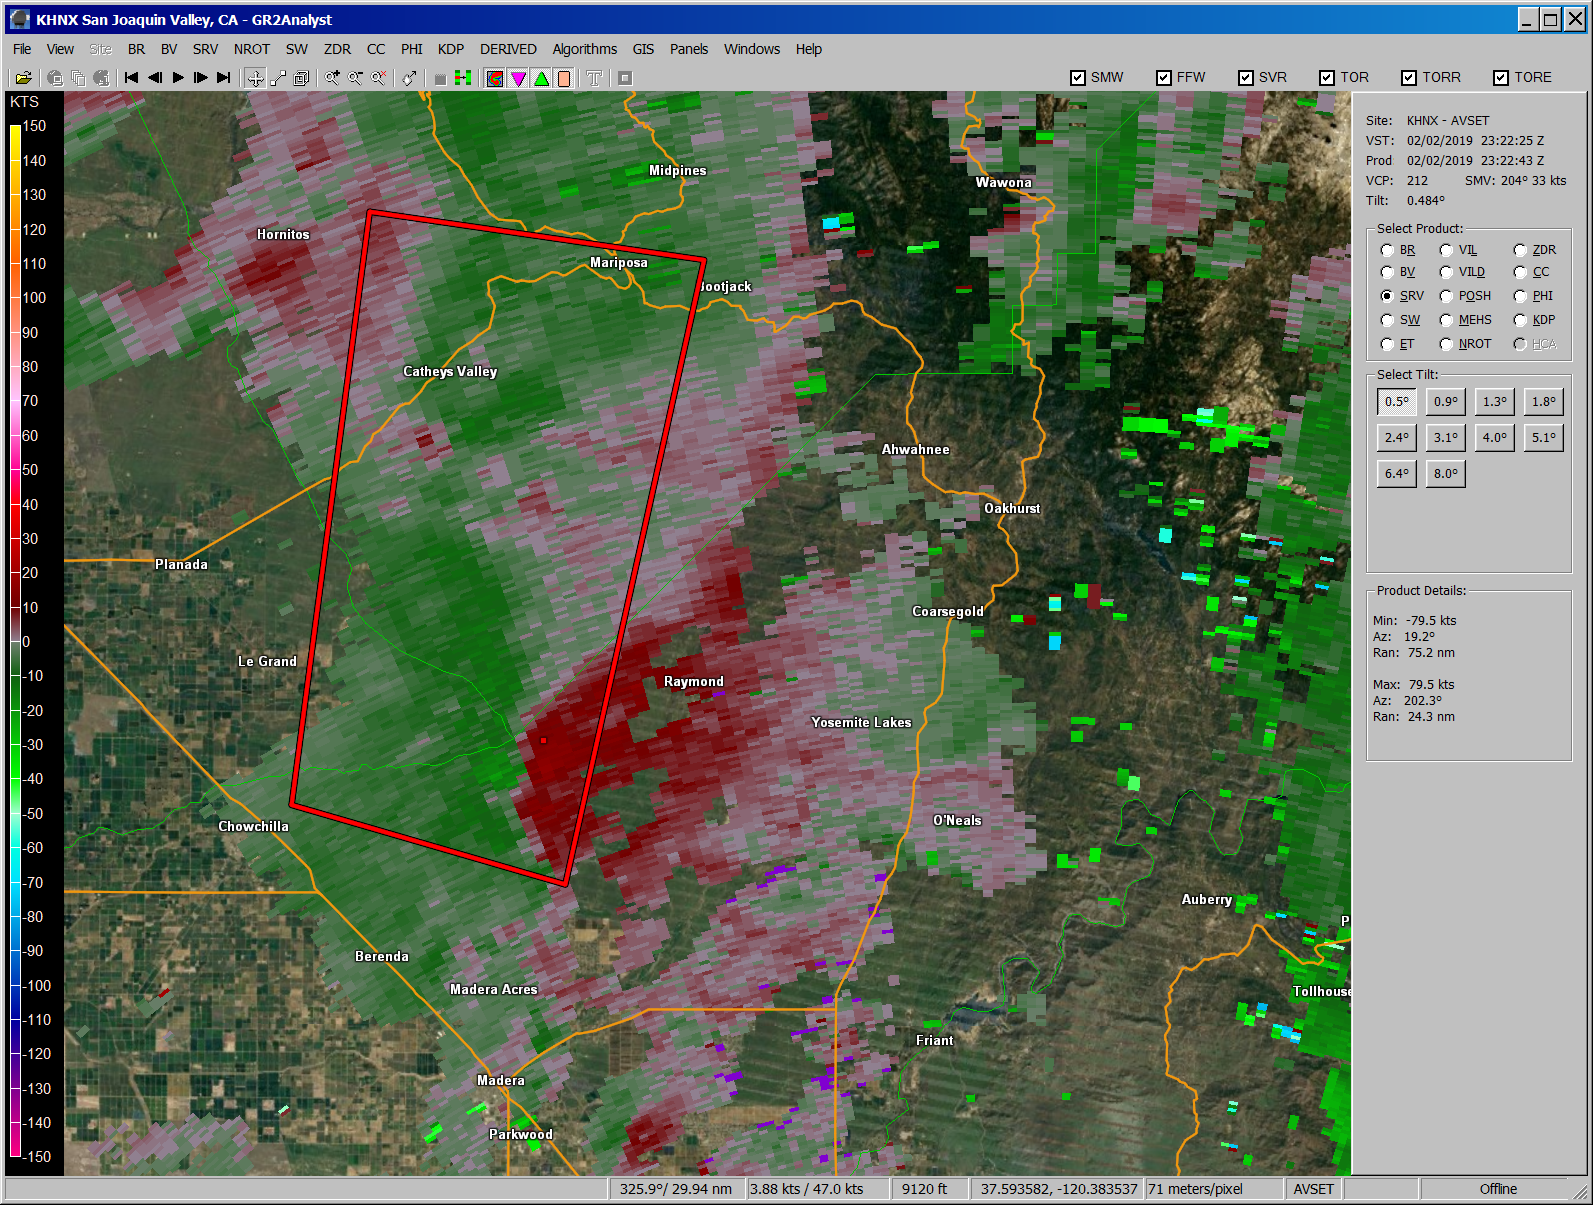
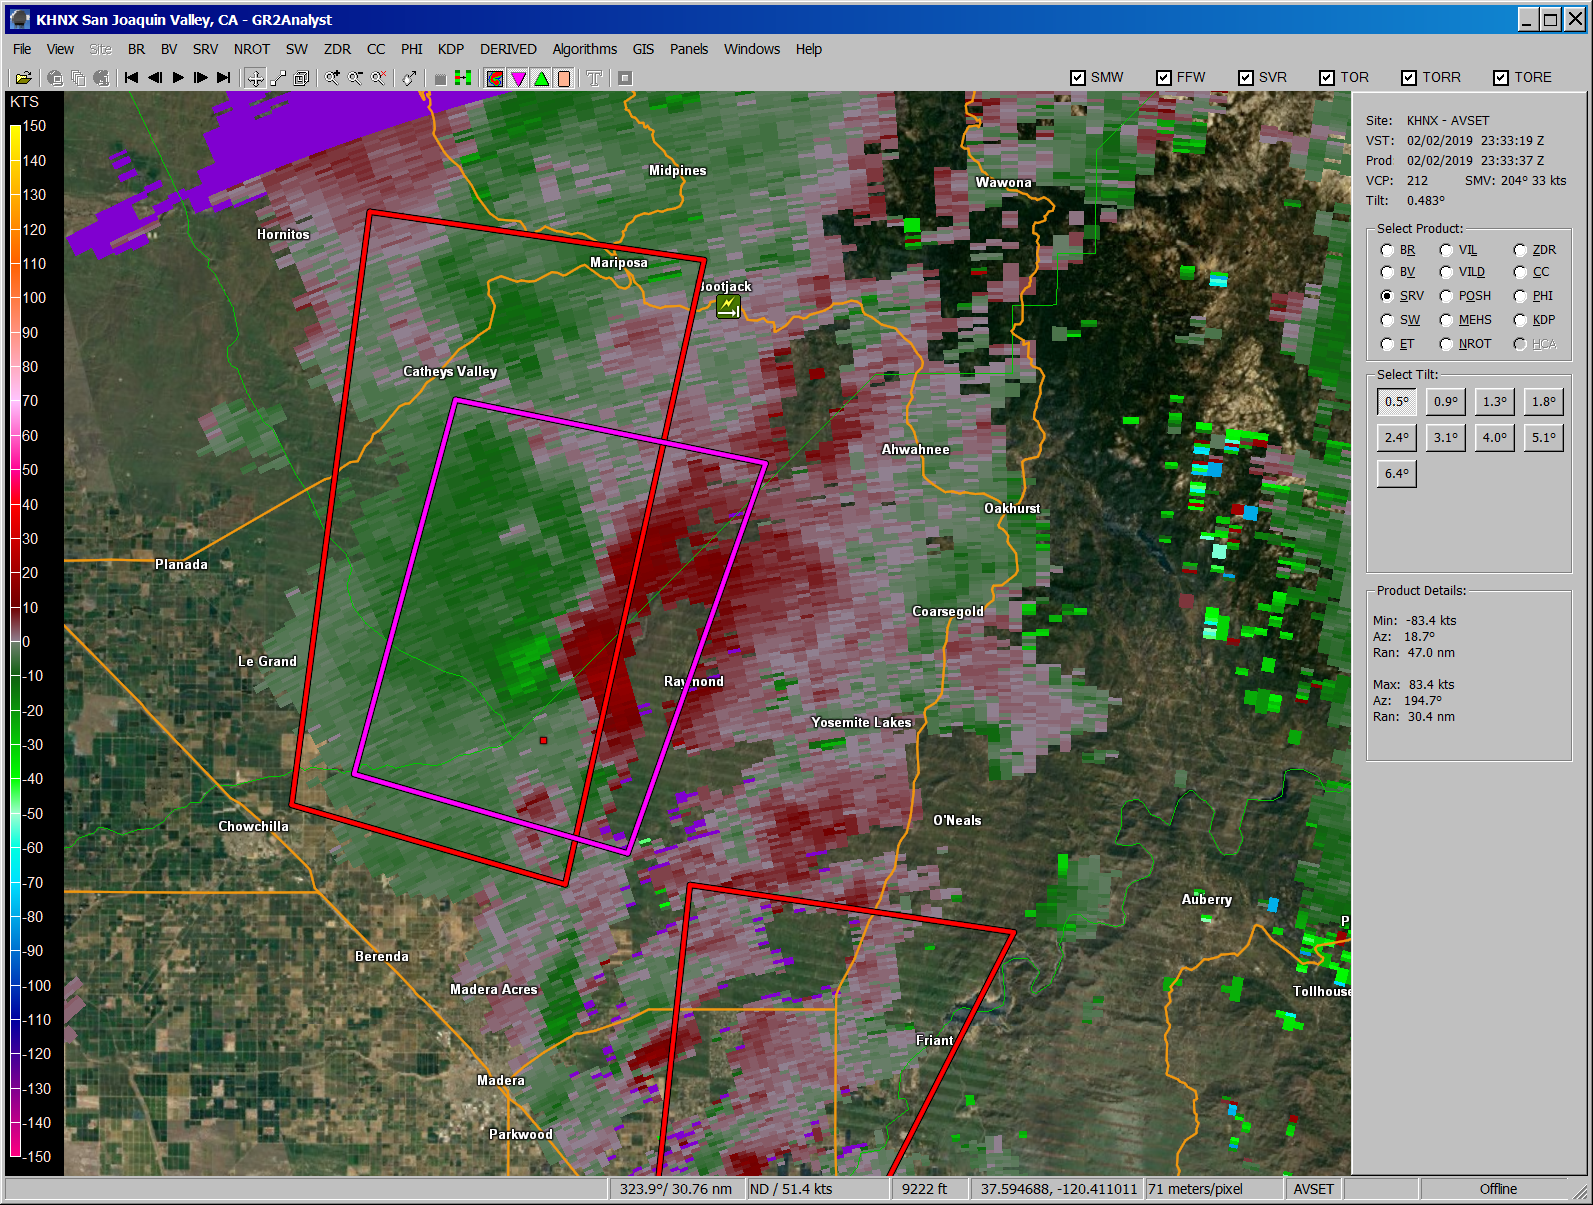
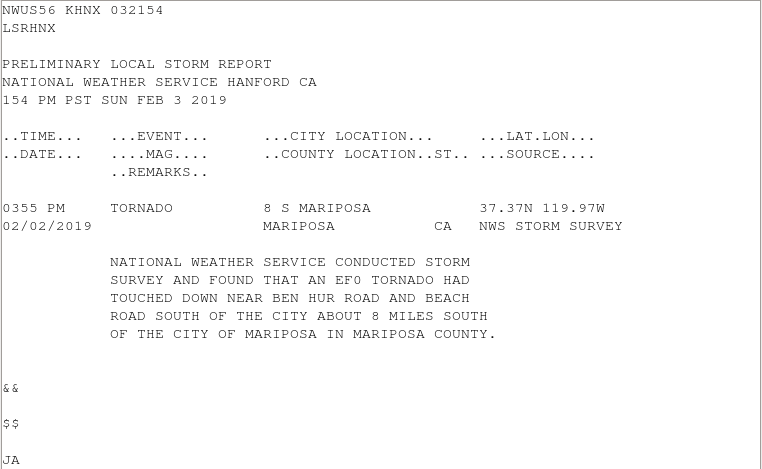
The storm continued to exhibit a strong velocity couplet for several more scans, and a second tornado warning was issued at 3:50 PM PST. The second tornado warning was allowed to expire at 4:15 PM PST as the storm had moved into a much colder/less favorable environment for severe weather. A storm survey was conducted by Warning Coordination Meteorologist Jerald Meadows on Feb 3rd, verifying found EF-0 damage in Mariposa County. There were no severe weather reports by the public from the other severe-warned storm southeast of the tornado producer.
Click on the images below to watch a loop of Velocity, Storm Relative Velocity and Reflectivity.
Images from GR2Analyst.


Things to note about this event:
There could have been multiple touchdowns of the tornado in Mariposa County based on the video evidence given to us, but 25 mins of lead time was given.
This event review was written by Forecaster Andy Bollenbacher, with contributions from Science and Operations Officer Kris Mattarochia, Senior Forecaster Jim Dudley and Forecaster Jim Andersen.

