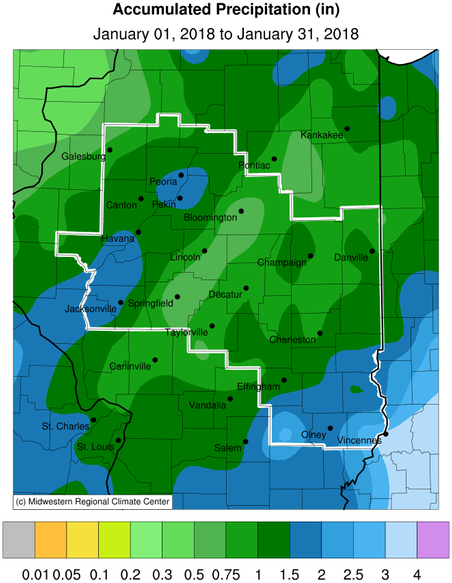
January Precipitation Highlights:
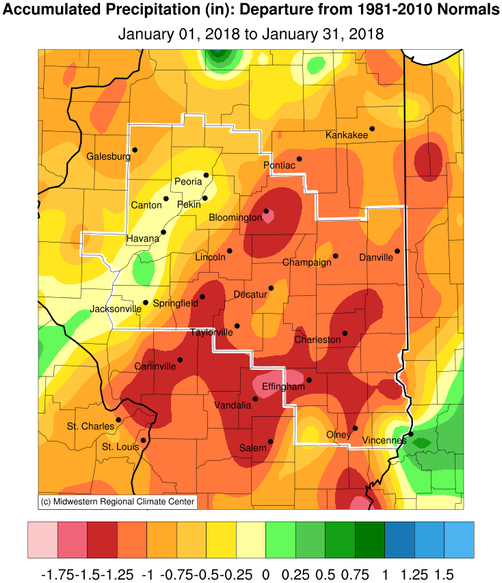
- Total monthly precipitation was below to much below normal across central and southeast Illinois. The largest deficits of 1" or greater occurred from the I-55 corridor, southeast to I-70. Farther west along the Illinois River Valley, totals were generally a half inch or less below normal, thanks in large part to localized 1"+ rainfall from a system on the 21st-22nd.
- A band of showers with a few embedded thunderstorms tracked through the region during the night of the 21st into the early morning of the 22nd. As the cold front approached later in the day, it interacted with a weakly unstable but highly sheared environment to produce widely scattered strong thunderstorms across west-central Illinois during the afternoon of the 22nd. A few of these cells produced gusty winds of 40-50 mph and hail ranging from pea size to dime size, with a couple quarter size hailstones west of the I-55 corridor. Rainfall with this event was heaviest across the Illinois River Valley, where amounts of 1-1.50" were reported. Elsewhere around the area, lighter amounts of 0.25 to 0.75 were common.
- The overall dryness led to the expansion of drought conditions into central Illinois. By the end of the month, the U.S. Drought Monitor showed moderate drought extending from southwest into west central Illinois, with abnormally dry conditions affecting much of the remainder of central and southeast Illinois.
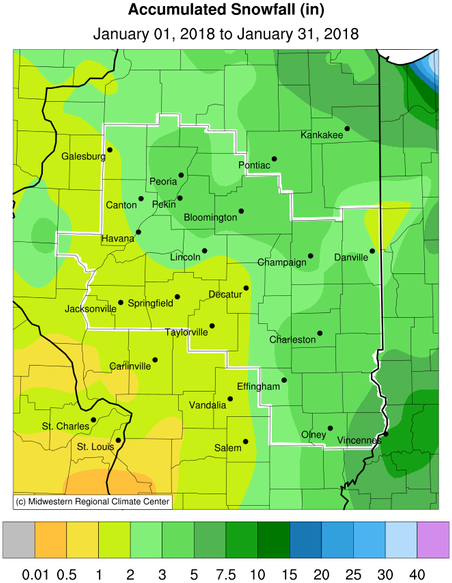
- Monthly snow totals ranged from 3-6 inches along and north of I-74, and along and east of the I-57 corridor, to less than 2 inches in west central Illinois. While no heavy snow was observed during the month, a few Alberta clipper systems resulted in the snow accumulation. The most significant clipper system brought light to moderate snow to central Illinois from the late afternoon of January 14th through the early morning of January 15th. Snowfall totals were generally 1 to 3 inches, however, a few spots northeast of a Bloomington to Mattoon line picked up as much as 4 inches.
 |
 |
| January Precipitation |
January Precipitaiton Departure from Normal |
 |
 |
| January Snowfall |
January Snowfall Departure from Normal |
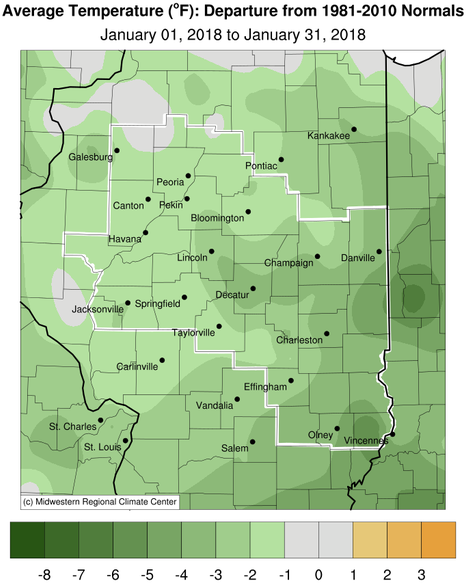
January Temperature Highlights:
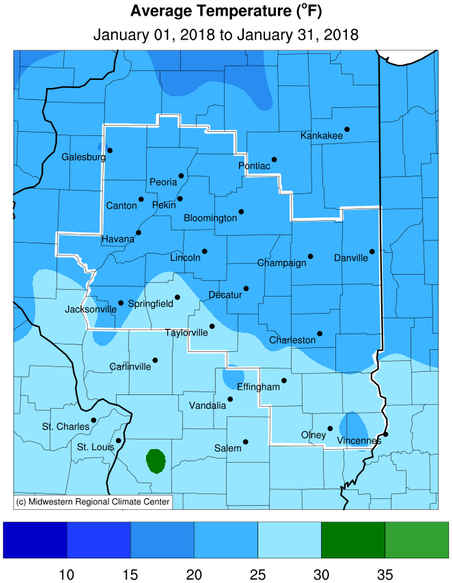
- Monthly average temperatures ranged from around 1 degree below normal over the western portions of the state, to 2-4 degrees below normal over eastern Illinois. Two bitterly cold Arctic air masses affected the region, on the 1st-6th, and again on the 12th-17th. Sub-zero low temperatures were common during these periods, and many locations failed to reach a high of 0 on the 1st, setting records for minimum high temperatures. Besides these two significant cold outbreaks, much of the month saw much above normal temperatures. Highs reaching the 50s and 60s were common on the 10th-11th, and again on the 21st-22nd and 25th-28th.
 |
 |
| January Average Temperature |
January Temperature Departure from Normal |
|
Site
|
Precipitation
|
Departure from Normal |
Snowfall |
Departure
from
Normal
|
Average Temperature
|
Departure from Normal |
|
Charleston
|
1.04" |
-1.44" |
7.7" |
+0.2" |
26.5F |
-1.9F |
| Danville |
1.24"
|
-0.97" |
1.6" |
-4.8" |
23.8F |
-3.3F |
| Decatur |
0.98"
|
-1.16" |
2.3" |
-2.5" |
24.1F |
-3.4F |
| Effingham |
1.24"
|
-1.65" |
3.3" |
-1.2" |
25.4F |
-2.6F |
|
Flora
|
3.03" |
-0.01" |
3.0" |
-1.0" |
25.8F |
-3.7F |
| Galesburg |
0.79"
|
-0.72" |
2.0" |
-5.8" |
19.0F |
-2.9F |
|
Havana
|
1.66" |
-0.42" |
1.2" |
-7.0" |
|
|
|
Jacksonville
|
1.38" |
-0.21" |
1.4" |
-3.1" |
24.6F |
-1.8F |
| Lincoln |
0.73" |
-1.20" |
2.9" |
-3.0" |
23.7F |
-2.2F |
|
Normal
|
0.78"
|
-1.35" |
4.4" |
-2.7" |
21.3F |
-2.6F |
|
Olney
|
1.68" |
-1.37" |
3.7" |
-0.3" |
25.4F |
-3.7F |
|
Paris
|
1.12" |
-1.27" |
3.4" |
-5.5" |
21.5F |
-4.7F |
| Peoria |
1.74"
|
-0.04" |
3.5" |
-3.4" |
23.3F |
-1.8F |
| Springfield |
0.53"
|
-1.29" |
1.6" |
-4.8" |
25.8F |
-0.8F |
|
Tuscola
|
0.98" |
-1.12" |
2.2" |
-3.9" |
22.2F |
-3.0F |
| Urbana |
1.10"
|
-0.95" |
3.5" |
-3.3" |
22.7F |
-2.1F |
Climatological Statistics:
The following links are the monthly and seasonal climate summaries for area cities. Only the summaries for Peoria, Springfield, and Lincoln are considered "official", meaning they are the station of record for their respective locations. The other summaries are "supplemental", meaning another location in the area is the official climate station for the city.
Climate data for other cities is available at http://w2.weather.gov/climate/xmacis.php?wfo=ilx

