Week 5: How are Severe Thunderstorm and Tornado Warnings Issued?
Once a convective watch is in place, National Weather Service offices have the responsibility of monitoring Doppler radar and issuing any necessary warnings for their local areas. The decision to warn on a particular storm requires detailed analysis of both the overall environment, as well as the storm cell itself. Forecasters must be able to process a large amount of data in a short amount of time in order to make a concise and accurate warning decision. Speed is the key to this process...as the faster a decision is made, the faster the message can be disseminated to our media and public partners.
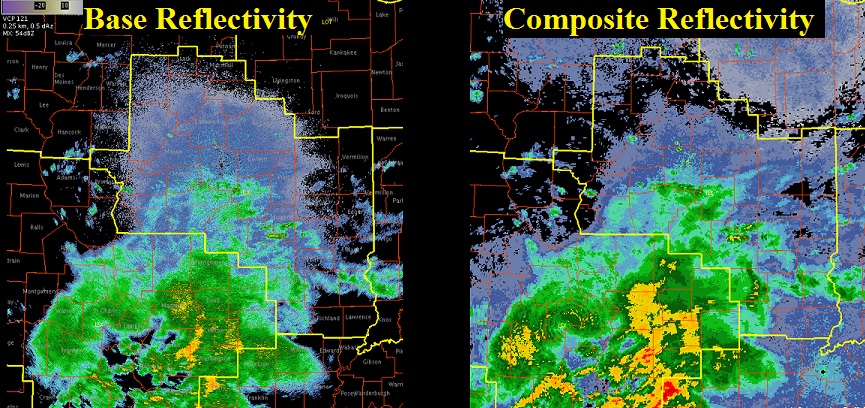
There is no one-stop product that can be used in every warning decision scenario. Instead, forecasters must develop a conceptual model based on current and expected atmospheric conditions and draw upon their past experiences in order to decide which radar products to analyze. Two of the most common products are base reflectivity and composite reflectivity, both of which are available on the NWS Lincoln Radar Page. When the Doppler radar scans the atmosphere, it sends out pulses of energy that are then reflected off hydrometeors such as raindrops, snowflakes, and ice crystals. The amount of energy returned gives us an idea of how large the hydrometeors are. Several elevation slices are scanned, starting at 0.5 degrees and working up to a maximum of 19.5 degrees. The Base Reflectivity image below on the left shows the energy returned to the radar at the lowest 0.5 degree scan, while the Composite Reflectivity image on the right shows the highest returned energy at any elevation scan from 0.5 up to 19.5 degrees. Note the higher reflectivity (orange and red colors) on the composite product that are not seen on the base product. This gives forecasters a quick overview of what's going on higher up in the storm, rather than just at the lowest elevation slice.
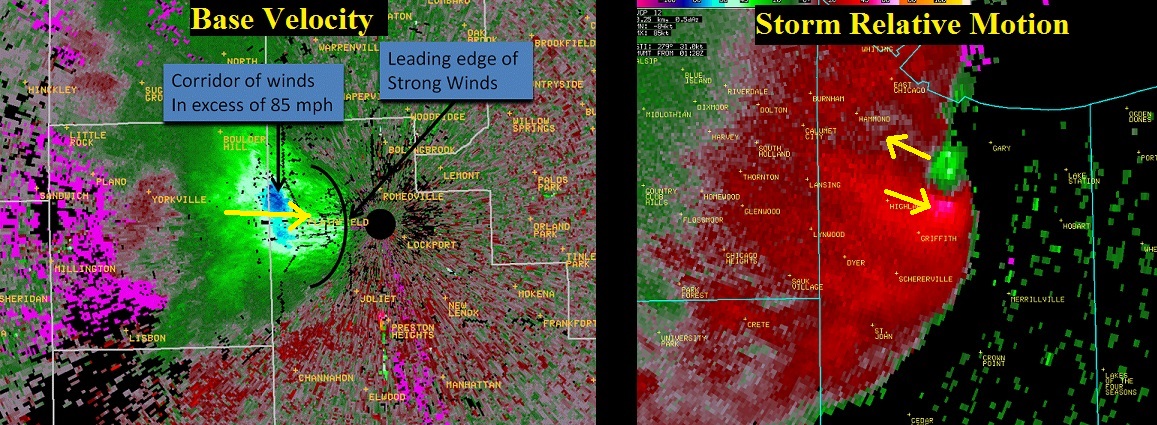
Doppler radar also has the ability to detect motion within storms by measuring the radial velocity of hydrometeors. Radial velocity is motion directly toward or away from the radar beam and is particularly useful in identifying frontal passages, downburst winds, and circulations within thunderstorms. The base velocity product on the left below shows very stong thunderstorm winds approaching NWS Chicago. The black dot just south of Romeoville is the location of the radar. Greens and blues show motion directly toward the radar, while reds and oranges indicate motion away from the radar. Note the maximum inbound velocities approaching the radar site from the west. Storm relative motion is the velocity seen by the radar minus the actual forward motion of the storm itself. This gives meteorologists an excellent snapshot of circulations within the storm that might otherwise be masked by the base velocity product. The storm relative motion product below on the right shows a tight circulation in northwest Indiana. The NWS Chicago radar site is off to the upper left of the image, and once again green colors indicate motion directly toward the radar, while red shows motion away from the radar. Note the strong inbound (green) and outbound (red) velocities immediately next to each other, suggesting strong rotation in the storm just southwest of Gary, Indiana.
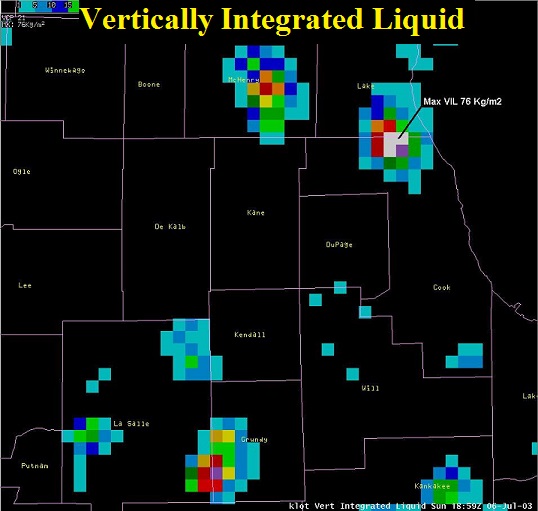
Another commonly used Doppler radar product is vertically integrated liquid (VIL). VIL converts reflectivity into an equivalent liquid water content contained within the column based on drop-size distribution studies. As such, it can be used to determine the presence of either very large water drops or hailstones within the storm. Below is an image showing very high VIL values along the Cook/Lake County border in northeast Illinois. Based on the height of the freezing level and other meteorological paramters, this could be an indication of large hail.
Once Doppler radar, observational data, or reports from storm spotters supports the immediate threat of severe weather, NWS meteorologists use software called WarnGen to issue the warning. The process has been streamlined for both ease of use and timeliness. Once the software is activated, the forecaster is prompted to drag a dot on their computer screens to the center of the storm. With a few quick adjustments, an accurate track of the storm is obtained and a warning box is created.
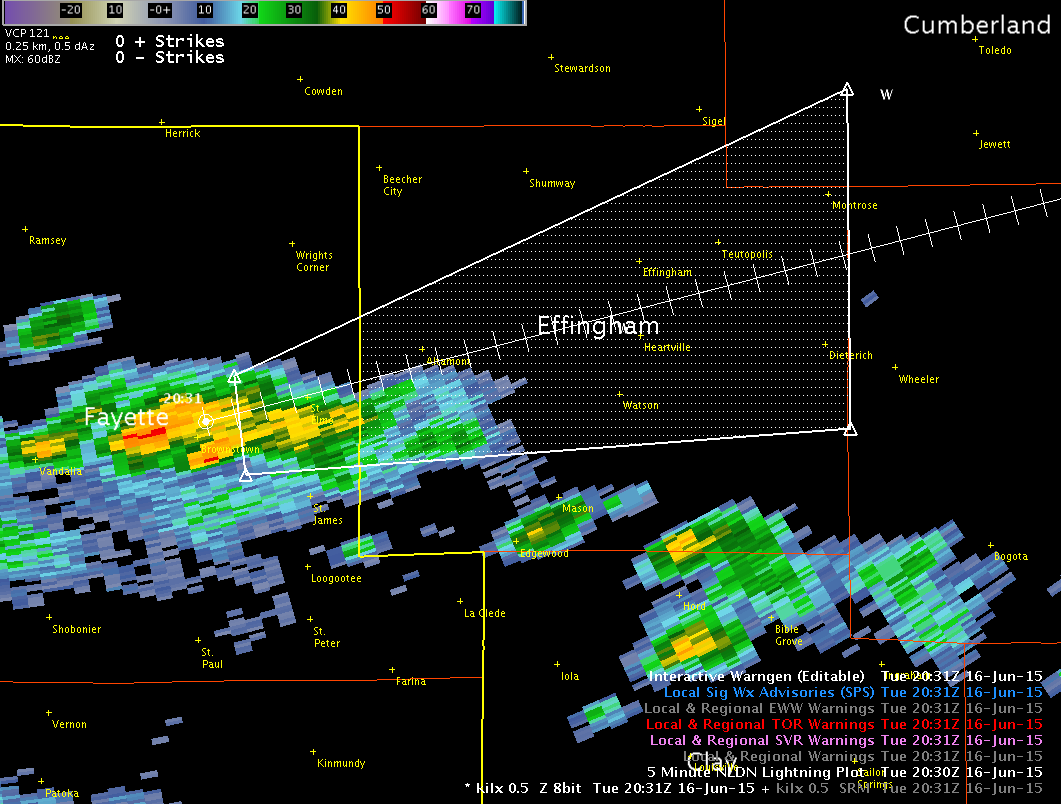
An accompanying template box allows the forecaster to decide what type of warning to issue, how long it should be in effect, what specific types of hazards to expect, and a host of other storm and safety-related items. After the appropriate selections have been made, the "Create Text" box is pushed and the warning is disseminated. It is then automatically relayed to NOAA Weather Radio and to the NWS Lincoln homepage.

Week 4: How are Severe Thunderstorm and Tornado Watches Issued?

