Overview
|
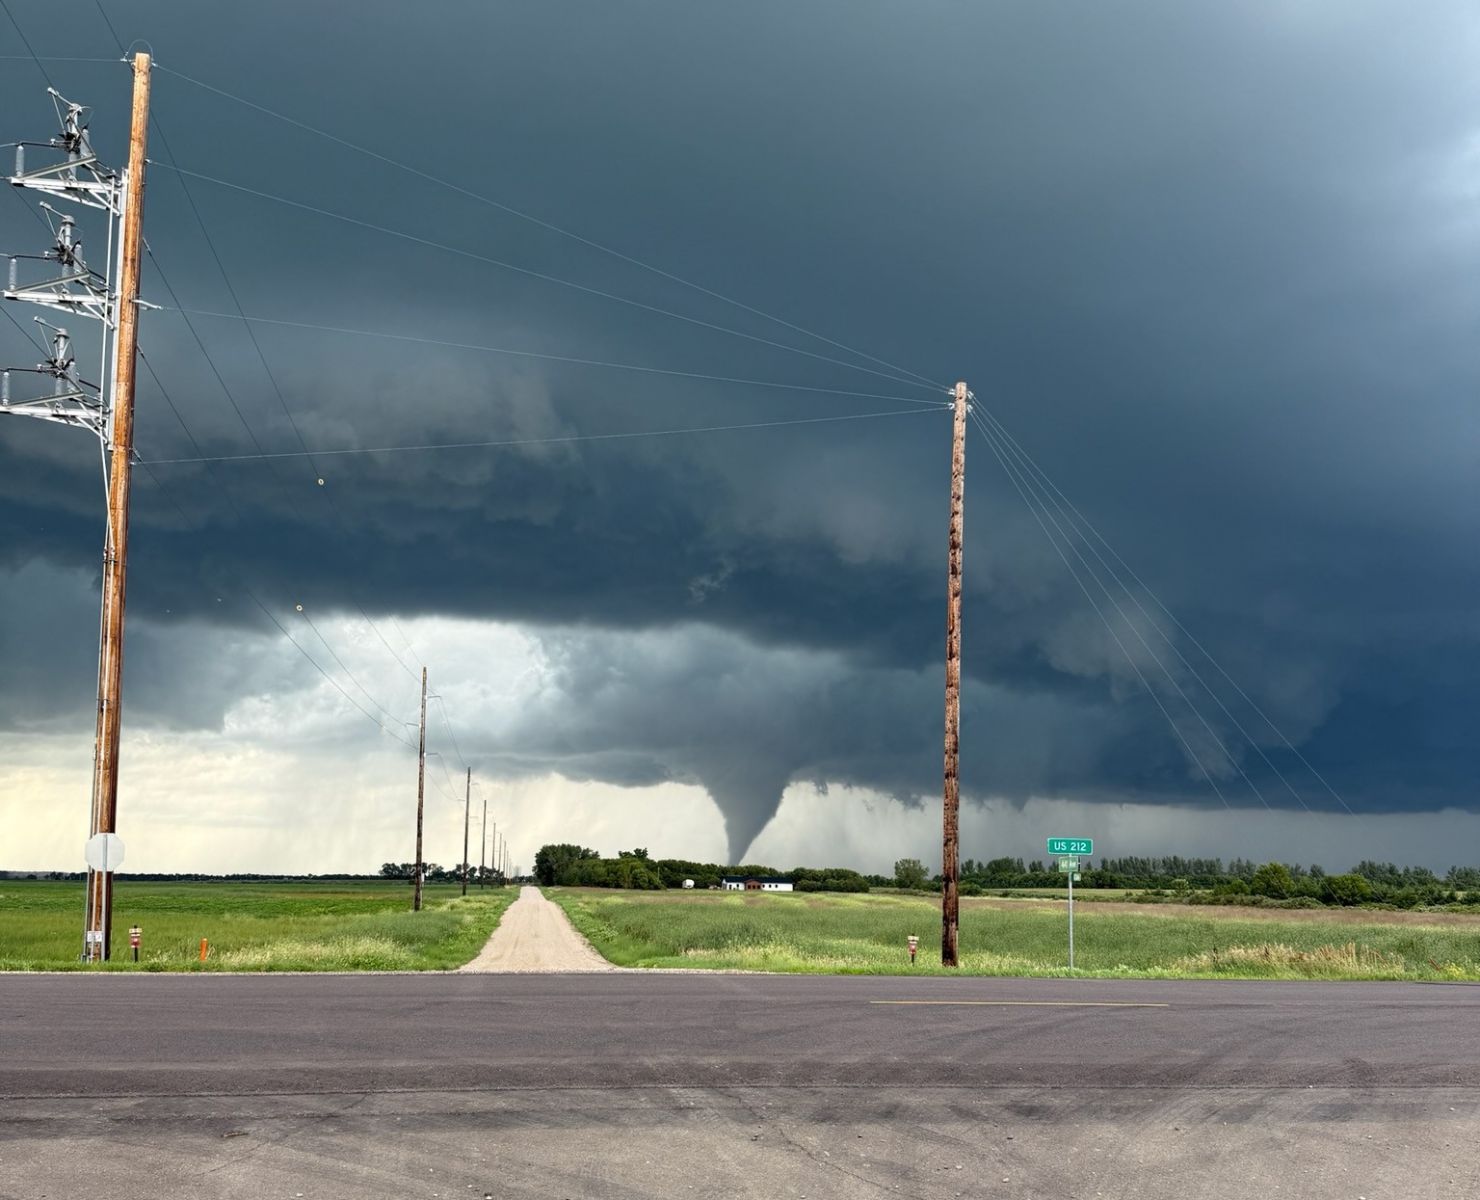
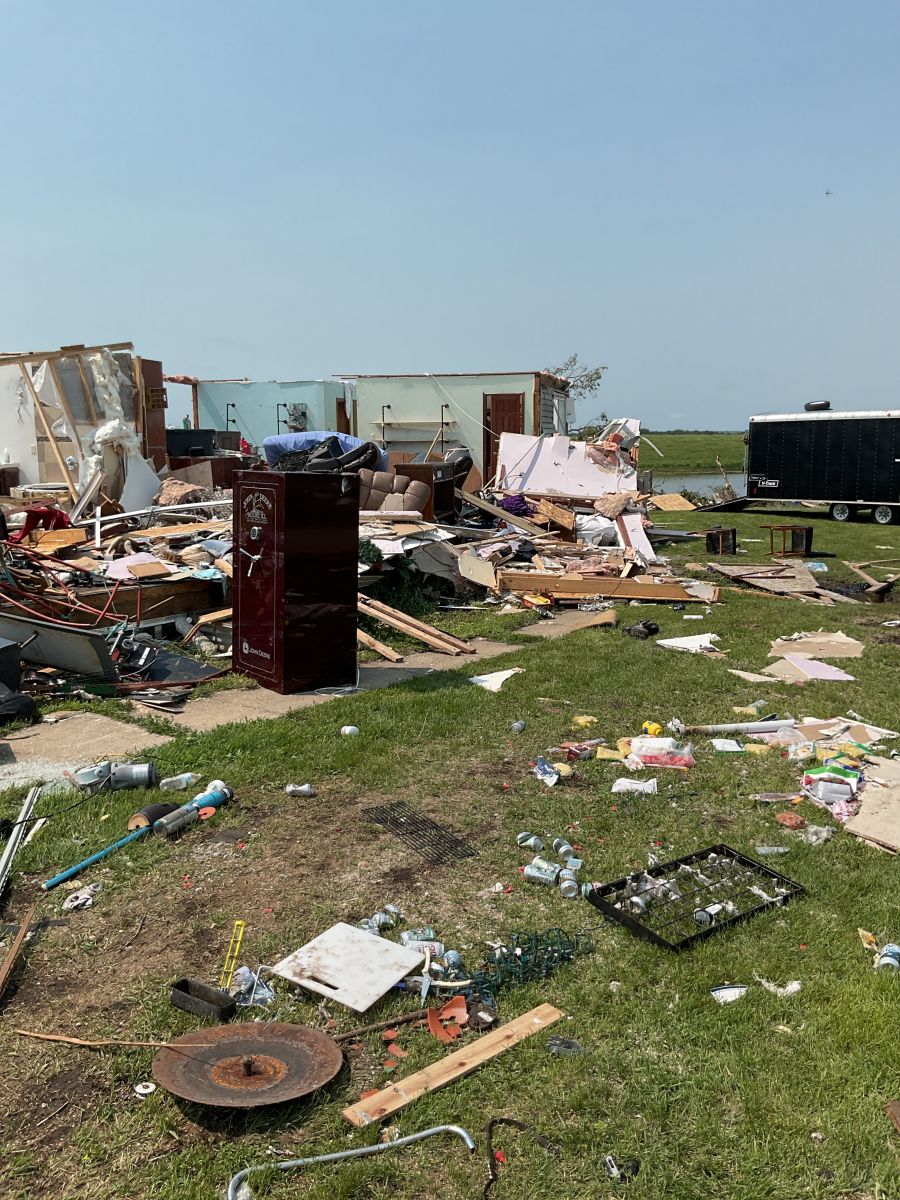
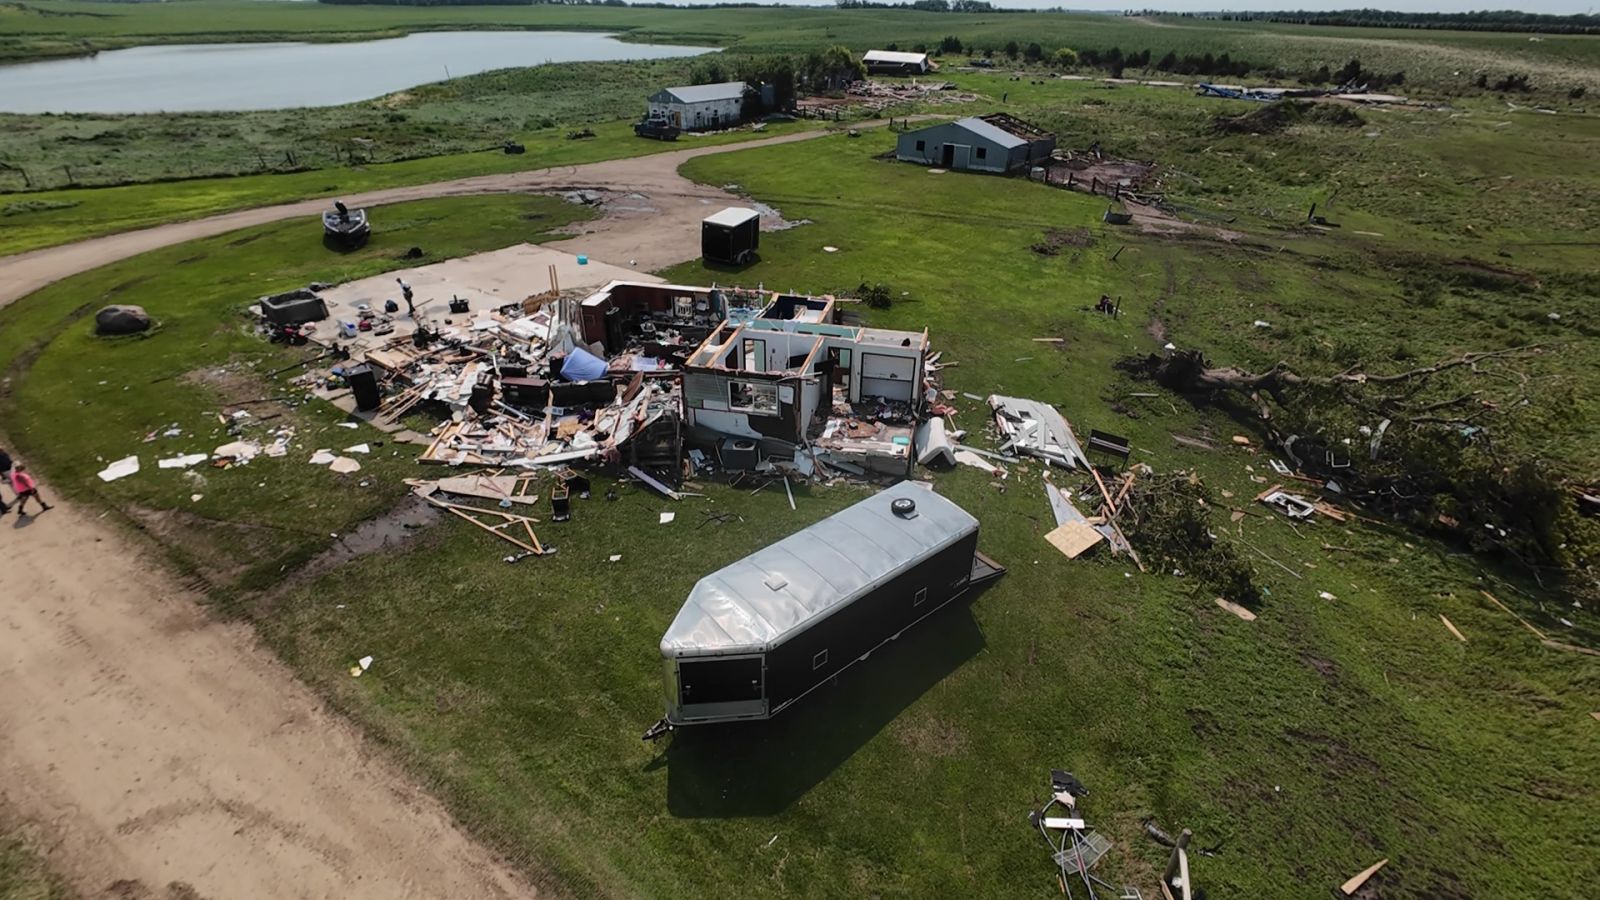
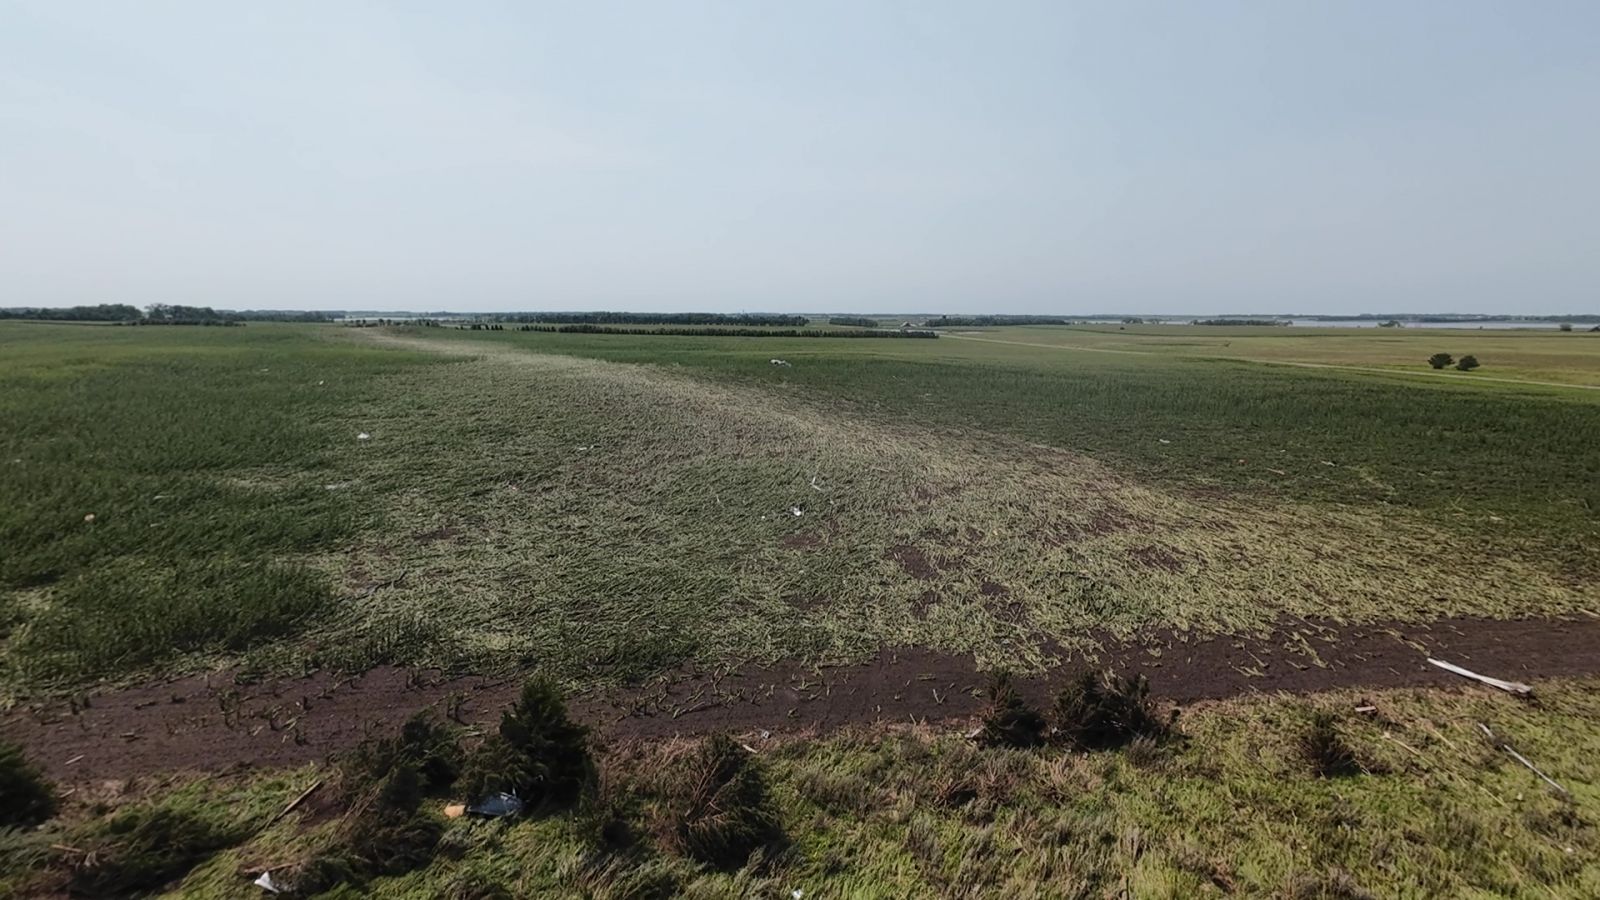
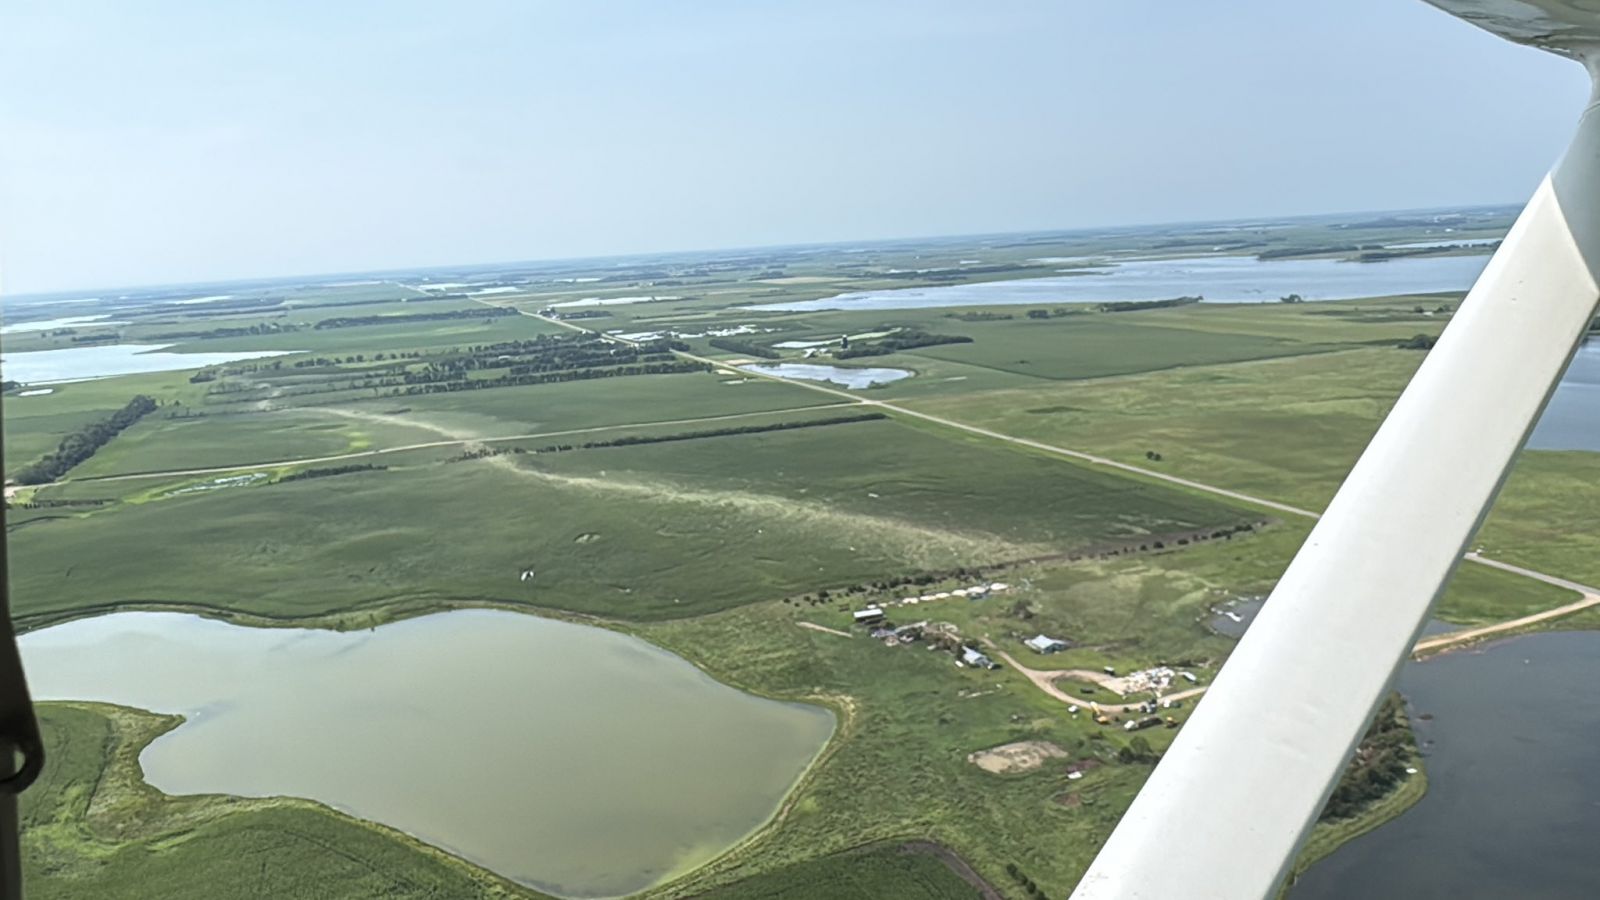
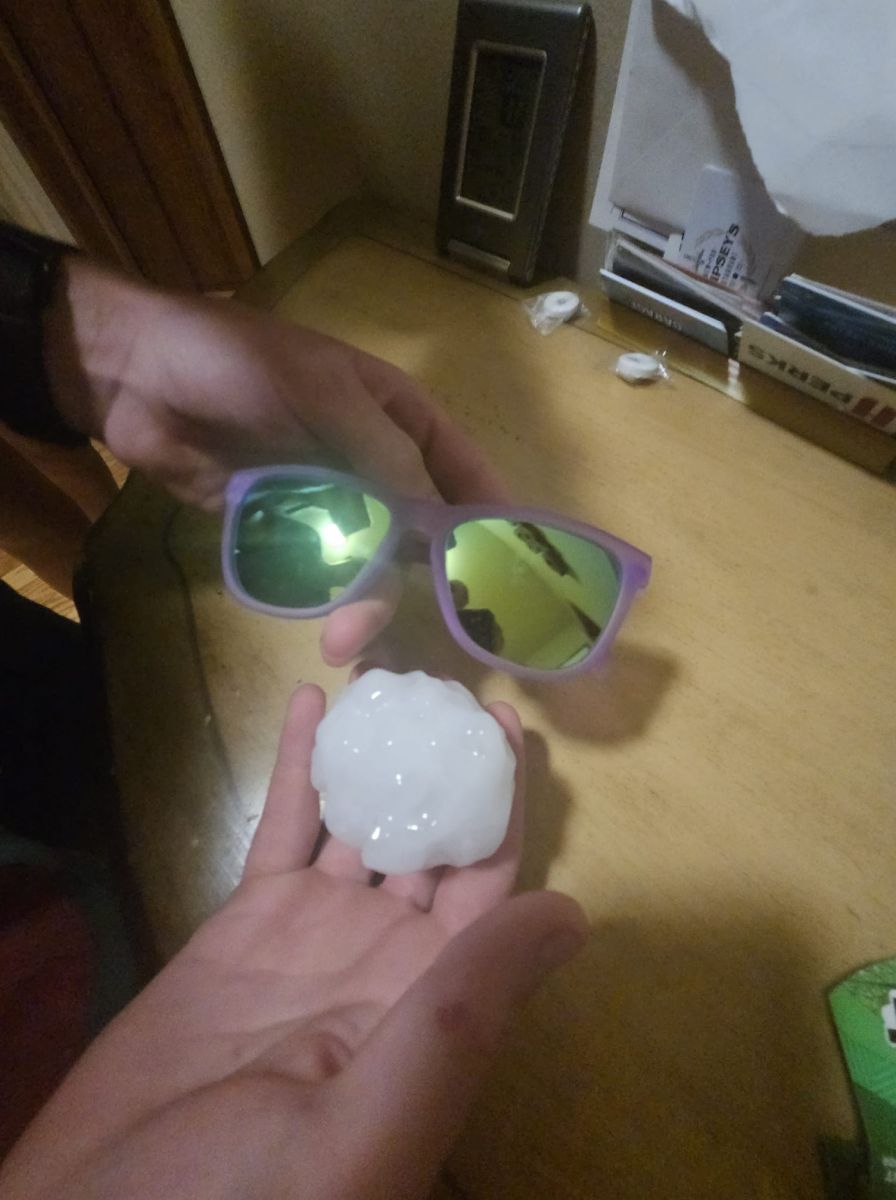
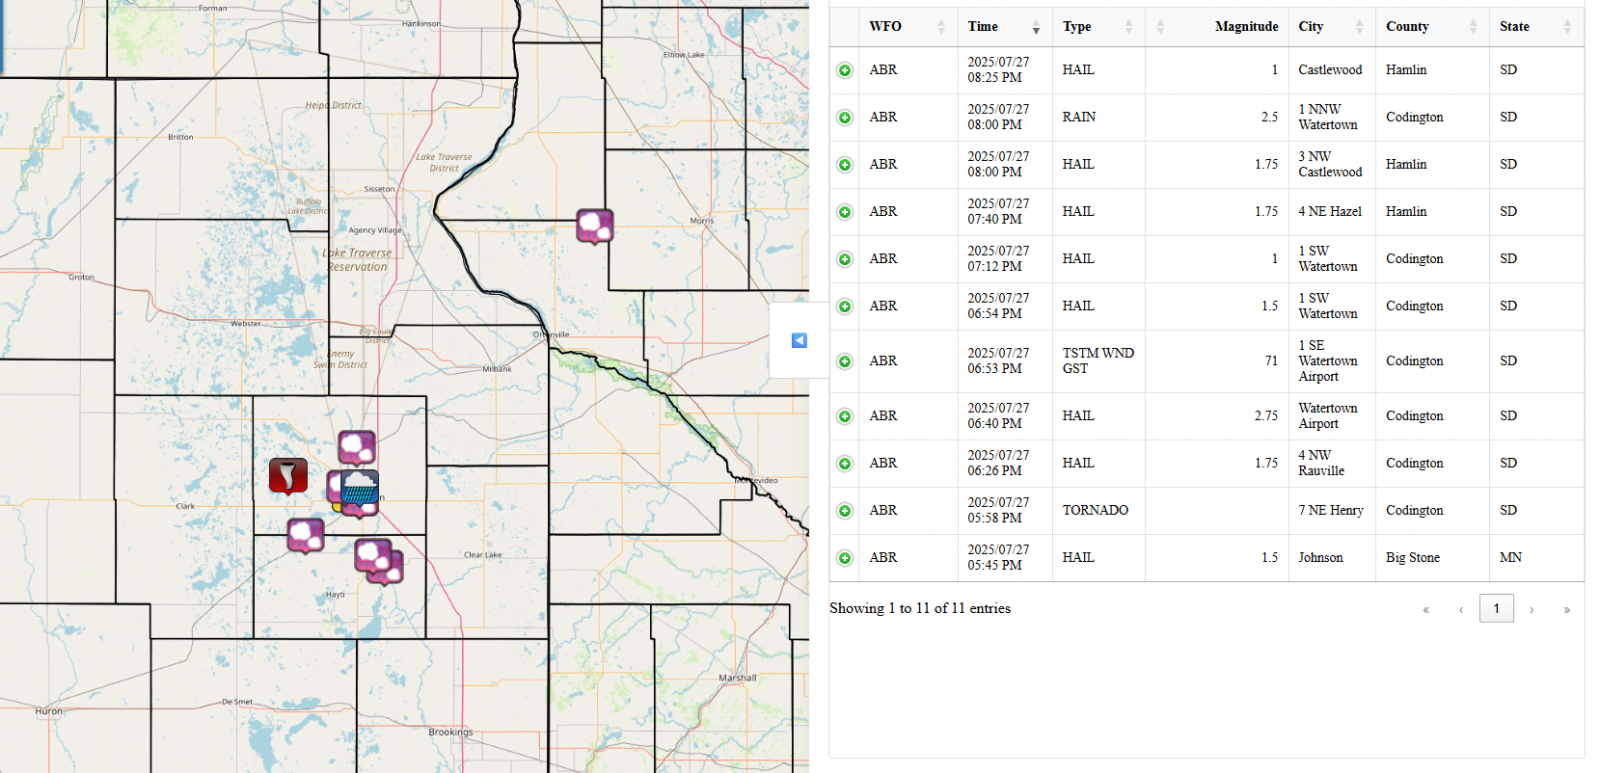
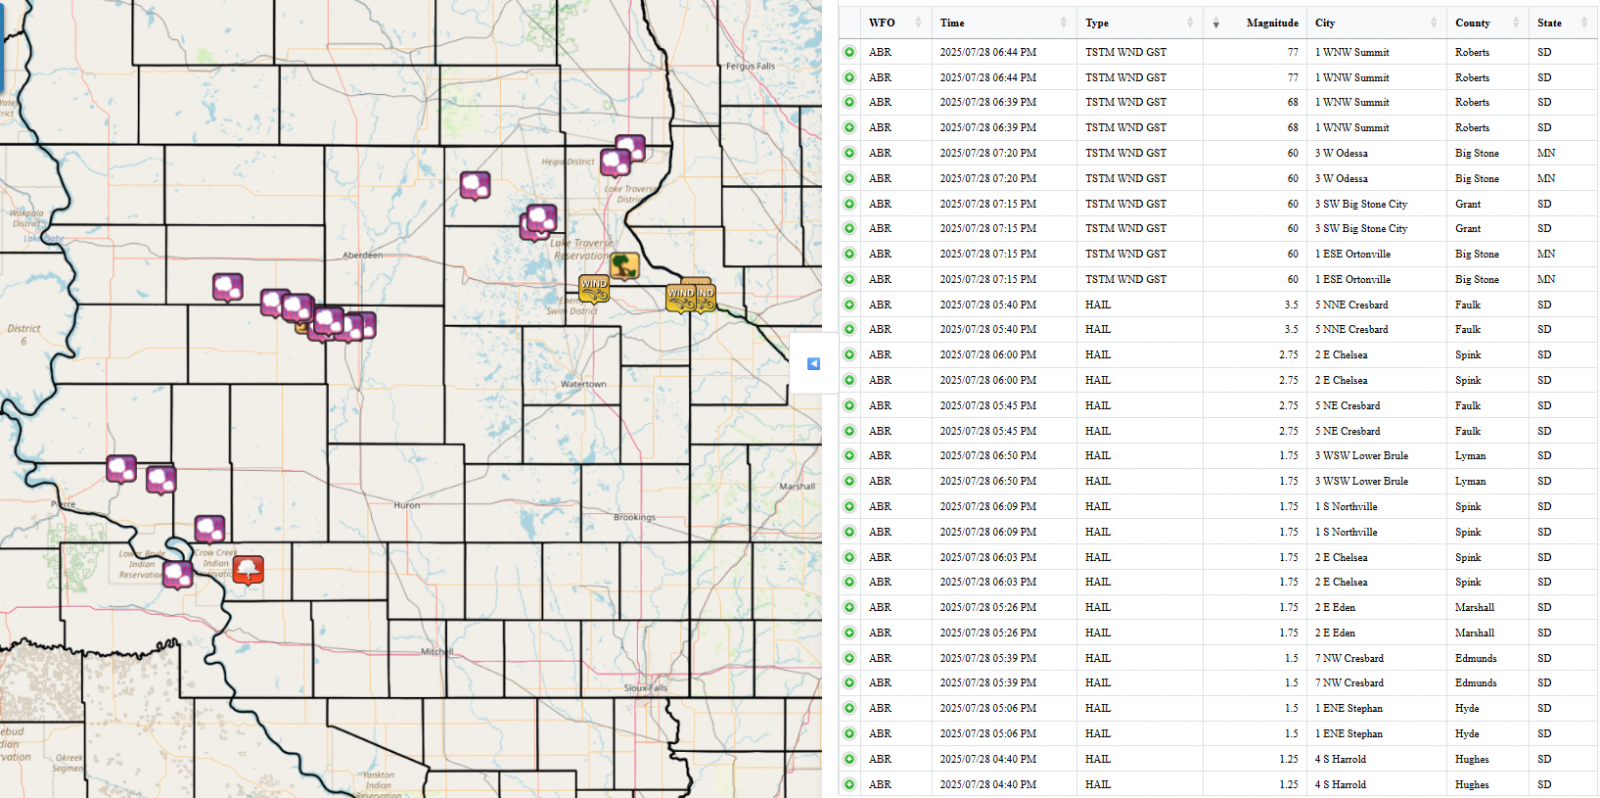
A low pressure system and nearly stationary front was the focus for severe weather on July 27 and 28. Over the two days the region experienced tornadoes, hail, straight-line winds and flooding. The evening of July 27th, storms formed along the frontal boundary in an environment suitable for tornado development. Around 5:55 pm a tornado touched down northeast of Henry, South Dakota. This tornado would track just west of a farm, but close enough to destroy a house and many other structures on the property. The 21 minute long tornado traveled just shy of 4 miles and a damage survey concluded the tornado was rated a high end EF2 with peak winds near 135 mph. Residents were not home at the time of the tornado. Click on the track in the map below for a complete description. High winds in Watertown, SD were also reported, along with large hail and flooding across Codington and Hamlin Counties. Additional flooding also occurred further north in Big Stone and Traverse counties in west central Minnesota. Another round of severe weather would develop on July 28th. Individual storms would produce large hail, with the largest stones reported in Faulk County, near Cresbard. Hail up to 3.5 inches in diameter was reported in this area. Strong winds would also be reported in parts of northeast South Dakota. Photos also showed boats and pontoons flipped on Big Stone Lake from straightline winds. Flooding from July 27th was exacerbated with rains on July 28th. |
 Photo Credit: Alex Resel |
Tornadoes
Select a tornado from the table to zoom into the track and view more information. The default table view is limited to 8 tracks, but can be scrolled by a mouse wheel or dynamically expanded. Additionally, the table can fill the entire window by clicking the small circular expanding arrow icon at the very top right of the table and returned to its original size by clicking the button again. The side information panel that opens over the map can be closed using the "X" on the upper right corner of the pop-up. Zoom into the map and click damage points to see detailed information and pictures from the surveys.
|
NOTE: times shown below are local to your device's time zone. |

The Enhanced Fujita (EF) Scale classifies tornadoes into the following categories:
| EF0 Weak 65-85 mph |
EF1 Moderate 86-110 mph |
EF2 Significant 111-135 mph |
EF3 Severe 136-165 mph |
EF4 Extreme 166-200 mph |
EF5 Catastrophic 200+ mph |
 |
|||||
| Tornadoes that fail to impact any ratable damage indicators on the EF-Scale are rated EF-Unknown (EF-U) | |||||
Photos & Video
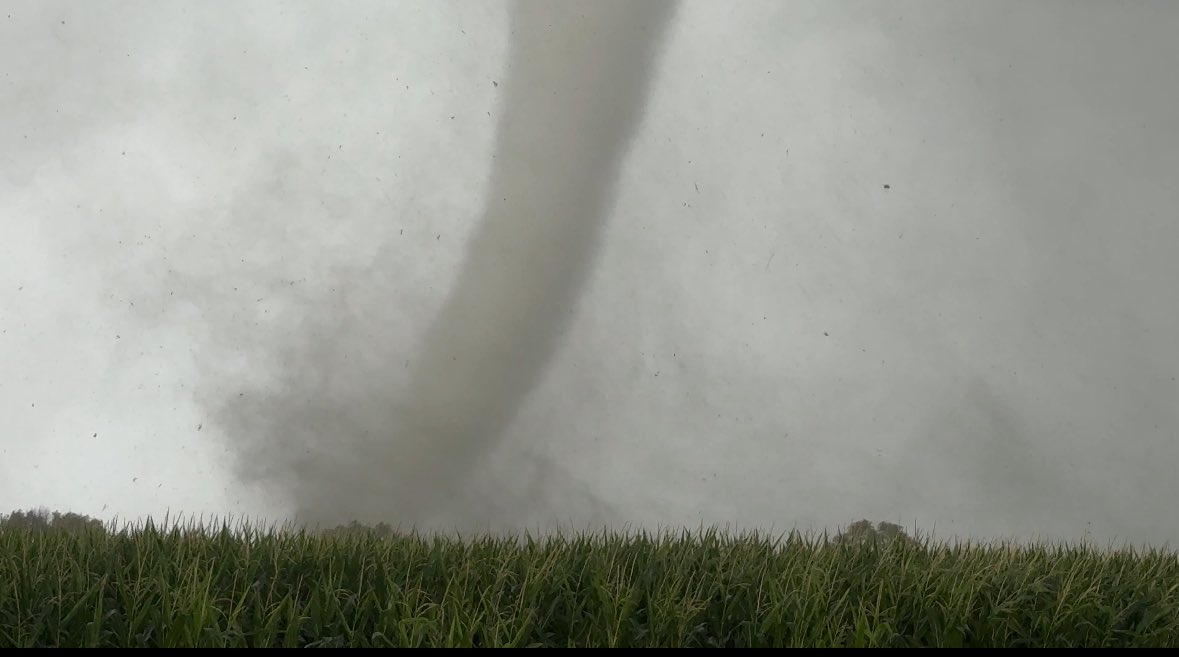
Tornado Northeast of Henry on July 27th
 |
|
 |
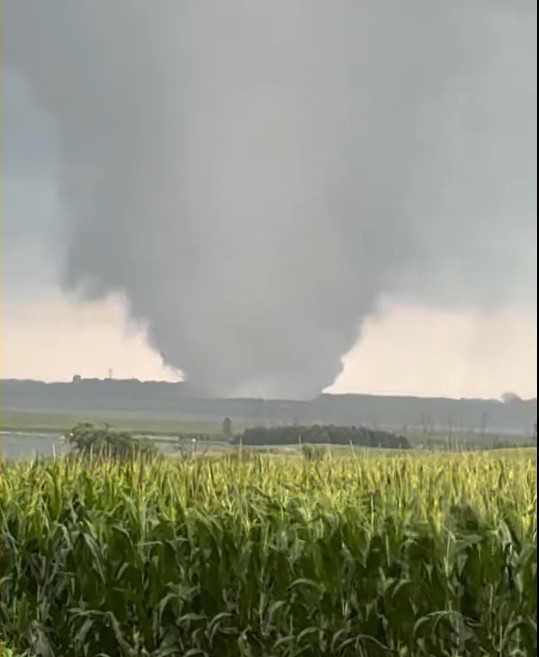 |
| Photo Shared by Alex Resel | Photo Shared by Avreigh Anderson | Photo Shared by Devin Pitts | Photo Shared by Tina Schaack Lammers |
Tornado Damage
 |
 |
 |
 |
| NWS Damage Survey | Codington County Sheriff's Office Drone Imagery | Codington County Sheriff's Office Drone Imagery | Photo Shared by Alex Resel |
Hail on July 27th
 |
 |
|
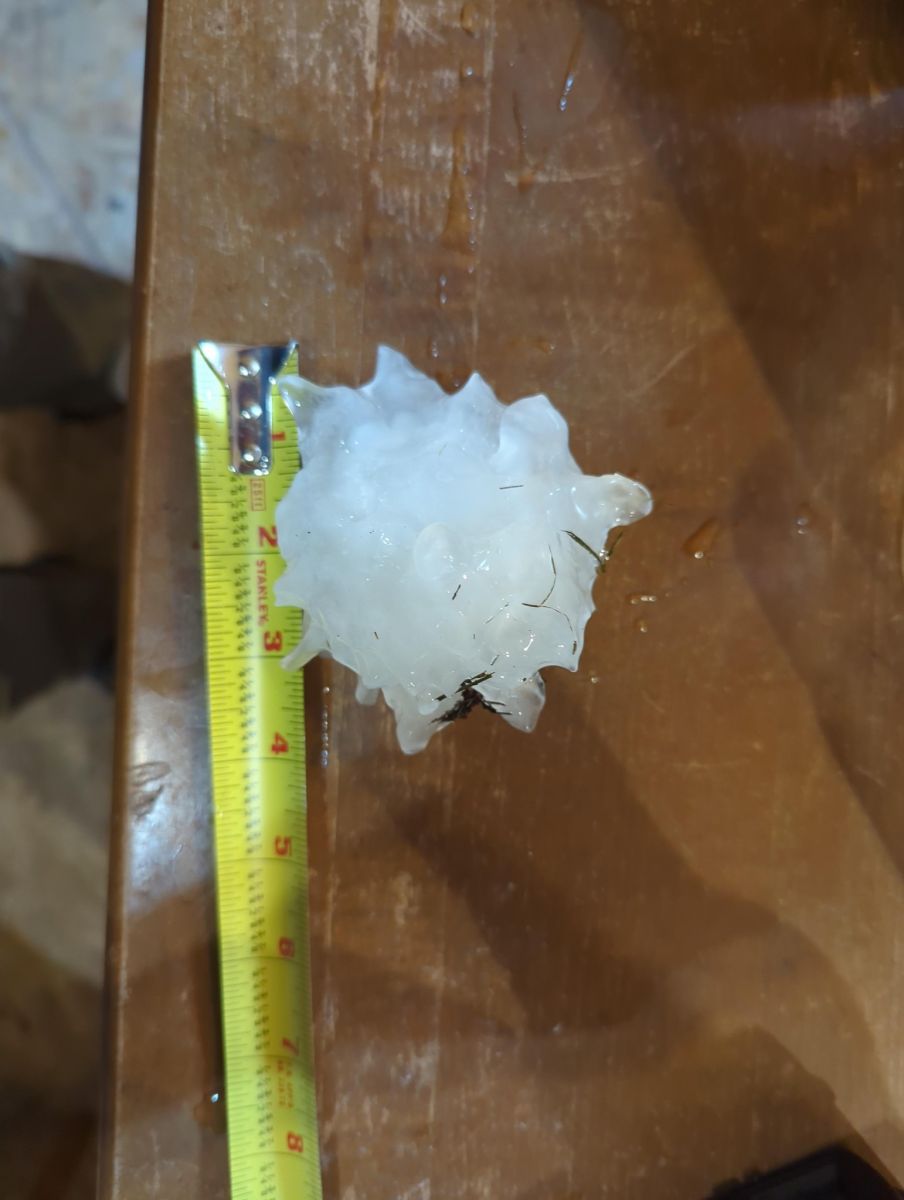
Hail stone from Watertown on July 27th. Photo Shared by Paige Sullivan |
Hail stone from Watertown on July 27th. Photo Shared by John Lunzman |
Hail on July 28th
 |
 |
 |
|
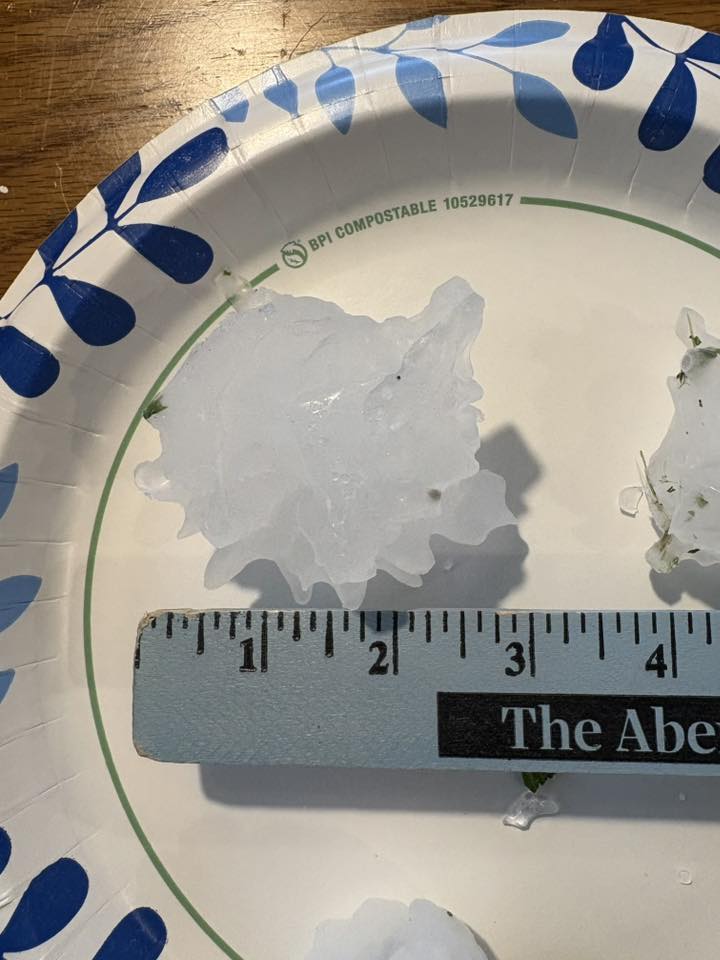
Hail stone from Cresbard on July 28th. Photo Shared by John Batteen |
Hail stone from Chelsea on July 28th. Photo Shared by Cheryl Finley |
Car damaged by hail in Chelsea on July 28th. Photo Shared by Cheryl Finley |
A Collection of YouTube Videos
Flooding
Add a written summary if needed.
Hydrographs
 |
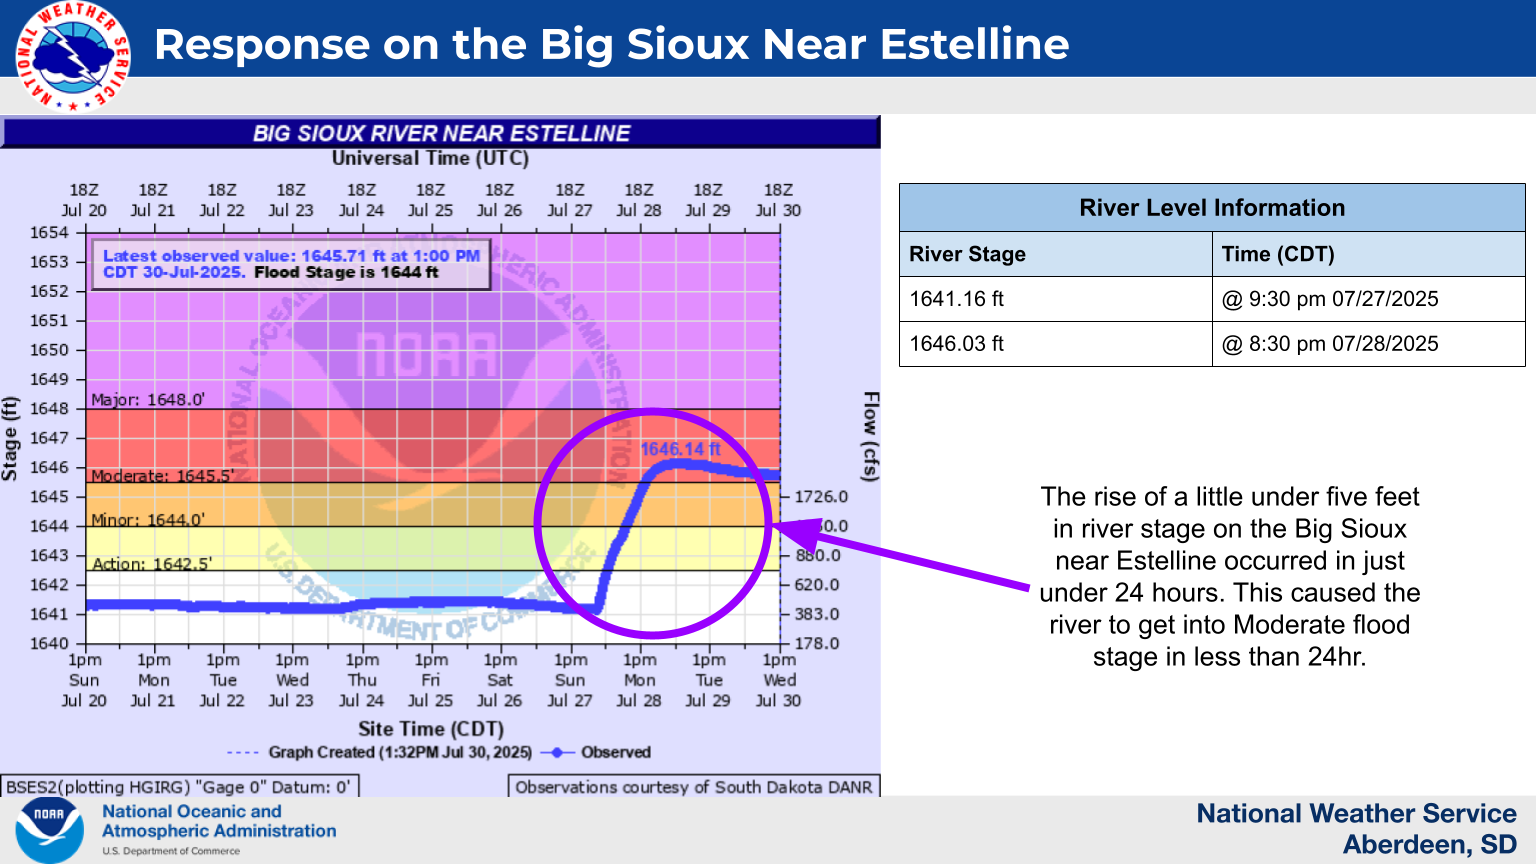 |
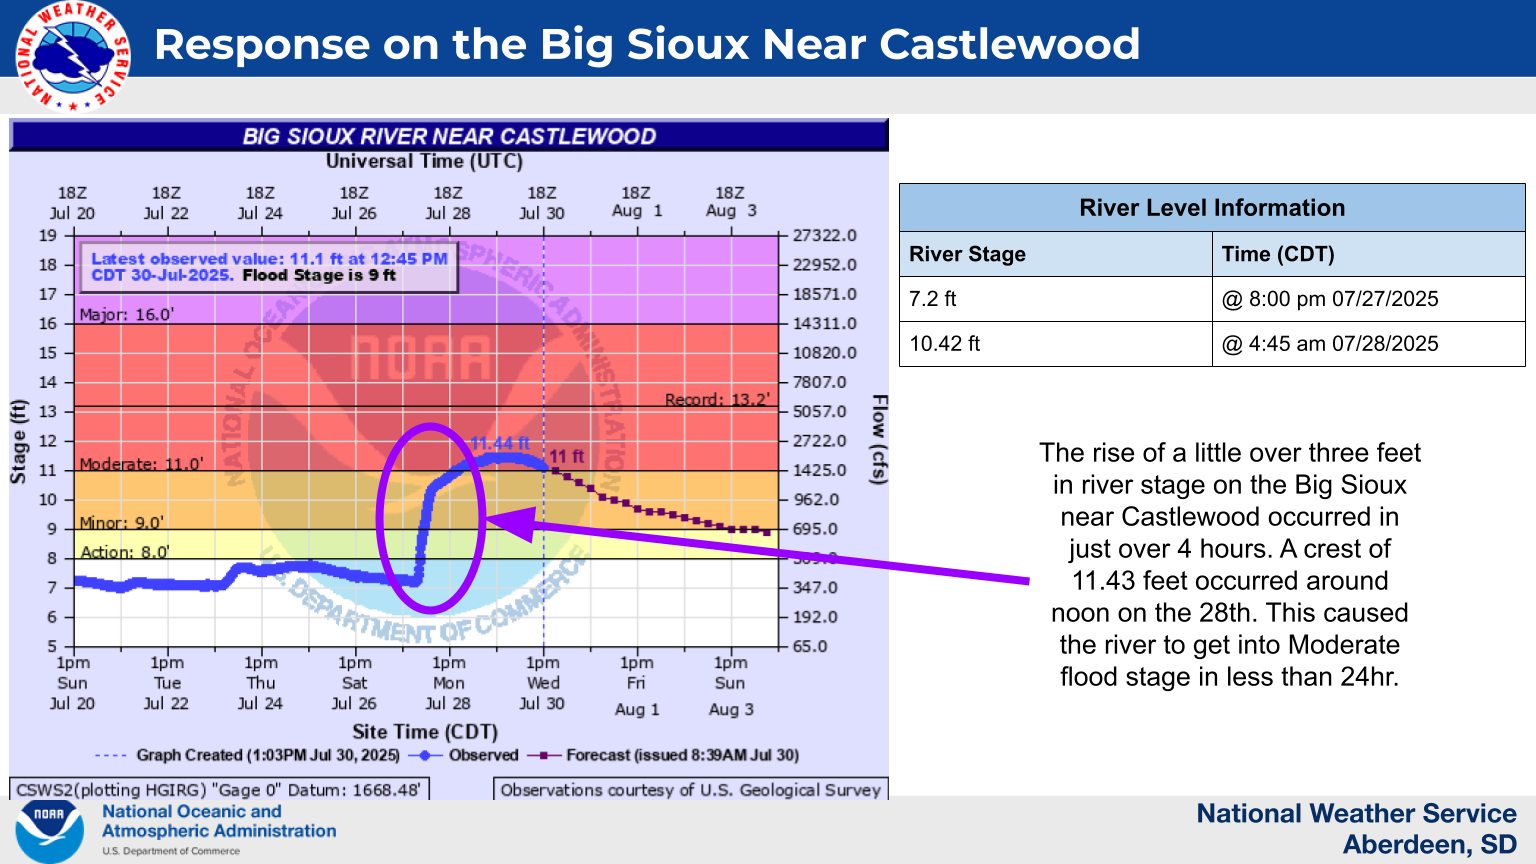
| Hydrograph from the Big Sioux River near Castlewood. | Hydrograph from the Big Sioux River near Estelline. |
 |
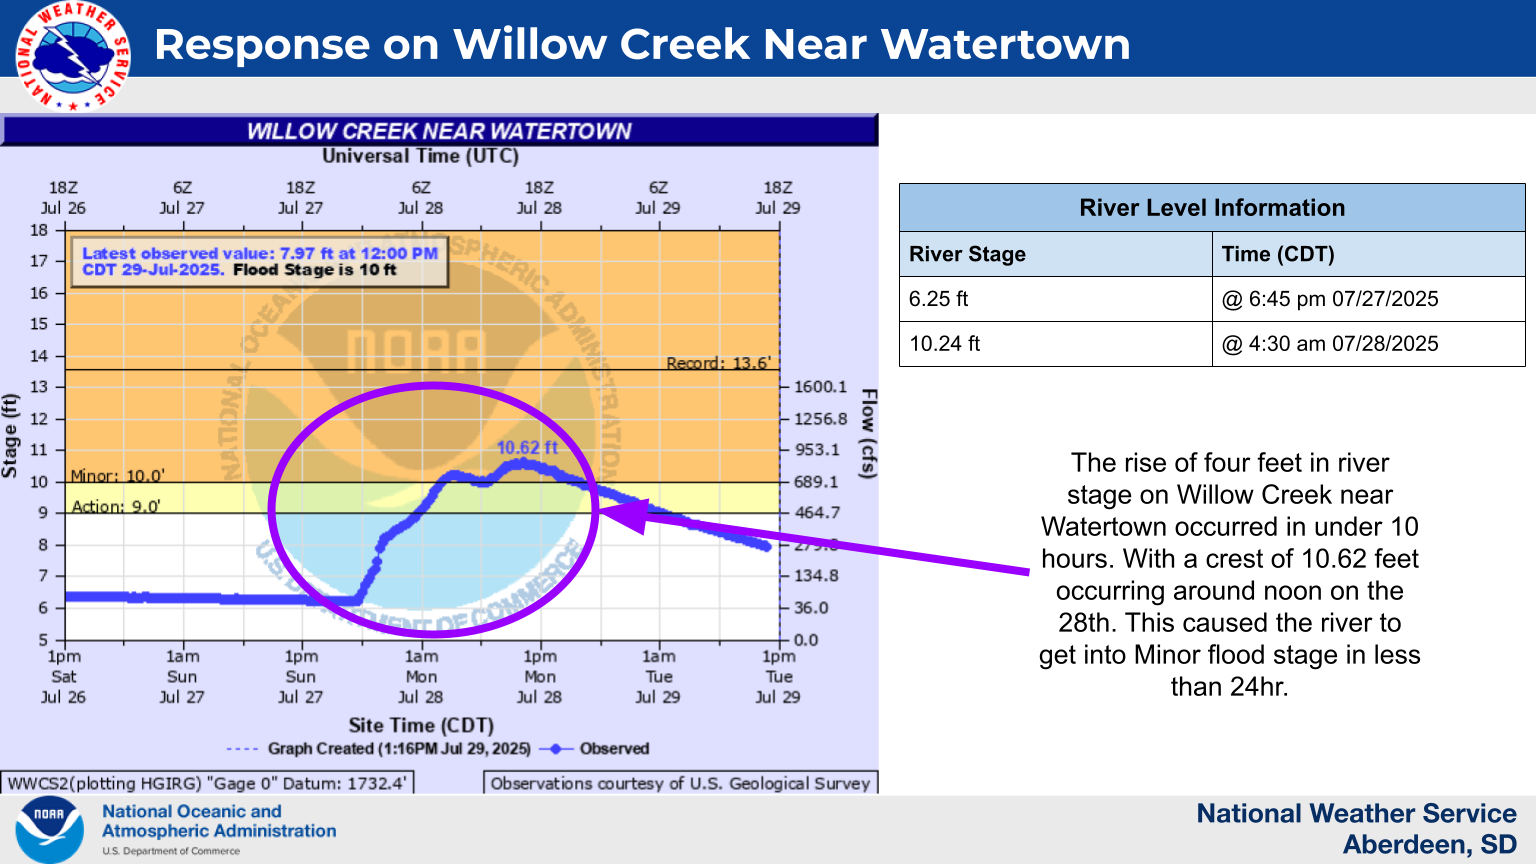 |
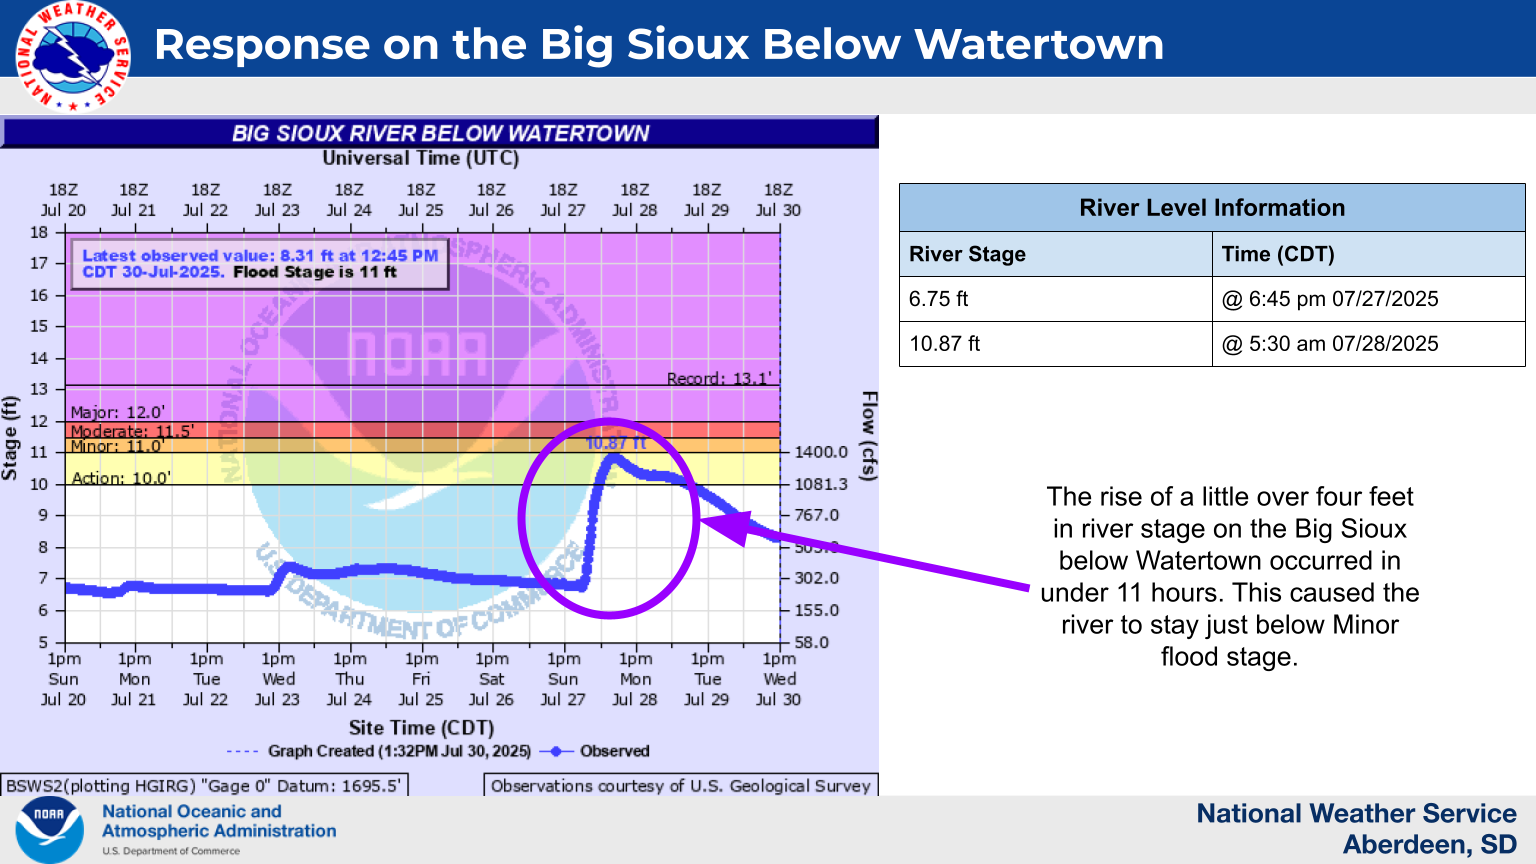
| Hydrograph from the Big Sioux River below Watertown. | Hydrograph from Willow Creek near Watertown. |
Radar
MRMS Reflectivity Loop of July 27th Tornado
|
MRMS Reflectivity loop of the July 27th storms from 4 to 10 pm CDT.
|
Radar Imagery of the July 27th Tornado
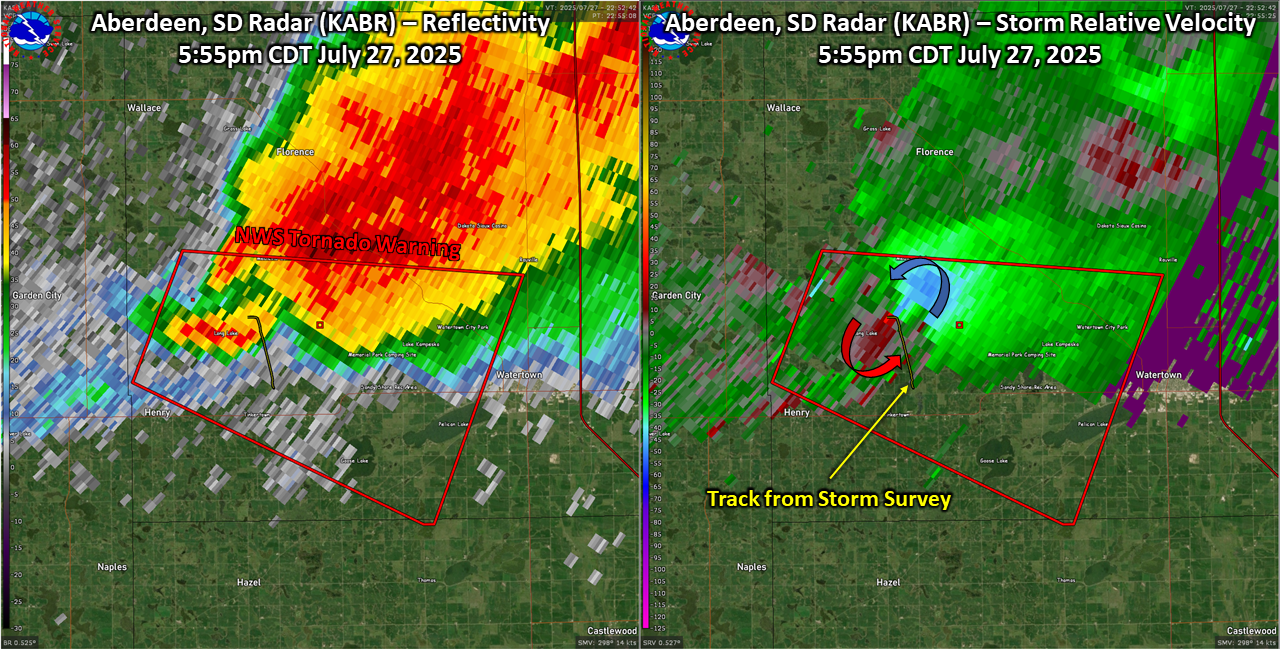 |
| Radar reflectivity and storm relative velocity at the start of the tornado path at 5:55 pm CDT. |
 |
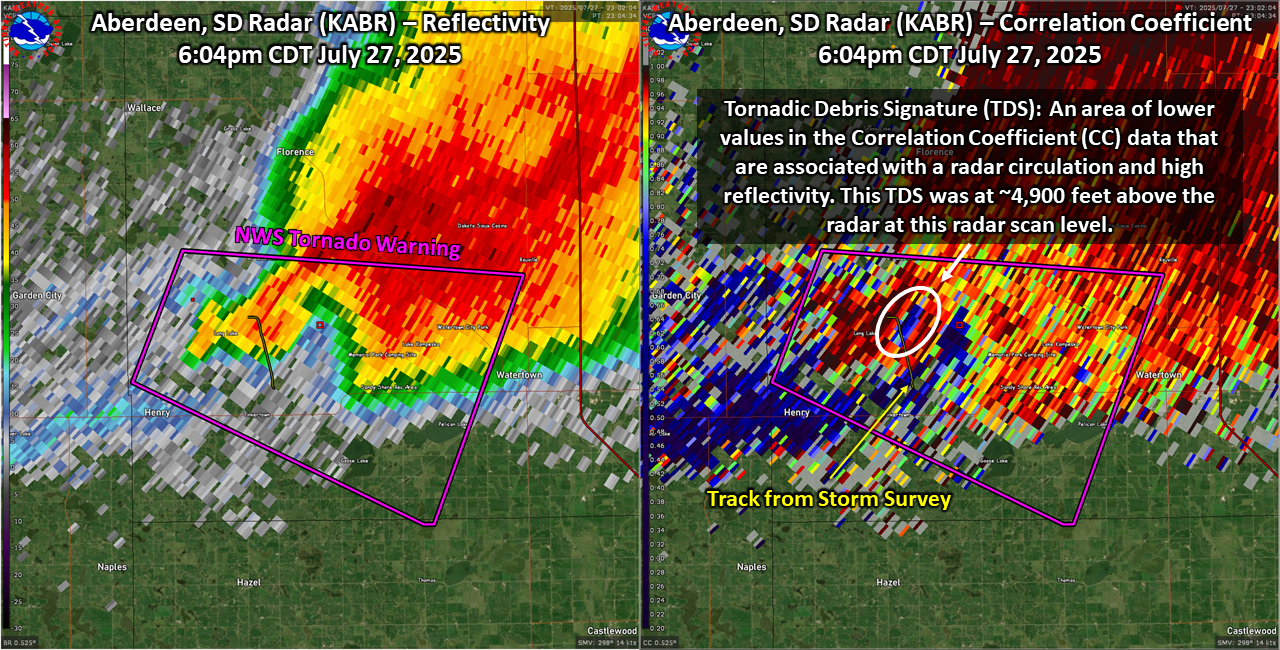 |
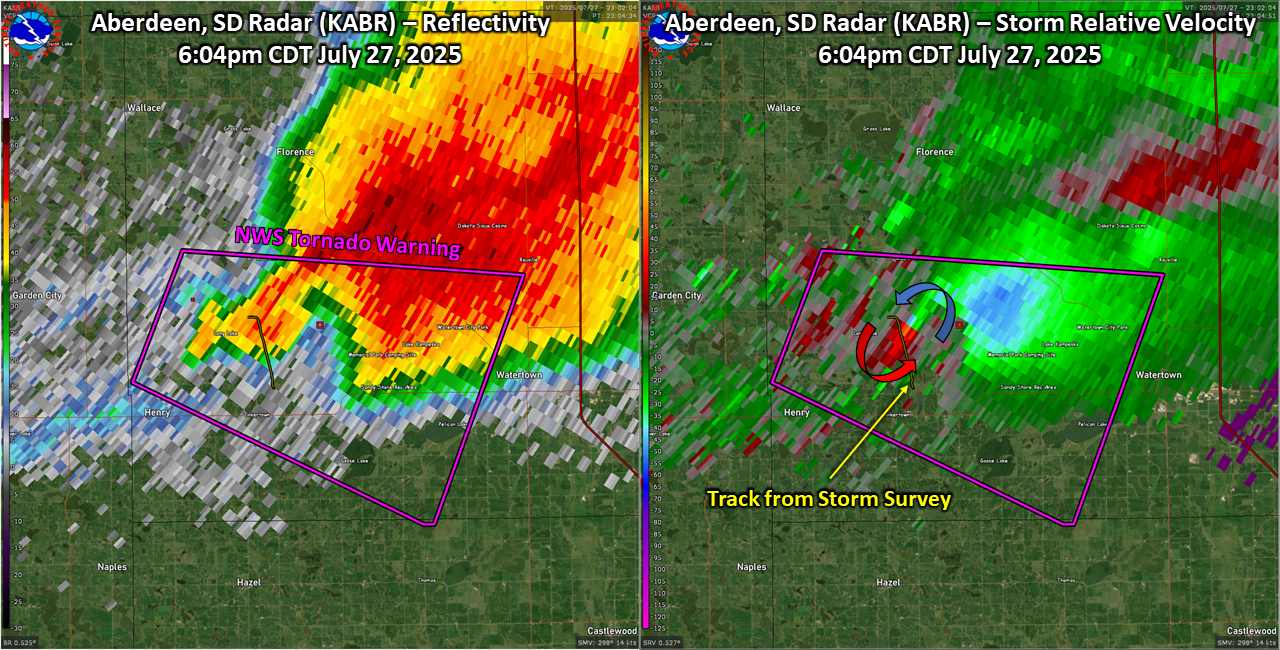
| Radar reflectivity and storm relative velocity at the peak of the tornado at 6:04 pm CDT. | Radar reflectivity and CC at the peak of the tornado at 6:04 pm CDT showing the tornado debris ball. |
Environment
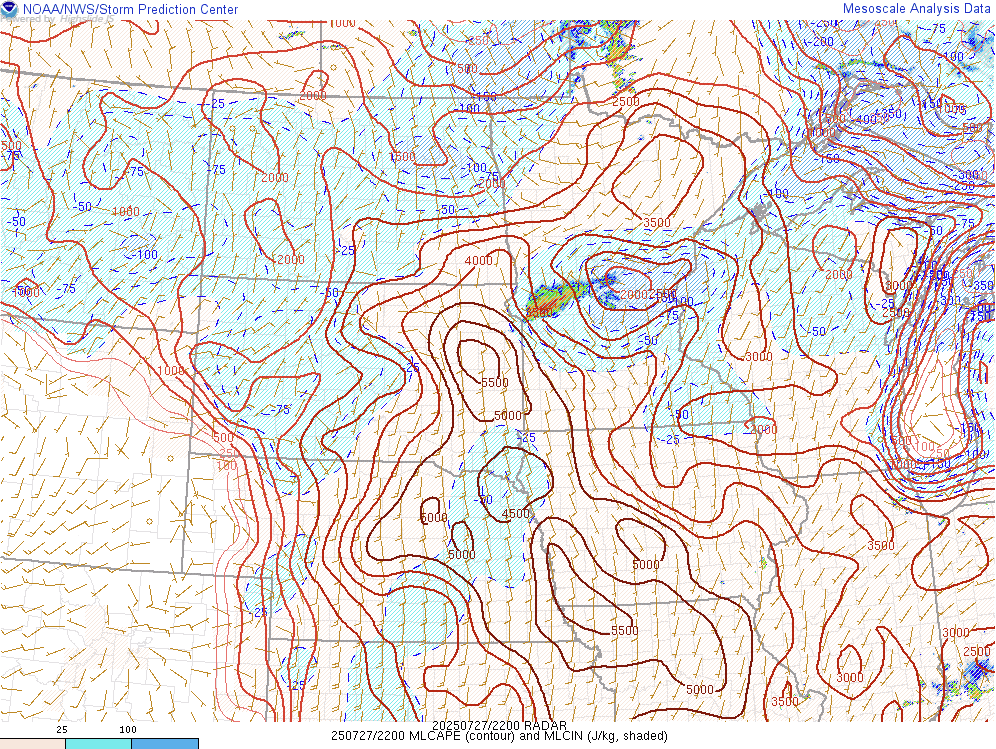
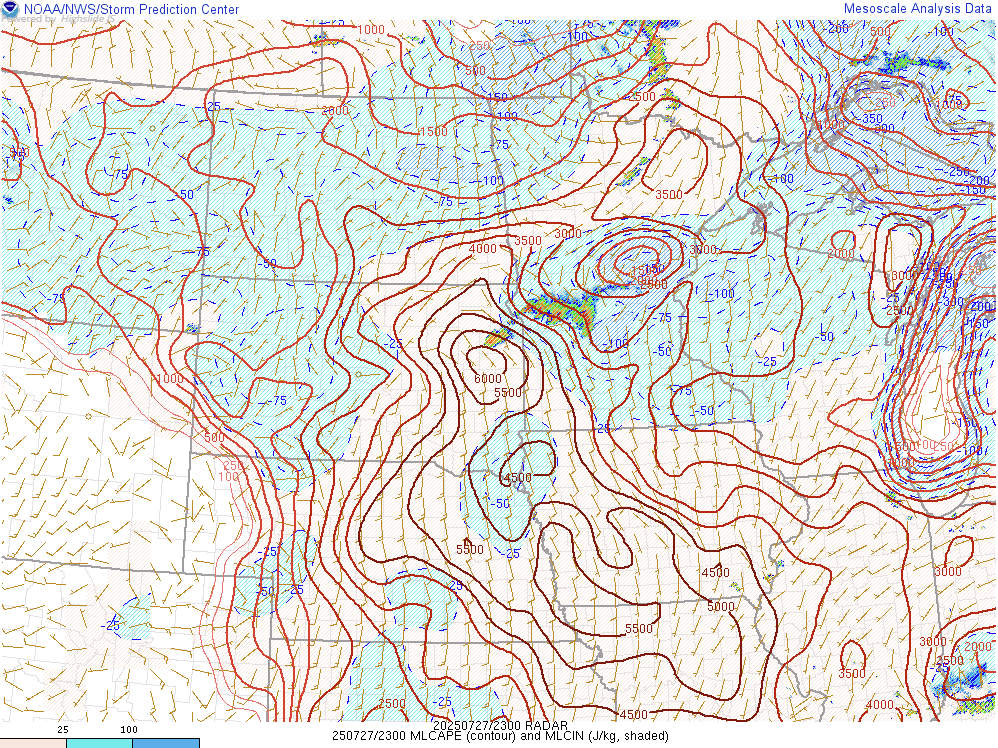
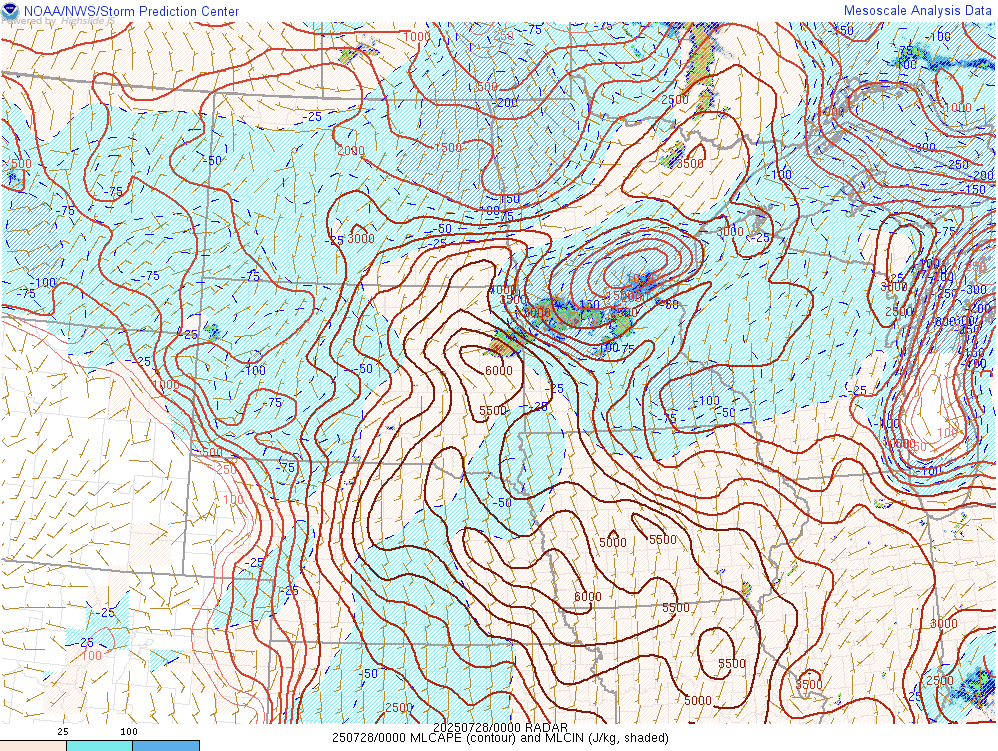
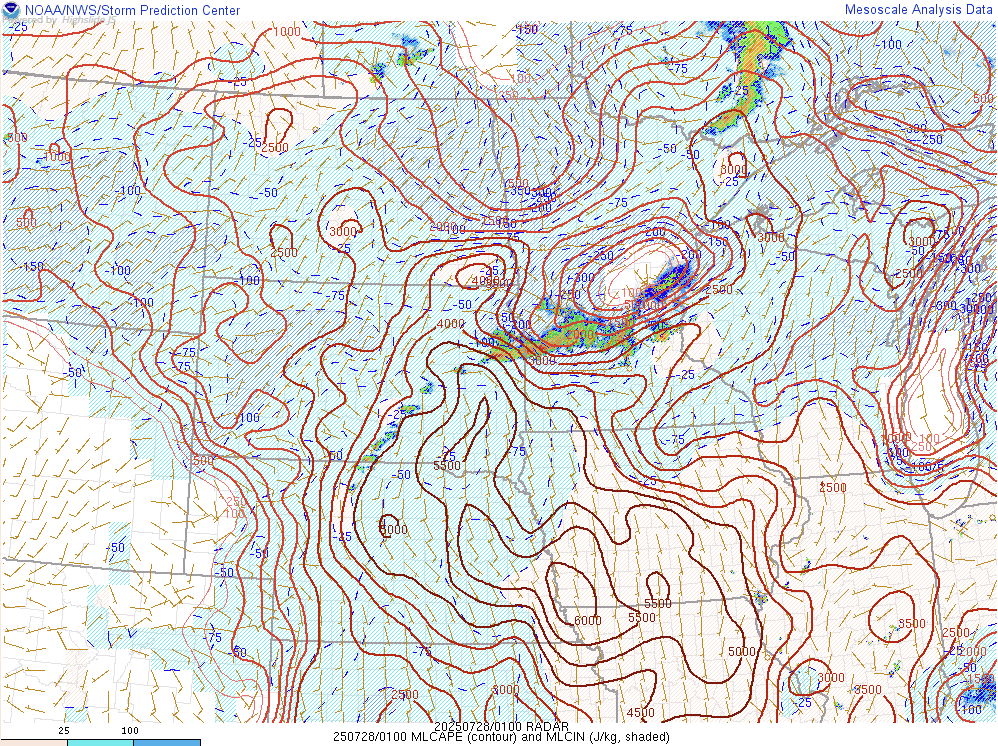
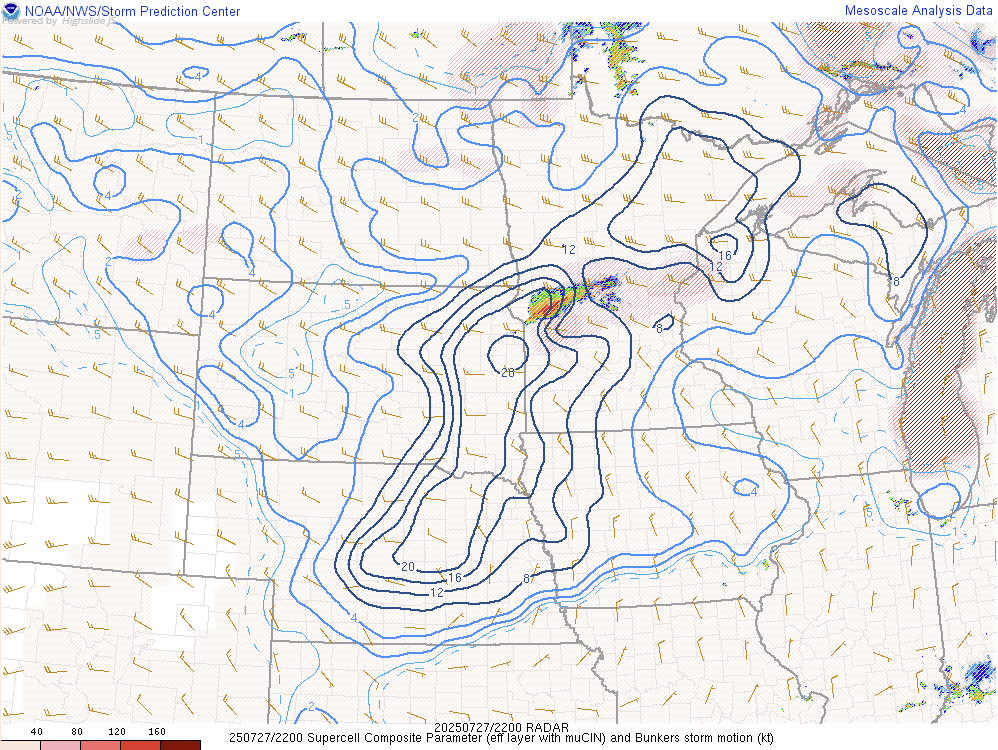
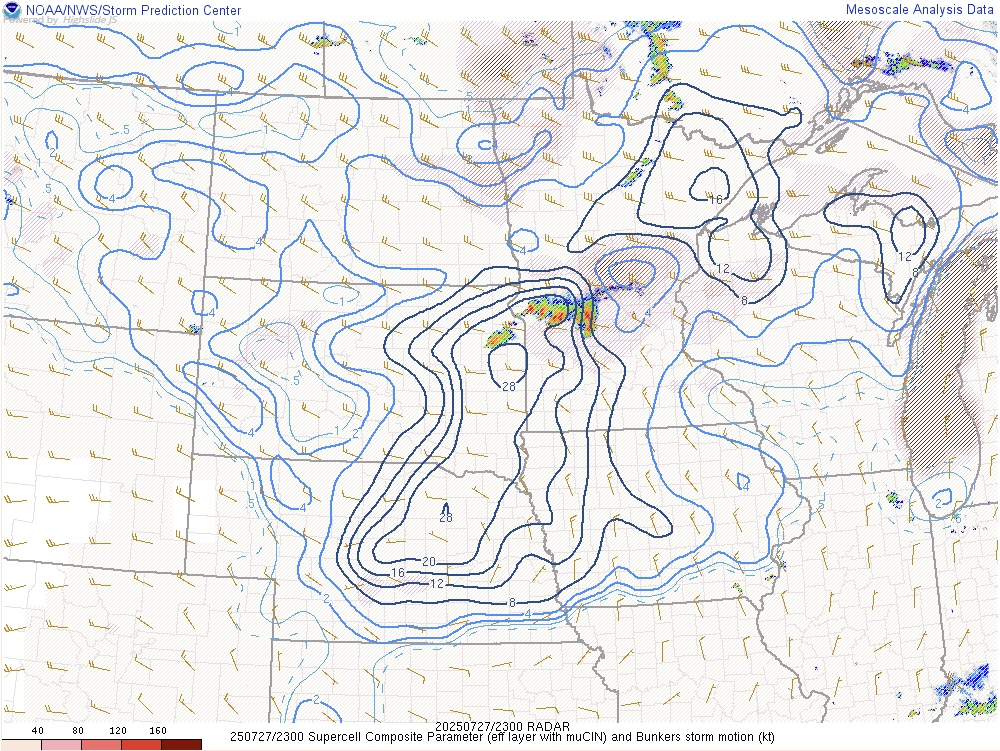
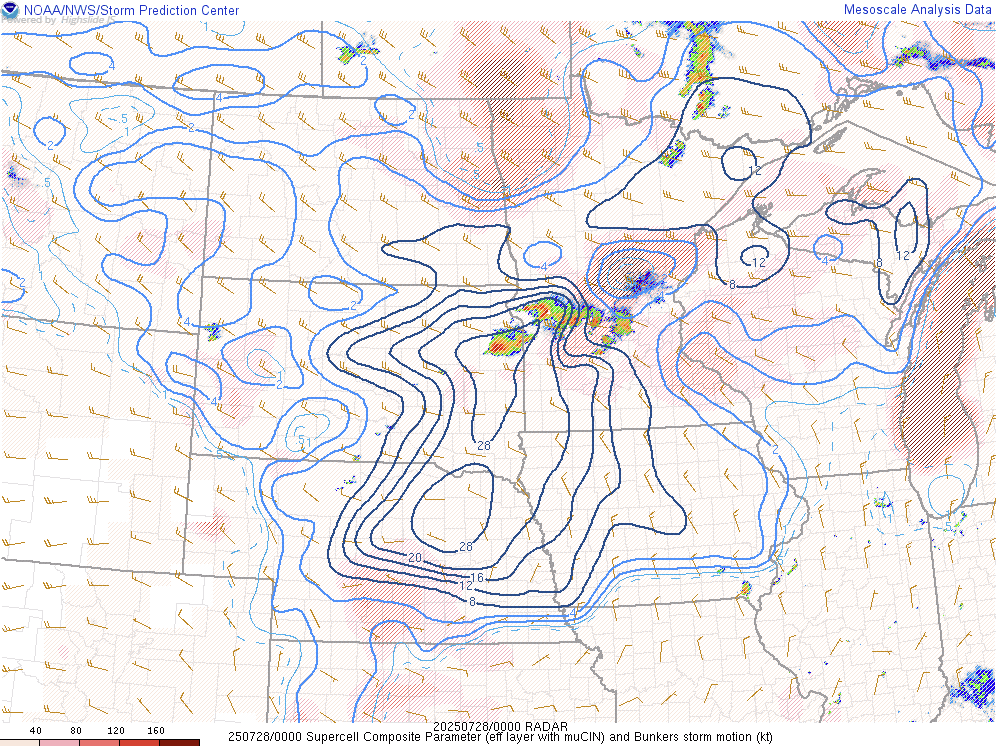
The supercell thunderstorms on July 27th developed on a boundary ahead of an approaching cold front that stalled over northeastern South Dakota. As the storms developed to the southwest and towards the Watertown area, they were developing in an area that was very favorable for tornadoes.
 |
 |
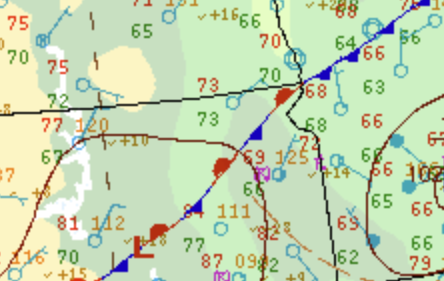 |
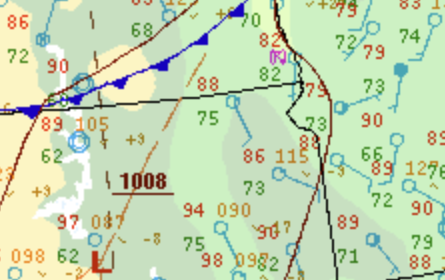
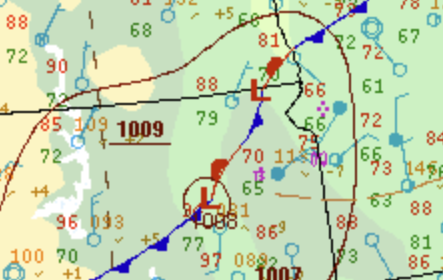
| WPC Surface Analysis at 4pm CDT July 27th | WPC Surface Analysis at 7pm CDT July 27th | WPC Surface Analysis at 10pm CDT July 27th |
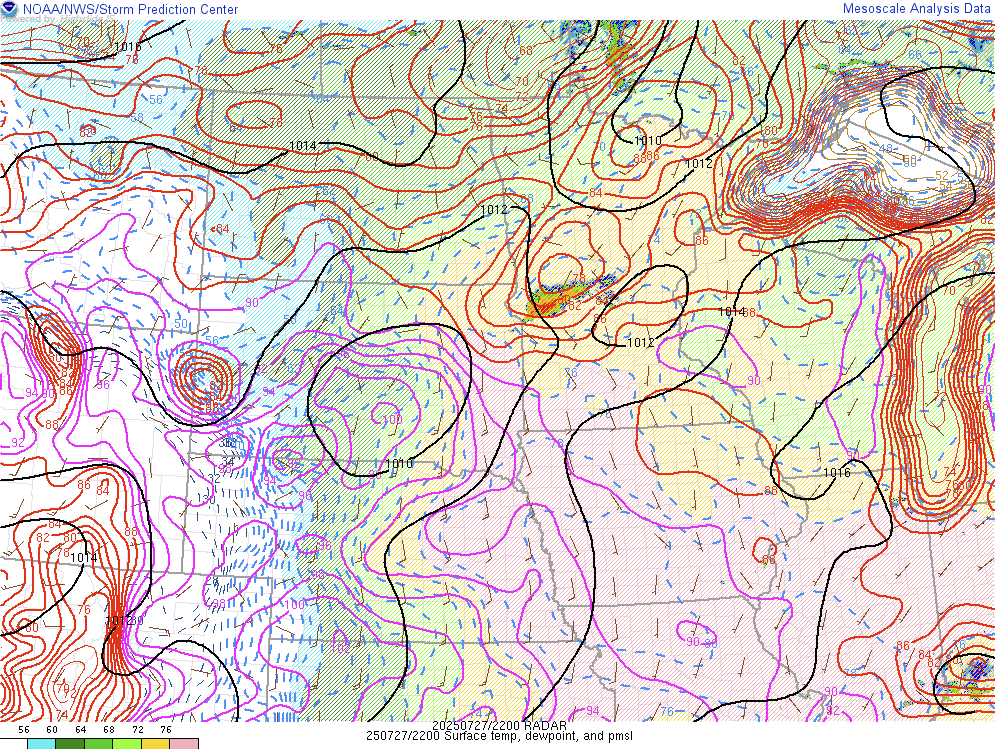
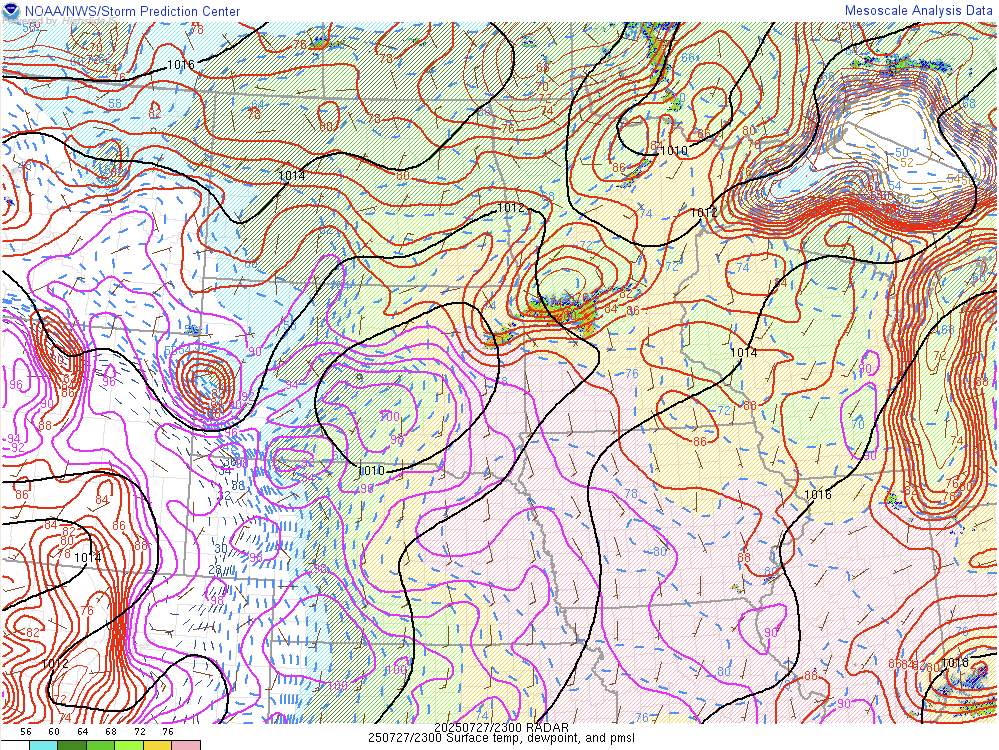
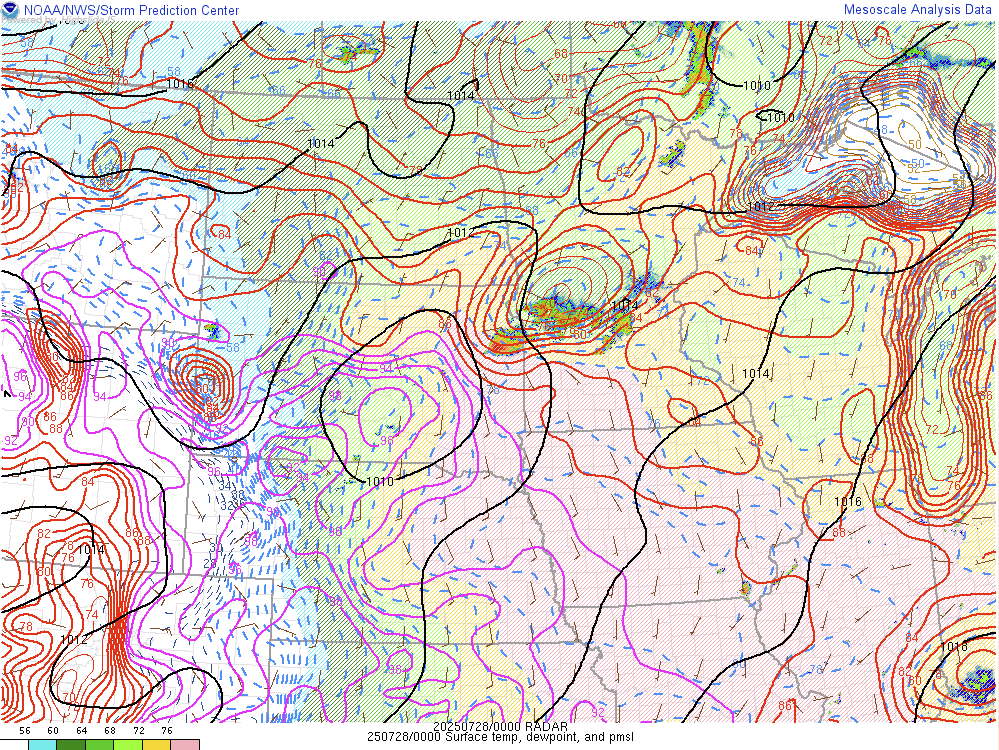
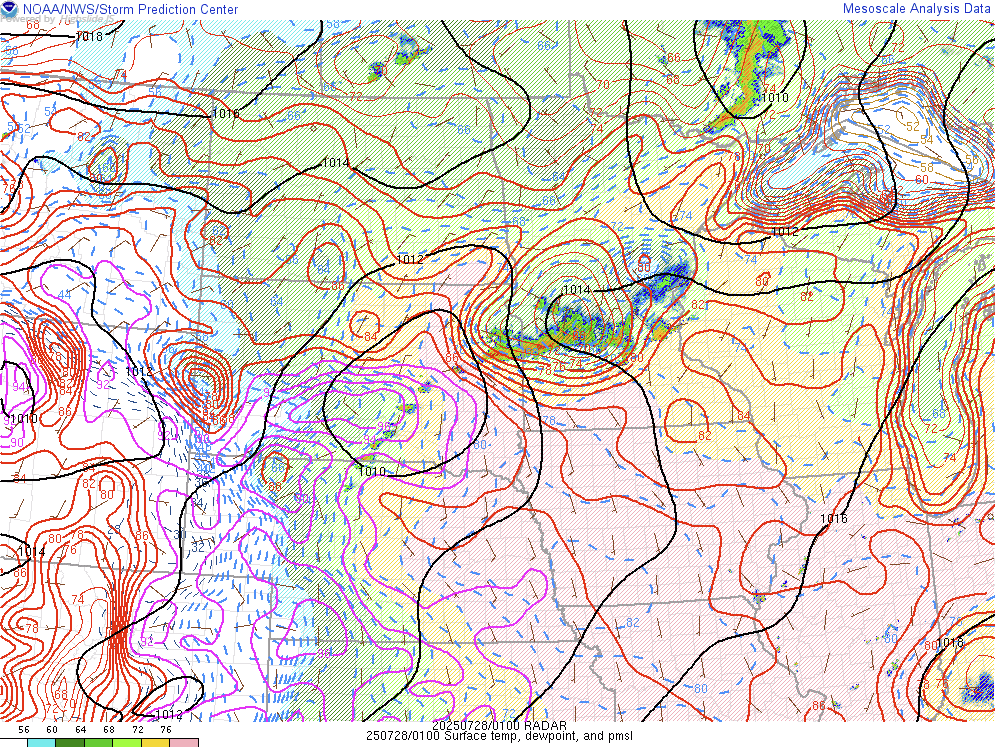
Surface Temperature, Dewpoint & Pressure
 |
 |
 |
 |
| Surface - 5 pm CDT - July 27th SPC's Mesoanalysis Graphic |
Surface - 6 pm CDT - July 27th SPC's Mesoanalysis Graphic |
Surface - 7 pm CDT - July 27th SPC's Mesoanalysis Graphic |
Surface - 8 pm CDT - July 27th SPC's Mesoanalysis Graphic |
Mixed Layer CAPE (ML CAPE)
 |
 |
 |
 |
| MLCAPE - 5 pm CDT - July 27th SPC's Mesoanalysis Graphic |
MLCAPE - 6 pm CDT - July 27th SPC's Mesoanalysis Graphic |
MLCAPE - 7 pm CDT - July 27th SPC's Mesoanalysis Graphic |
MLCAPE - 8 pm CDT - July 27th SPC's Mesoanalysis Graphic |
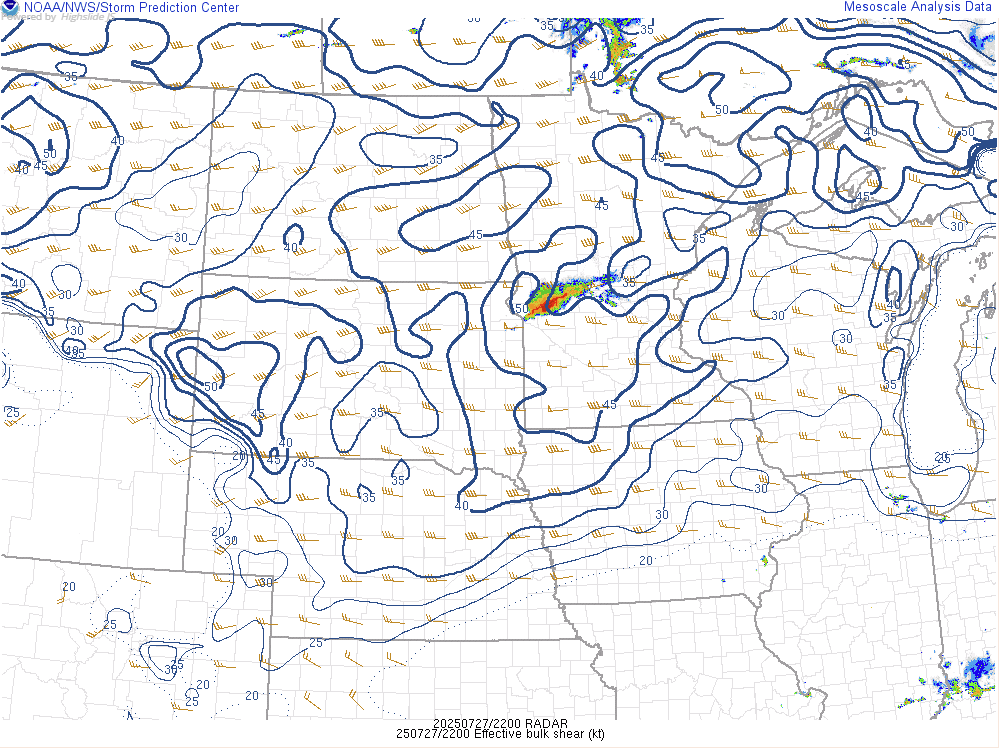
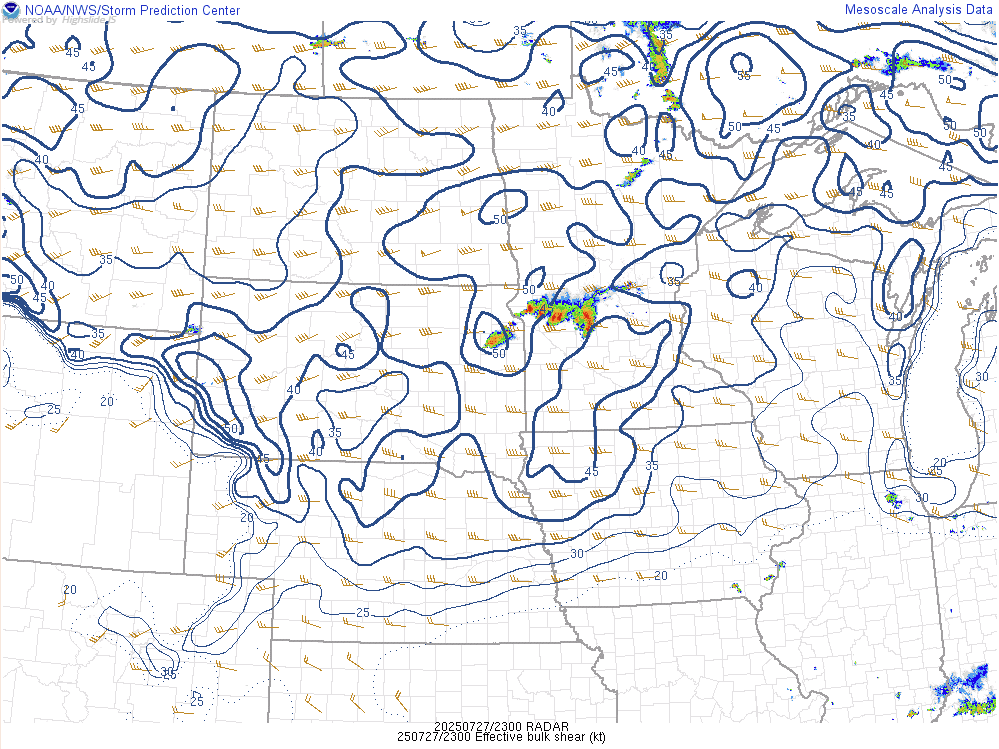
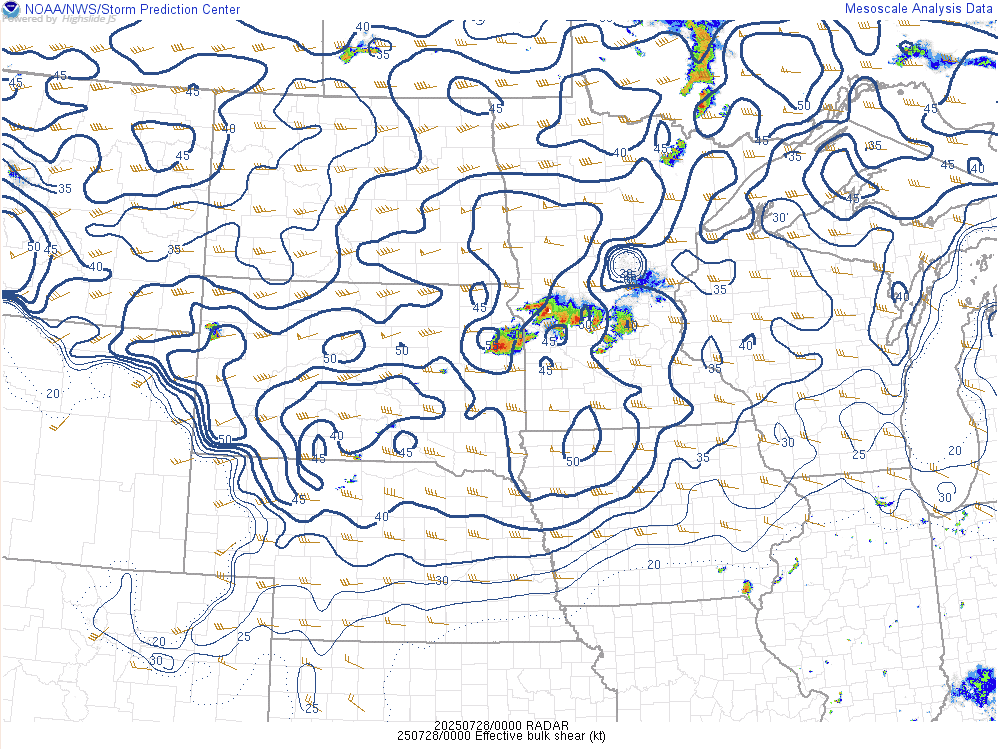
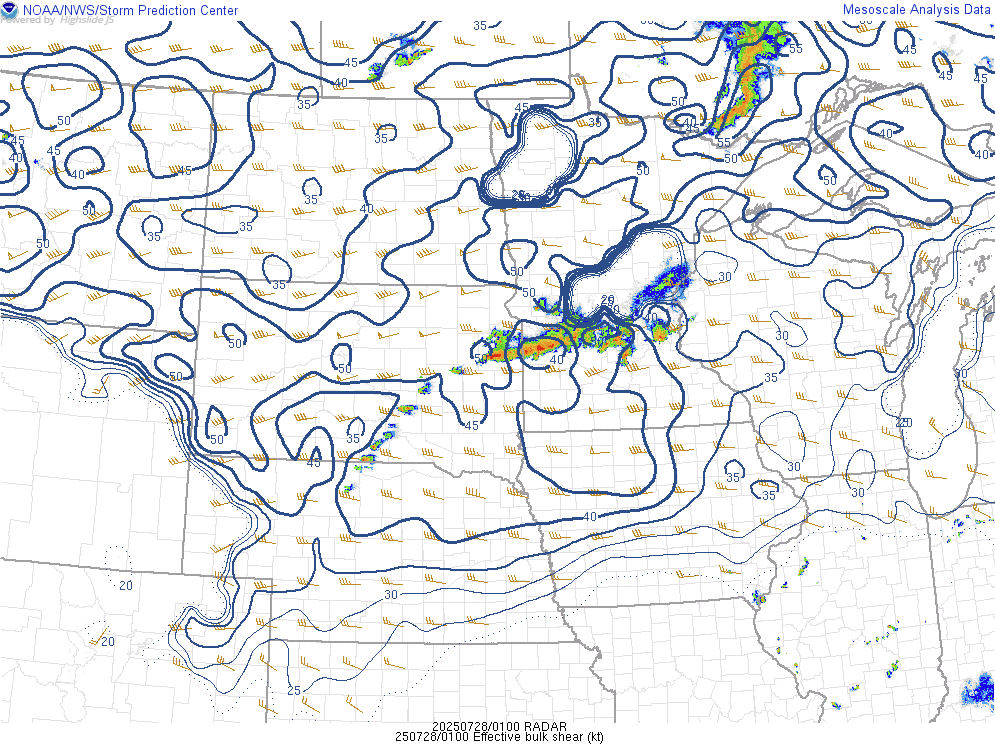
Effective Bulk Shear (EBS)
 |
 |
 |
 |
| EBS - 5 pm CDT - July 27th SPC's Mesoanalysis Graphic |
EBS - 6 pm CDT - July 27th SPC's Mesoanalysis Graphic |
EBS - 7 pm CDT - July 27th SPC's Mesoanalysis Graphic |
EBS - 8 pm CDT - July 27th SPC's Mesoanalysis Graphic |
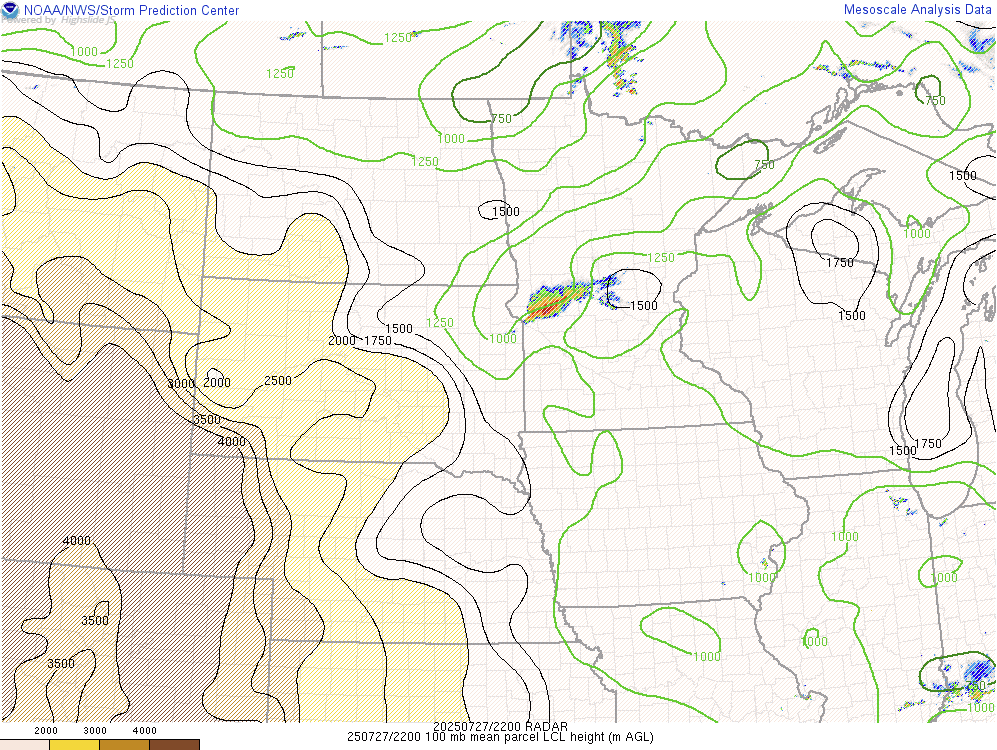
Lifted Condensation Level Heights (LCL)
 |
 |
 |
 |
| LCL - 5 pm CDT - July 27th SPC's Mesoanalysis Graphic |
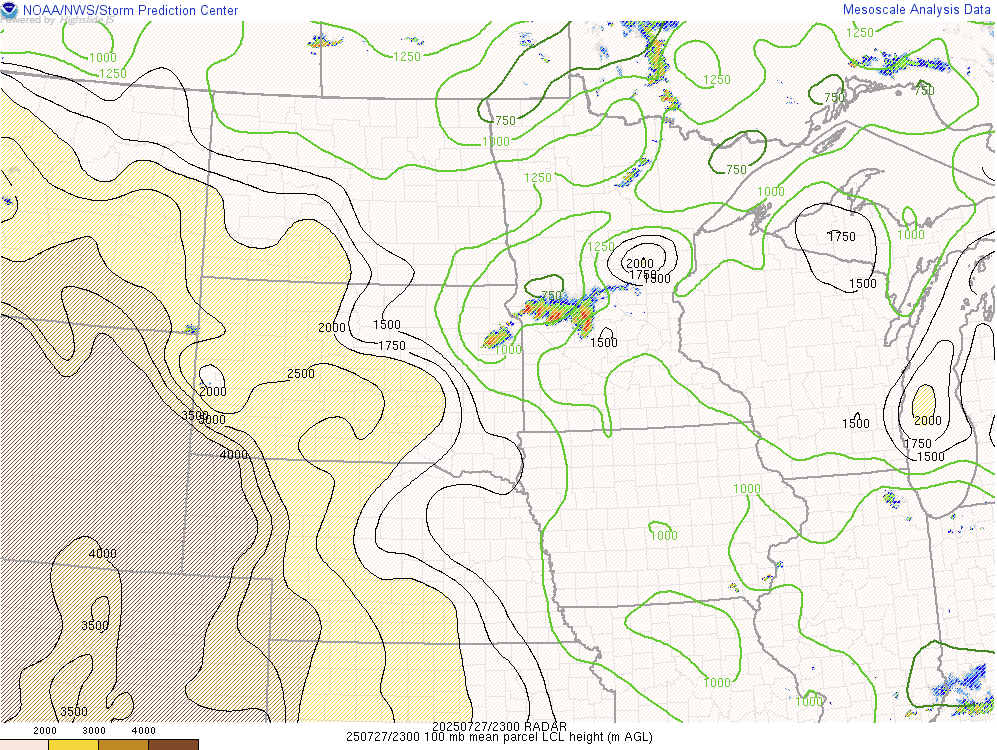
LCL - 6 pm CDT - July 27th SPC's Mesoanalysis Graphic |
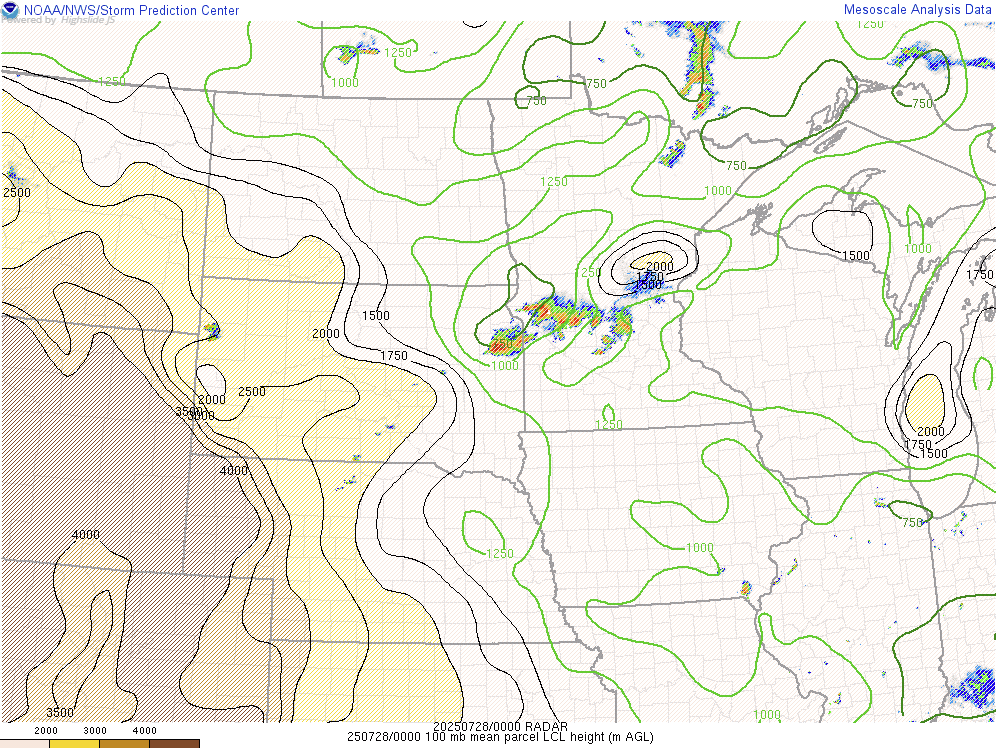
LCL - 7 pm CDT - July 27th SPC's Mesoanalysis Graphic |
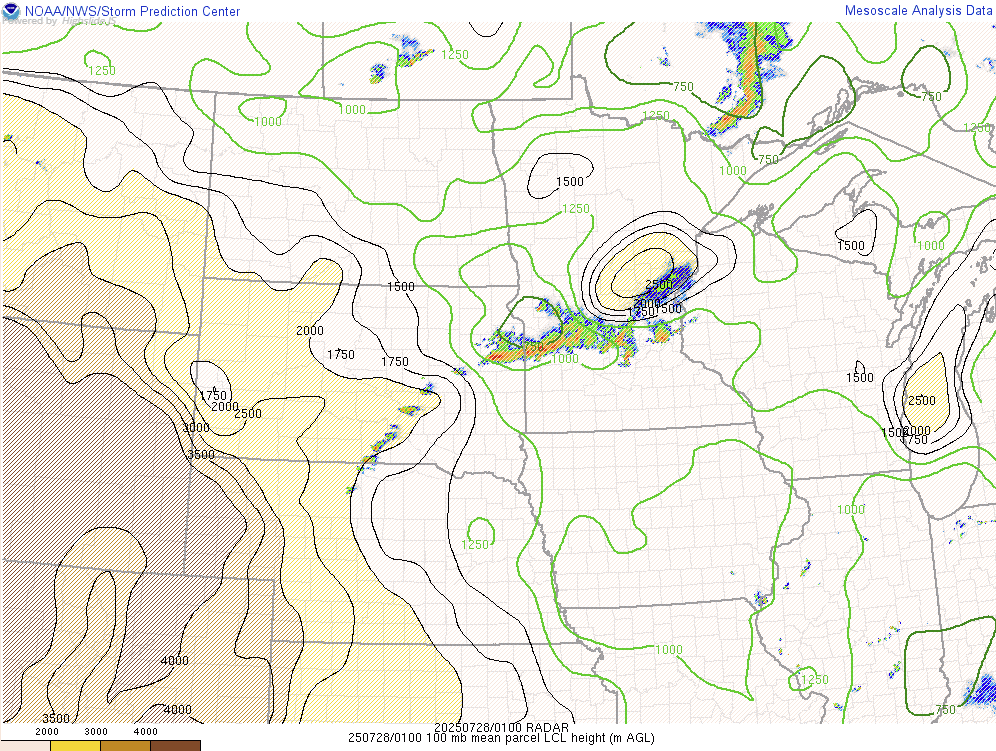
LCL - 8 pm CDT - July 27th SPC's Mesoanalysis Graphic |
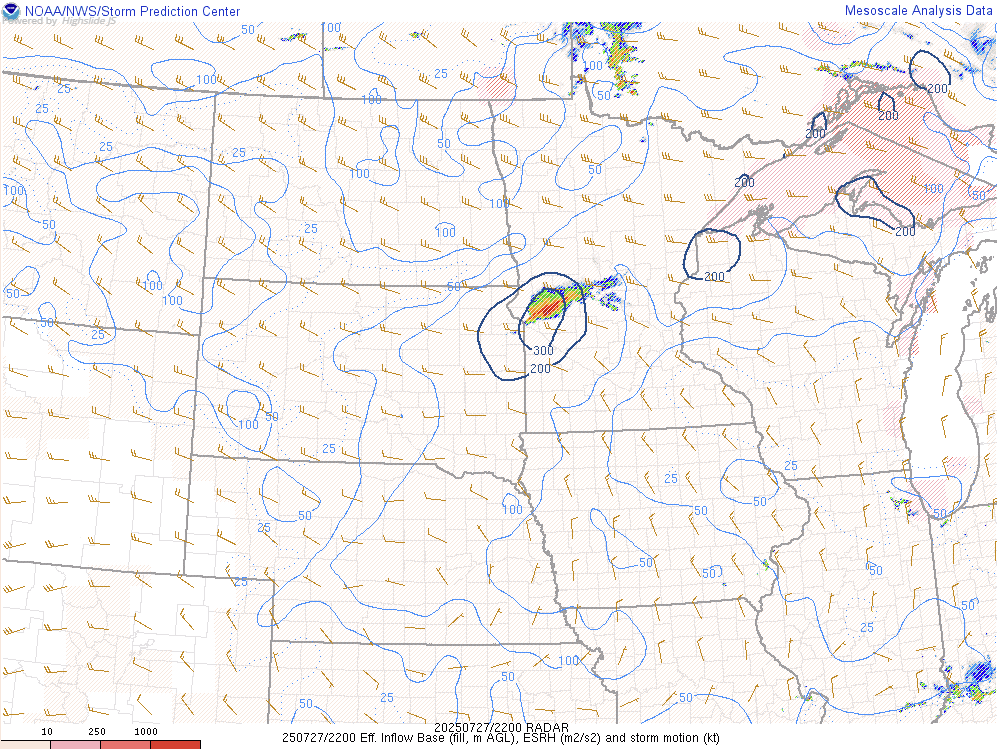
Effective Storm Relative Helicity (ESRH)
 |
 |
 |
 |
| ESRH - 5 pm CDT - July 27th SPC's Mesoanalysis Graphic |
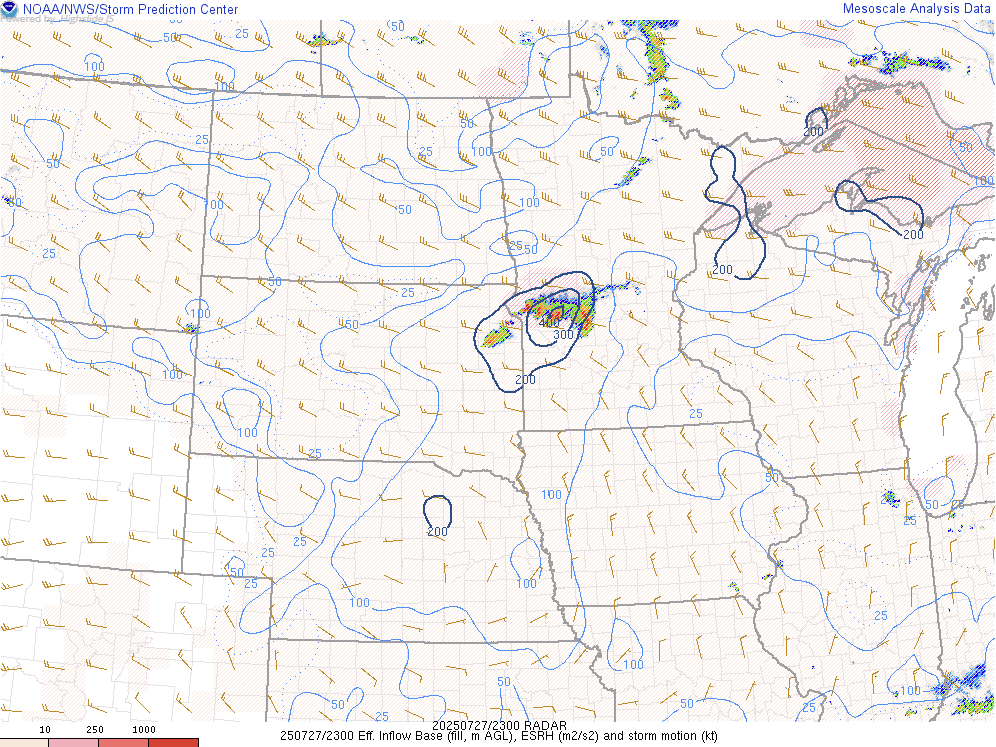
ESRH - 6 pm CDT - July 27th SPC's Mesoanalysis Graphic |
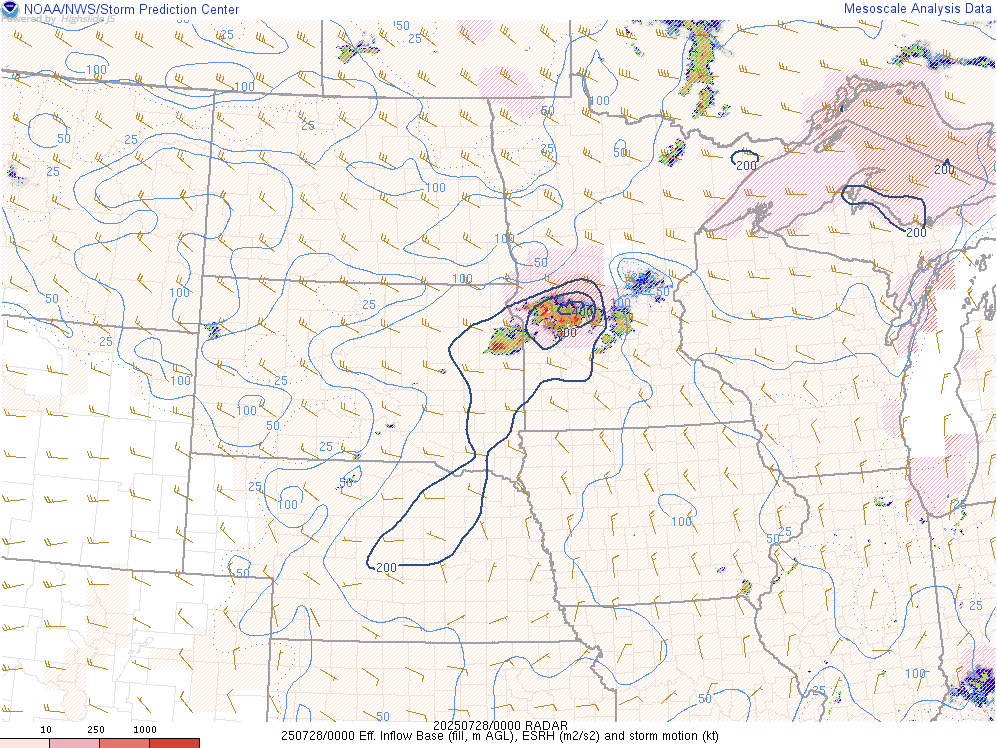
ESRH - 7 pm CDT - July 27th SPC's Mesoanalysis Graphic |
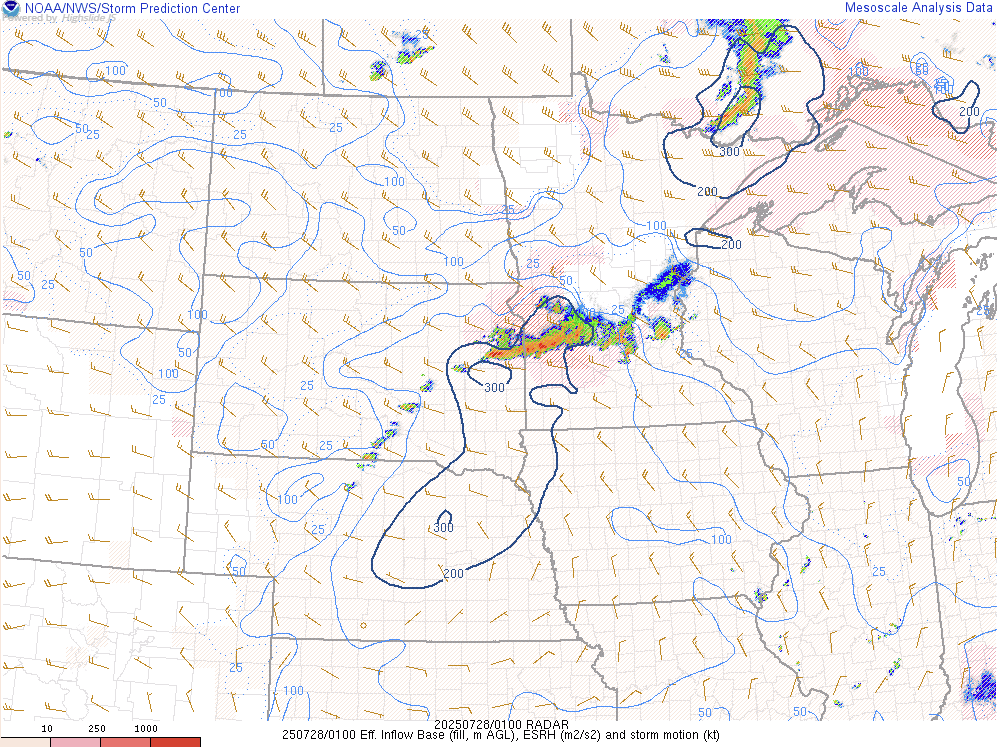
ESRH - 8 pm CDT - July 27th SPC's Mesoanalysis Graphic |
Supercell Composite Parameter (SCP)
 |
 |
 |
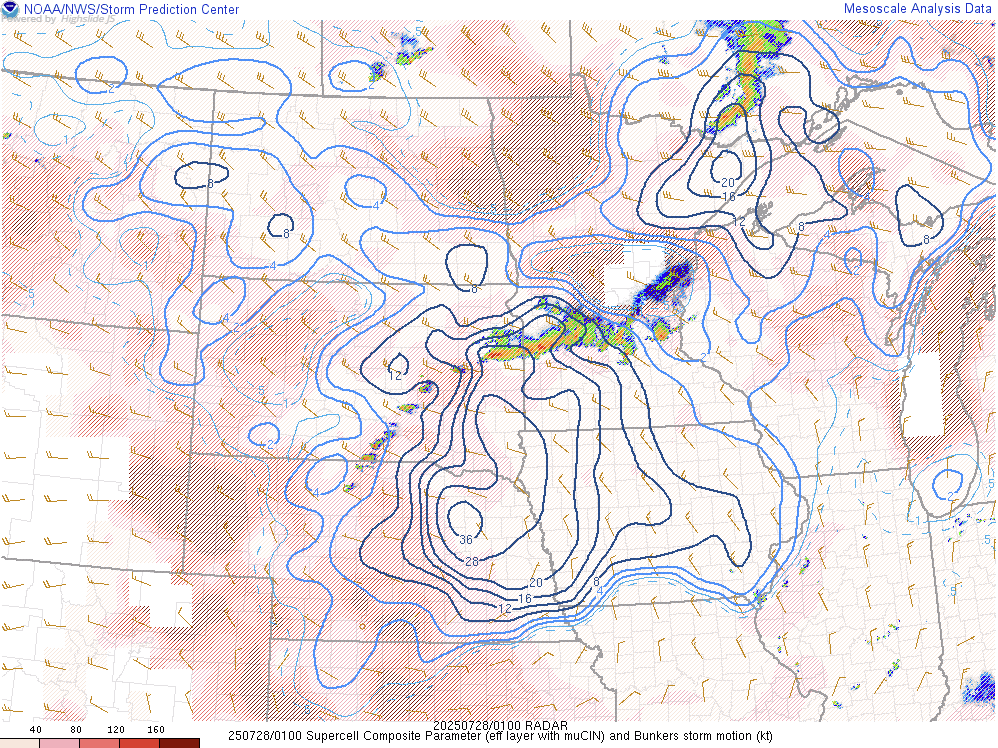 |
| SCP - 5 pm CDT - July 27th SPC's Mesoanalysis Graphic |
SCP - 6 pm CDT - July 27th SPC's Mesoanalysis Graphic |
SCP - 7 pm CDT - July 27th SPC's Mesoanalysis Graphic |
SCP - 8 pm CDT - July 27th SPC's Mesoanalysis Graphic |
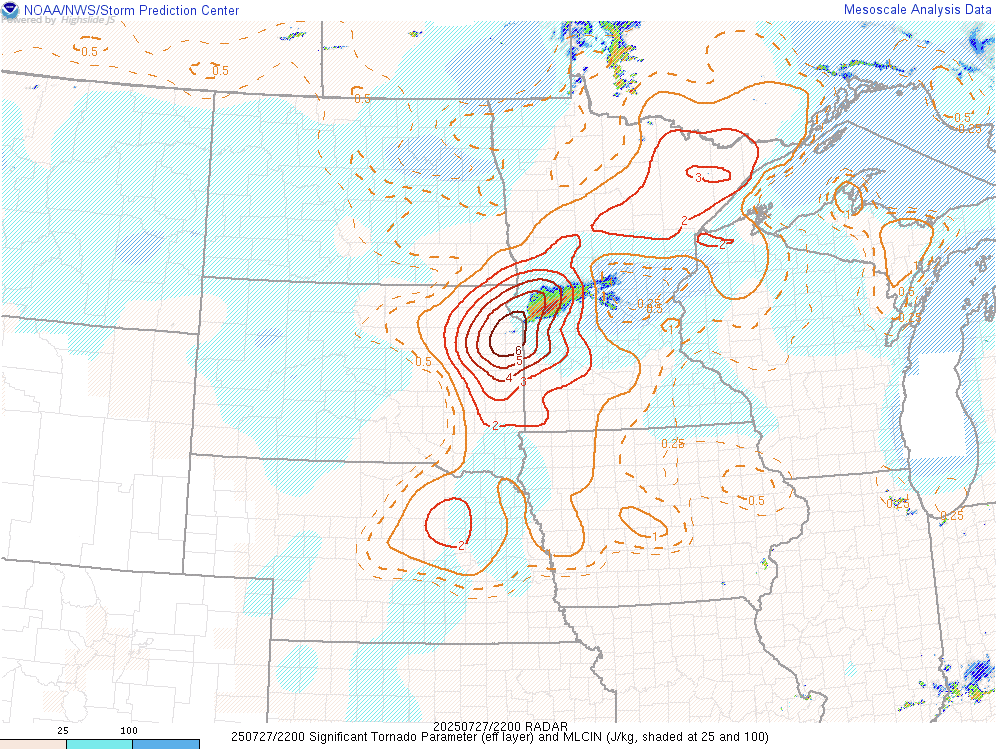
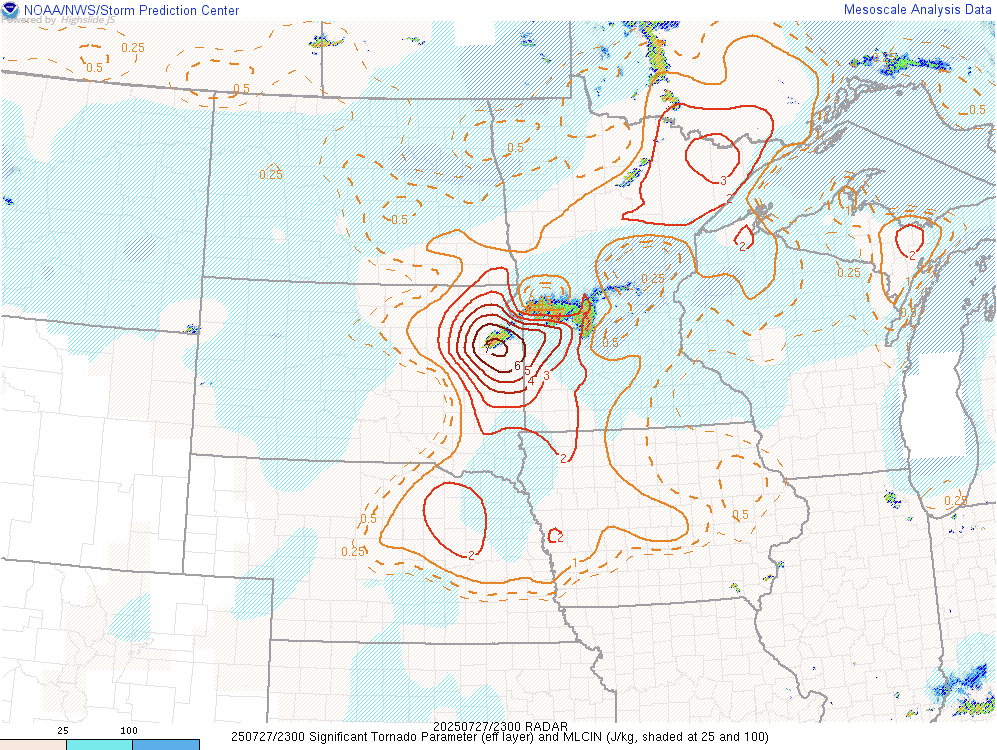
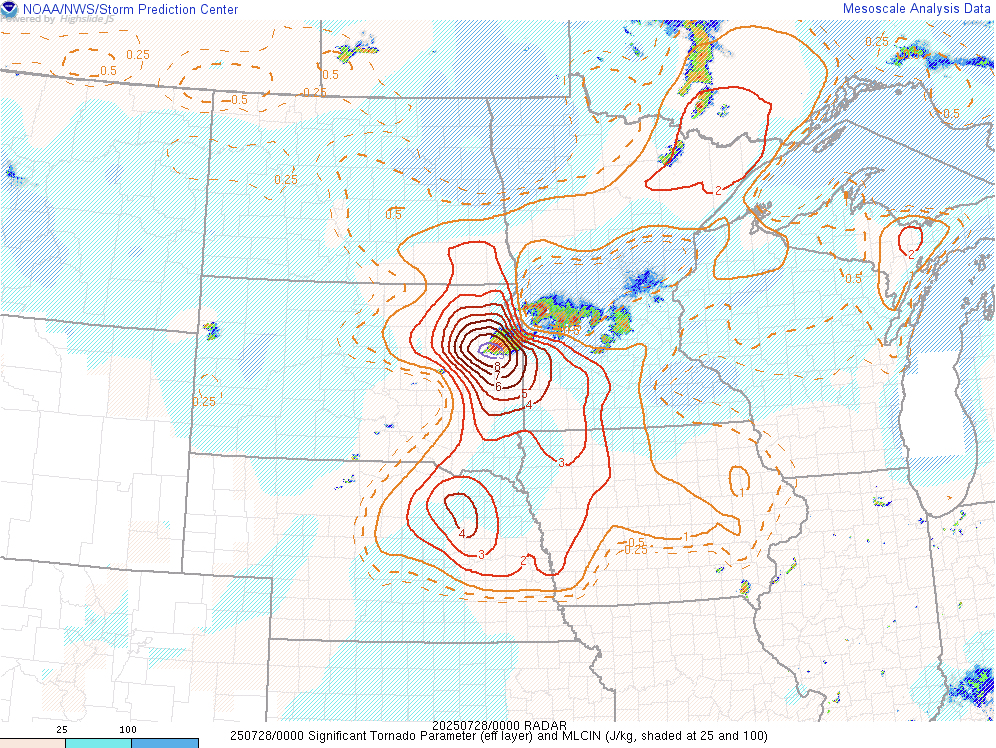
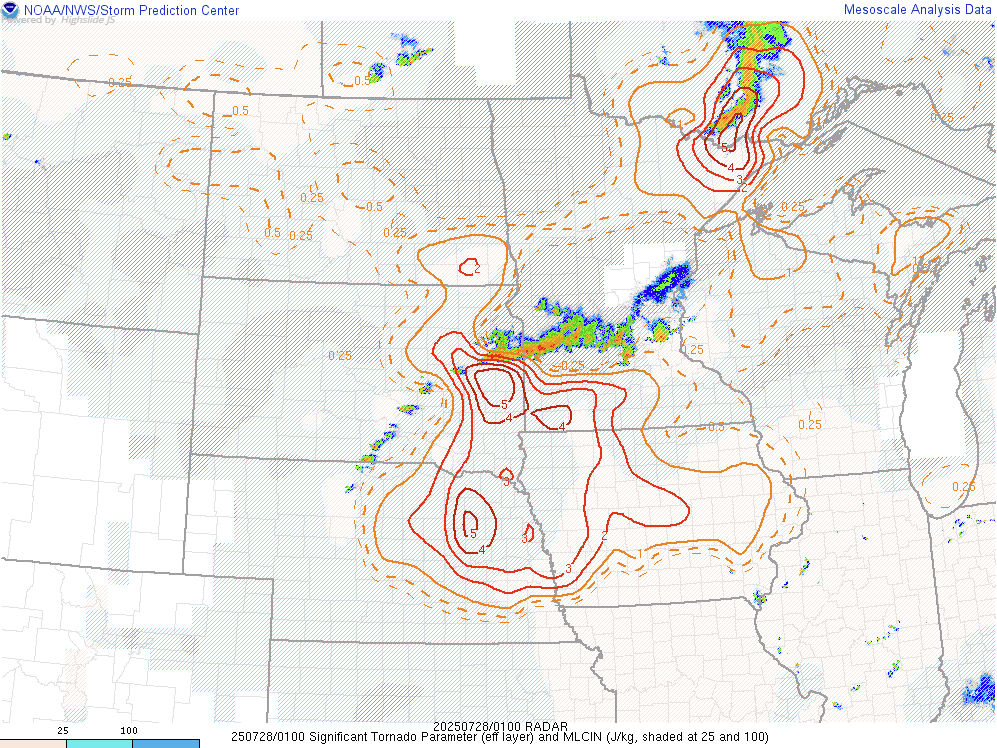
Significant Tornado Parameter (STP)
 |
 |
 |
 |
| STP - 5 pm CDT - July 27th SPC's Mesoanalysis Graphic |
STP - 6 pm CDT - July 27th SPC's Mesoanalysis Graphic |
STP - 7 pm CDT - July 27th SPC's Mesoanalysis Graphic |
STP - 8 pm CDT - July 27th SPC's Mesoanalysis Graphic |
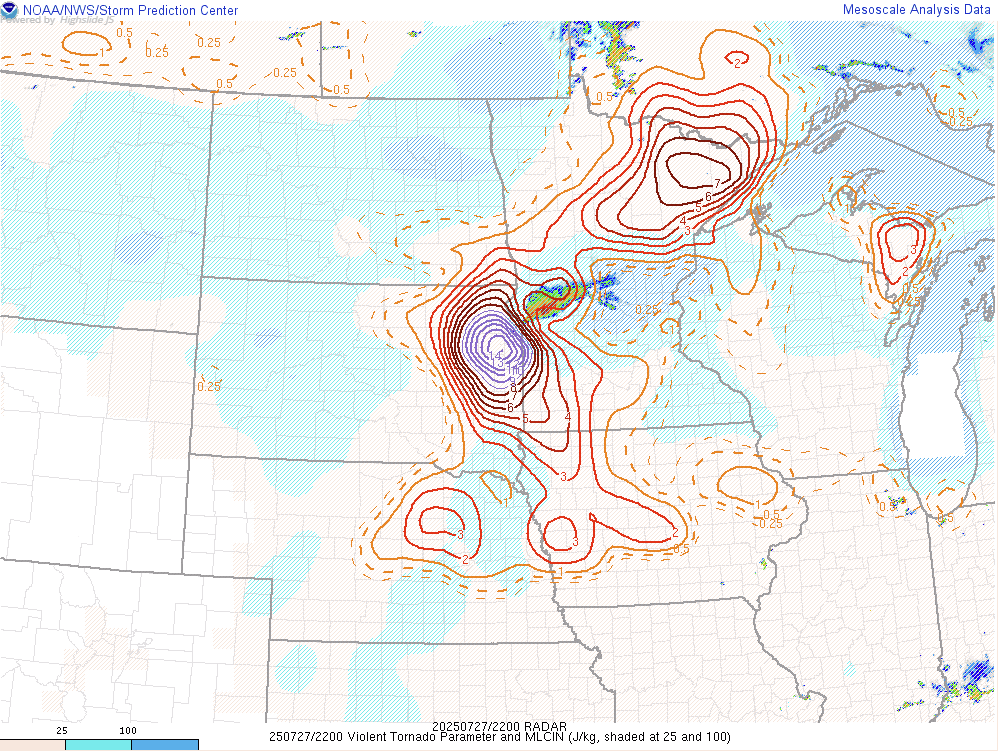
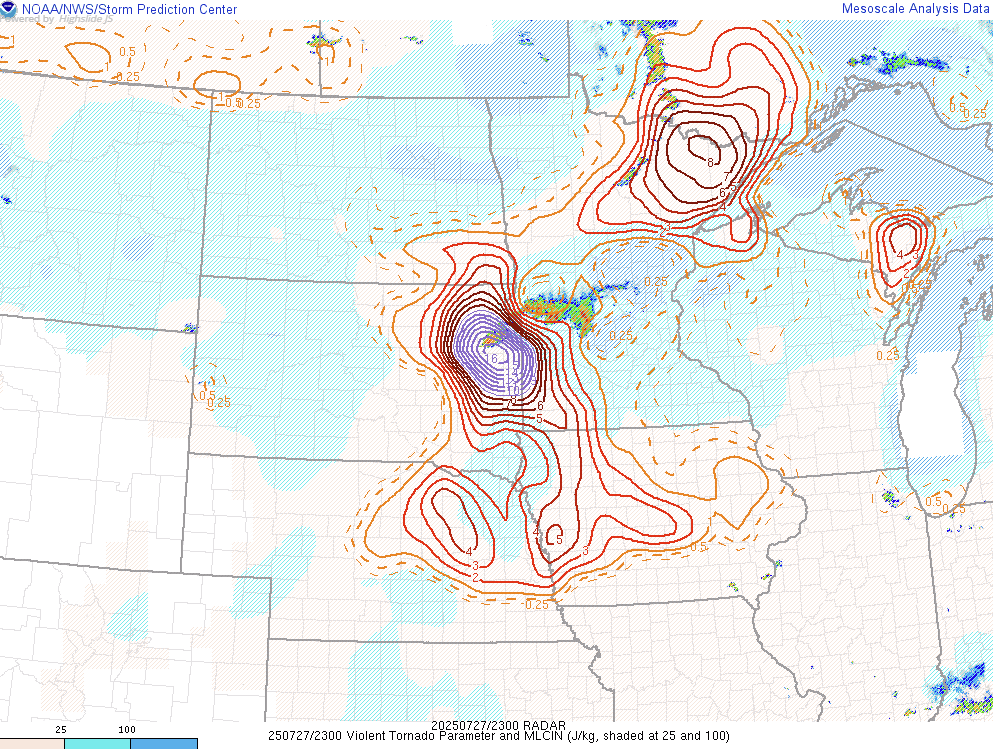
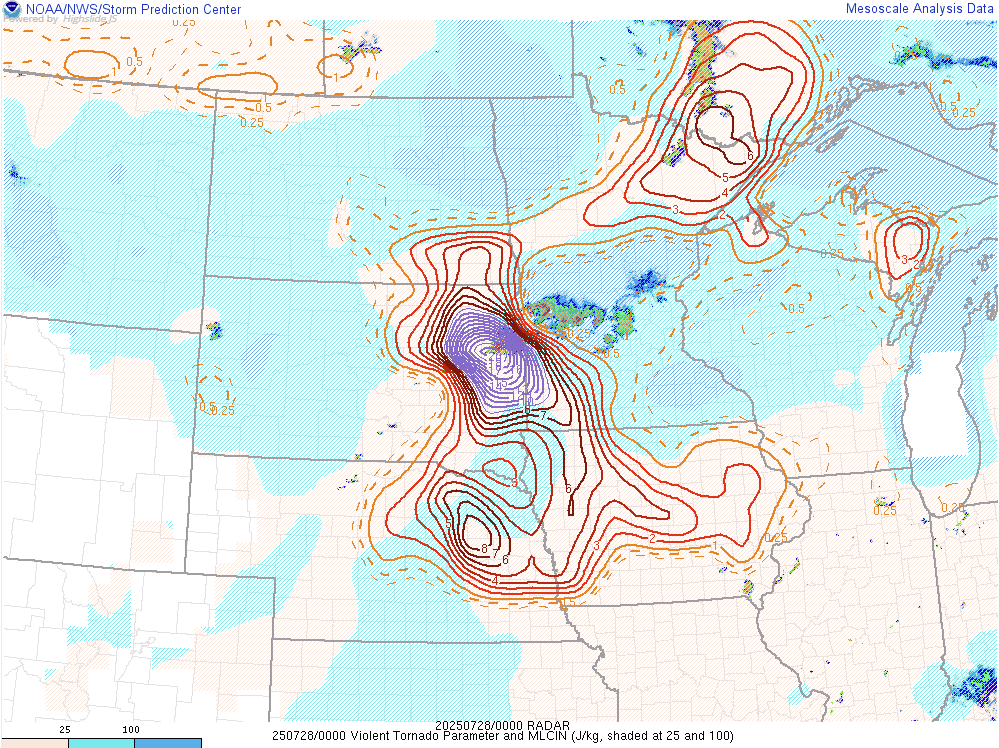
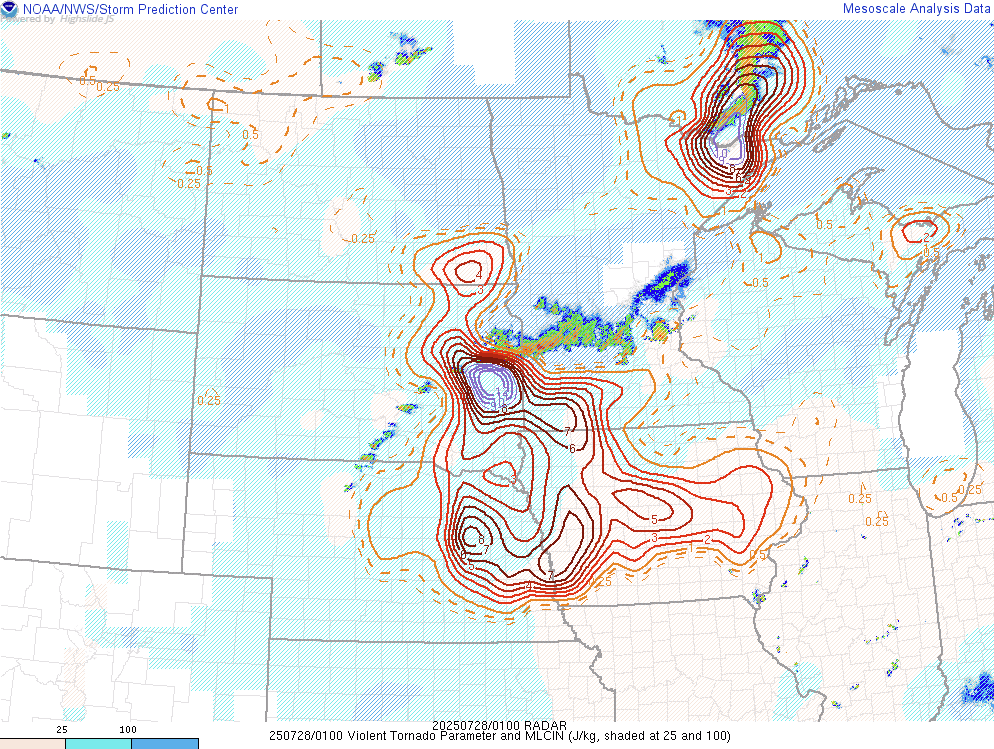
Violent Tornado Parameter (VTP)
 |
 |
 |
 |
| VTP - 5 pm CDT - July 27th SPC's Mesoanalysis Graphic |
VTP - 6 pm CDT - July 27th SPC's Mesoanalysis Graphic |
VTP - 7 pm CDT - July 27th SPC's Mesoanalysis Graphic |
VTP - 8 pm CDT - July 27th SPC's Mesoanalysis Graphic |
Storm Reports
|
|
 |
|
| Local Storm Reports for July 27, 2025 | |
 |
|
 |
Media use of NWS Web News Stories is encouraged! Please acknowledge the NWS as the source of any news information accessed from this site. |
|