
Numerous severe thunderstorms are expected across a broad region from the Ohio Valley to the Mid-Atlantic and Northeast States today into tonight. Swaths of damaging wind gusts are expected and some tornadoes are possible. Bertha is expected to bring tropical storm conditions to portions of the Gulf Coast from the Florida Panhandle westward to southeastern Louisiana later today and Wednesday. Read More >
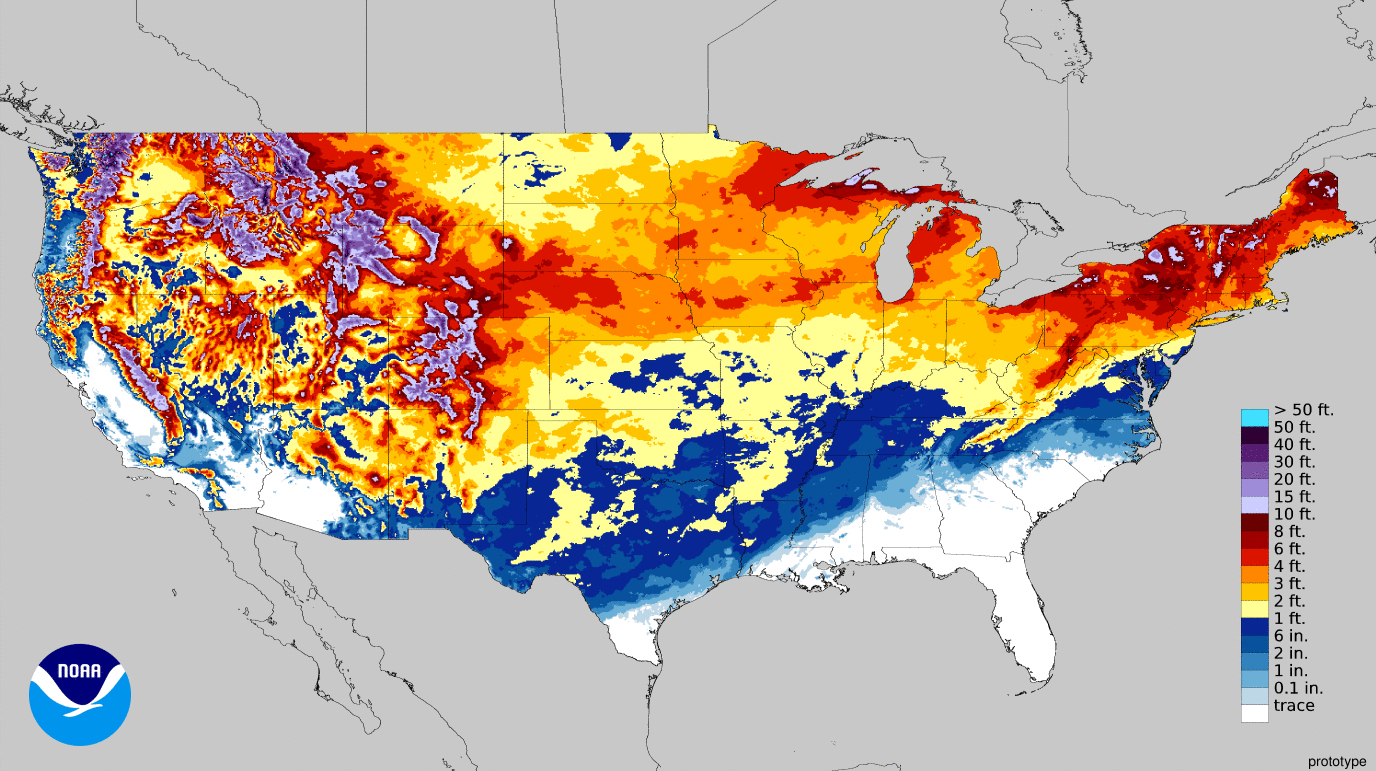
| 72 Hour Snow Amount Potential
Experimental - Leave feedback
|
|
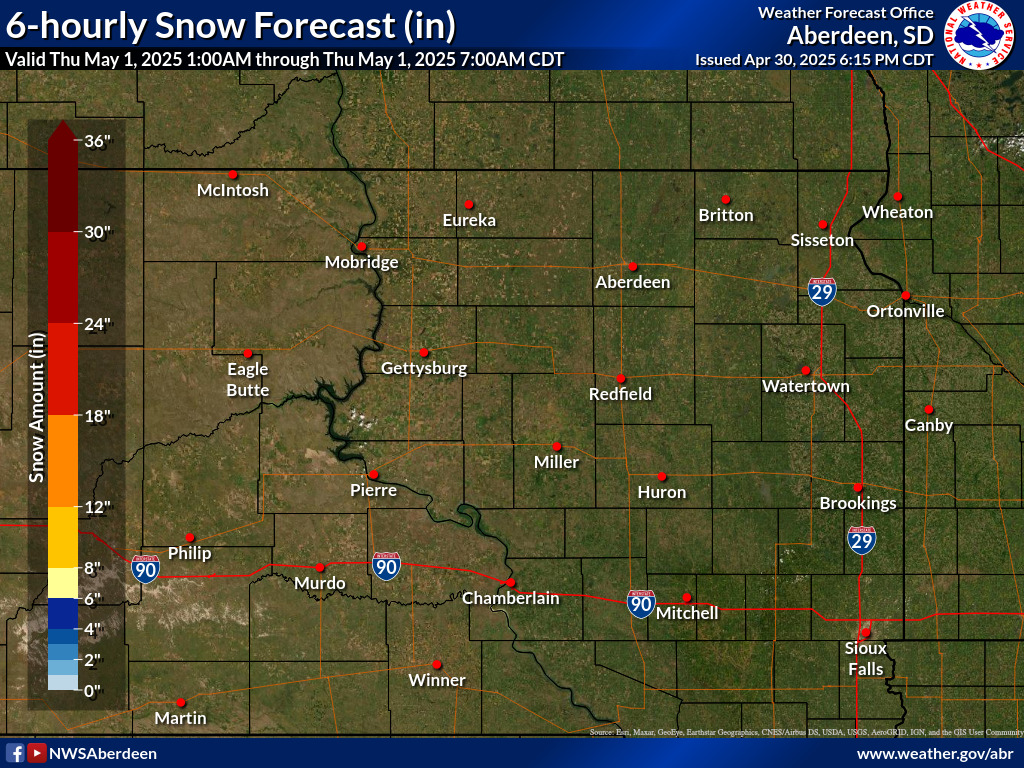
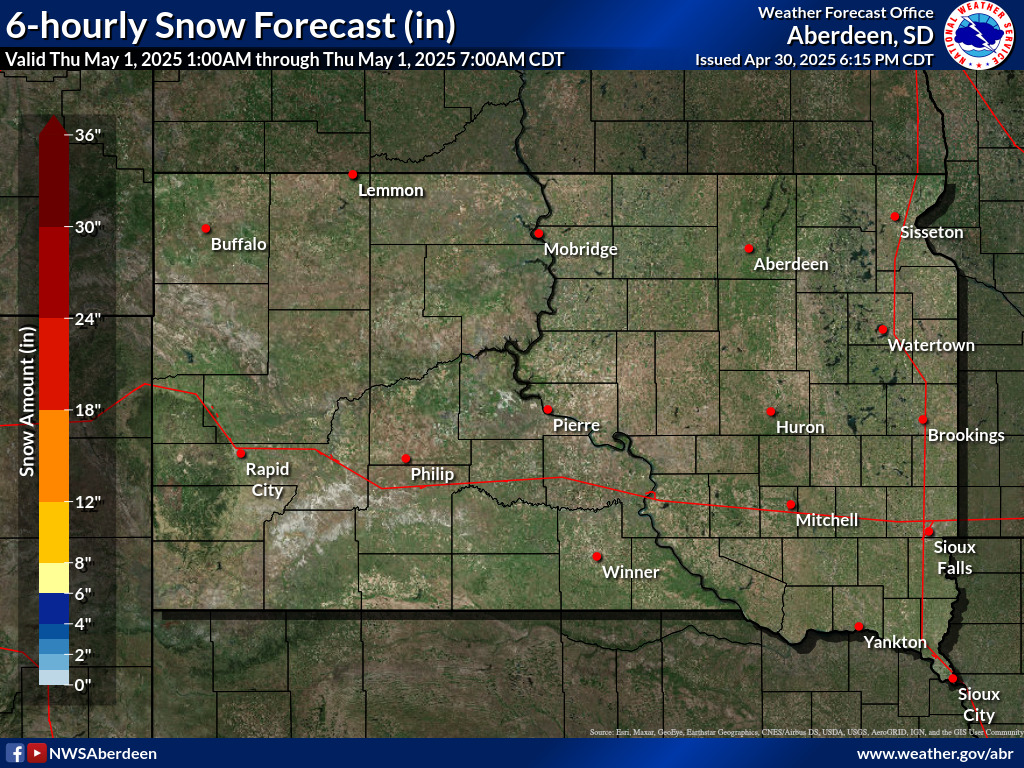
| Expected 72 Hour Snowfall - Official NWS Forecast
What's this? |
High End 72 Hour Amount 1 in 10 Chance (10%) of Higher Snowfall What's this? |
| Low End 72 Hour Amount 9 in 10 Chance (90%) of Higher Snowfall What's this? |
|
| Percent Chance That 72 Hour Snow Amounts in Will Be Greater Than...
Experimental - Leave feedback
What's this?
|
||||||||||||||||
|
||||||||||||||||
| 72 Hour Snowfall Totals by Location
Experimental - Leave feedback
What's this?
|
|
|
| Snow Amount Potential
Experimental - Leave feedback
|
|
| Expected 72 Hour Snowfall - Official NWS Forecast
What's this? |
High End 72 Hour Amount 1 in 10 Chance (10%) of Higher Snowfall What's this? |
| Low End 72 Hour Amount 9 in 10 Chance (90%) of Higher Snowfall What's this? |
|
| Percent Chance That 72 Hour Snow Amounts Will Be Greater Than...
Experimental - Leave feedback
What's this?
|
||||||||||||||||
|
||||||||||||||||
| 72 Hour Ice Accumulation Potential
Experimental - Leave feedback
|
|
| Expected 72 Hour Ice Accumulation - Official NWS Forecast
What's this? This is the elevated flat surface ice accumulation. It is not radial/line ice. Radial/line ice is typically 39% of the elevated flat surface ice. For more information on this, see this module. |
High End 72 Hour Amount 1 in 10 Chance (10%) of Higher Ice Accumulation What's this? |
| Low End 72 Hour Amount 9 in 10 Chance (90%) of Higher Ice Accumulation What's this? |
|
| Percent Chance That 72 Hour Ice Accumulation Will Be Greater Than...
Experimental - Leave feedback
What's this?
|
||||||||||||||||
|
||||||||||||||||
| 72 Hour Ice Accumulation by Location
Experimental - Leave feedback
What's this?
|
|
|
| 72 Hour Ice Accumulation Potential
Experimental - Leave feedback
|
|
| Expected 72 Hour Ice Accumulation - Official NWS Forecast
What's this? This is the elevated flat surface ice accumulation. It is not radial/line ice. Radial/line ice is typically 39% of the elevated flat surface ice. For more information on this, see this module. |
High End 72 Hour Amount 1 in 10 Chance (10%) of Higher Ice Accumulation What's this? |
| Low End 72 Hour Amount 9 in 10 Chance (90%) of Higher Ice Accumulation What's this? |
|
| Percent Chance That 72 Hour Ice Accumulations Will Be Greater Than...
Experimental - Leave feedback
What's this?
|
||||||||||||||||
|
||||||||||||||||
 |
 |
| **Prototype Under Development - not to be relied on for operational decision making** |
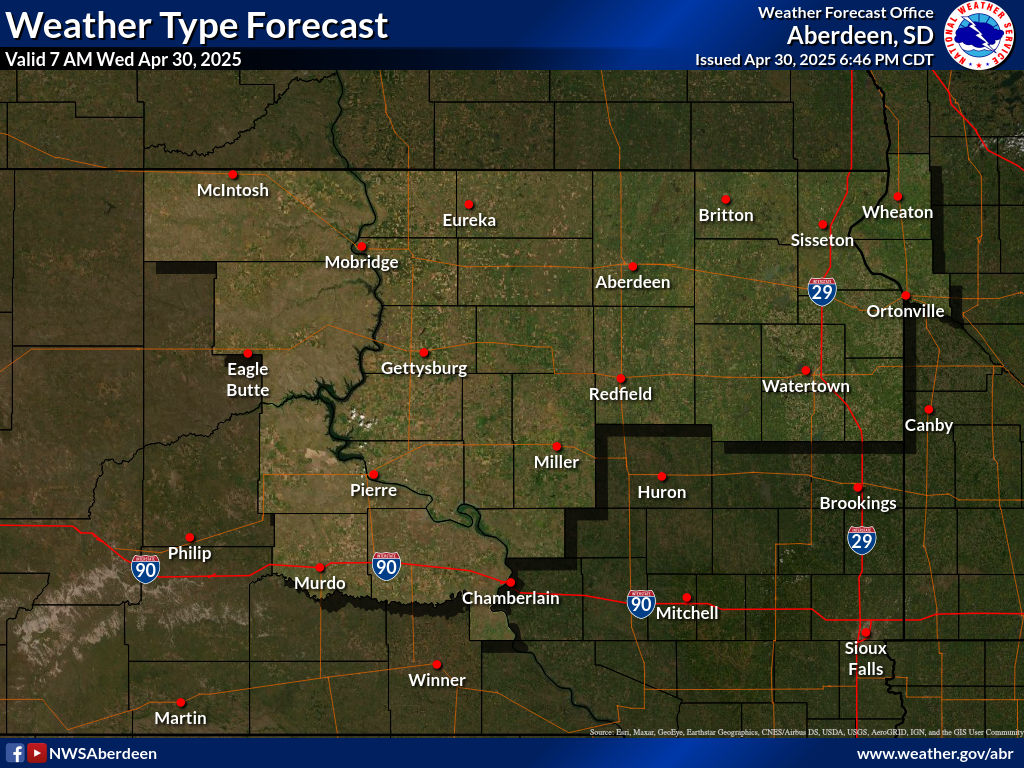 |
Detailed information on the Weather Type Graphic can be located here.
|
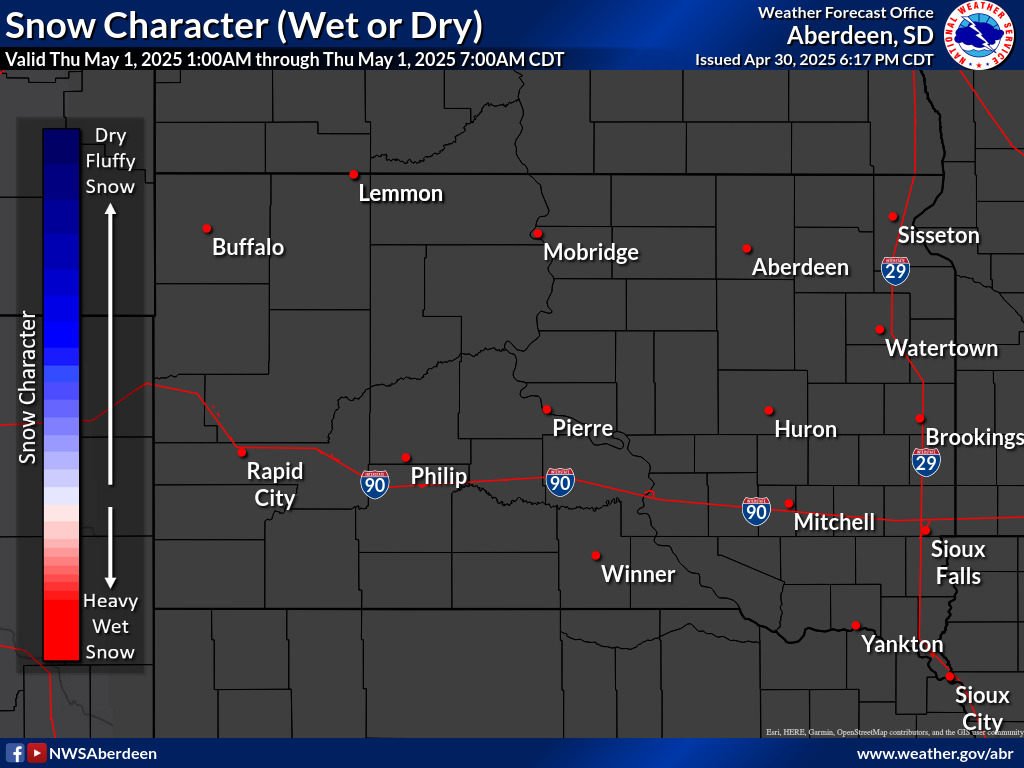
| **Prototype Under Development - not to be relied on for operational decision making** The snowfall character is categorized based on the forecasted snow-to-liquid ratio. If snow were to fall during this period, this would be the character of the snow. |
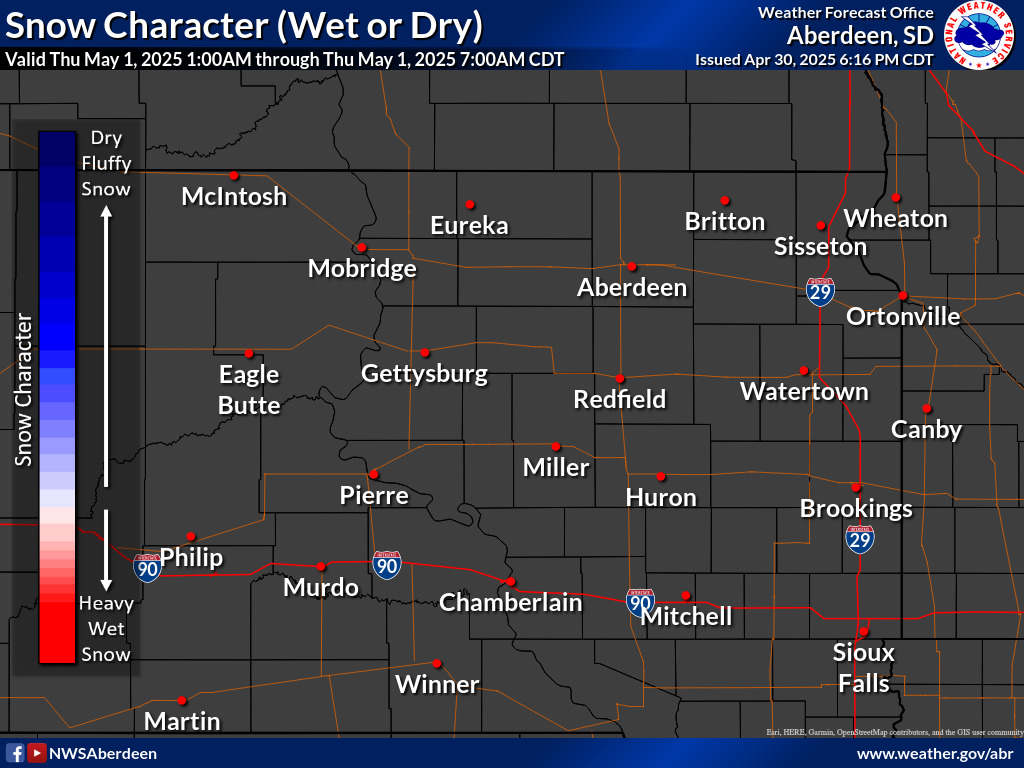 |
| **Prototype Under Development - not to be relied on for operational decision making** The snowfall character is categorized based on the forecasted snow-to-liquid ratio. If no snow is forecasted, the snow character is not shown. |
 |
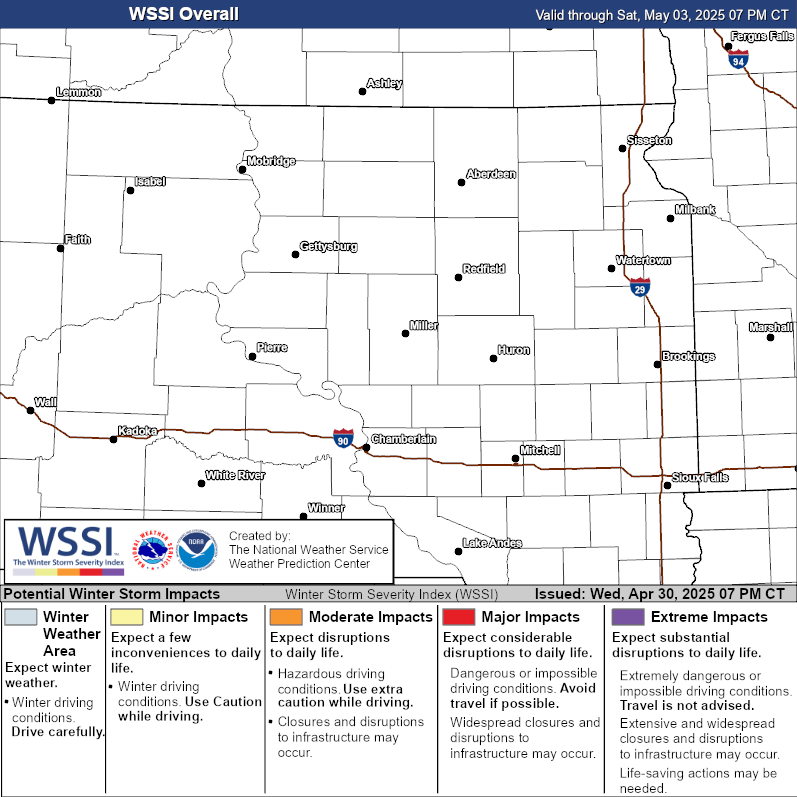
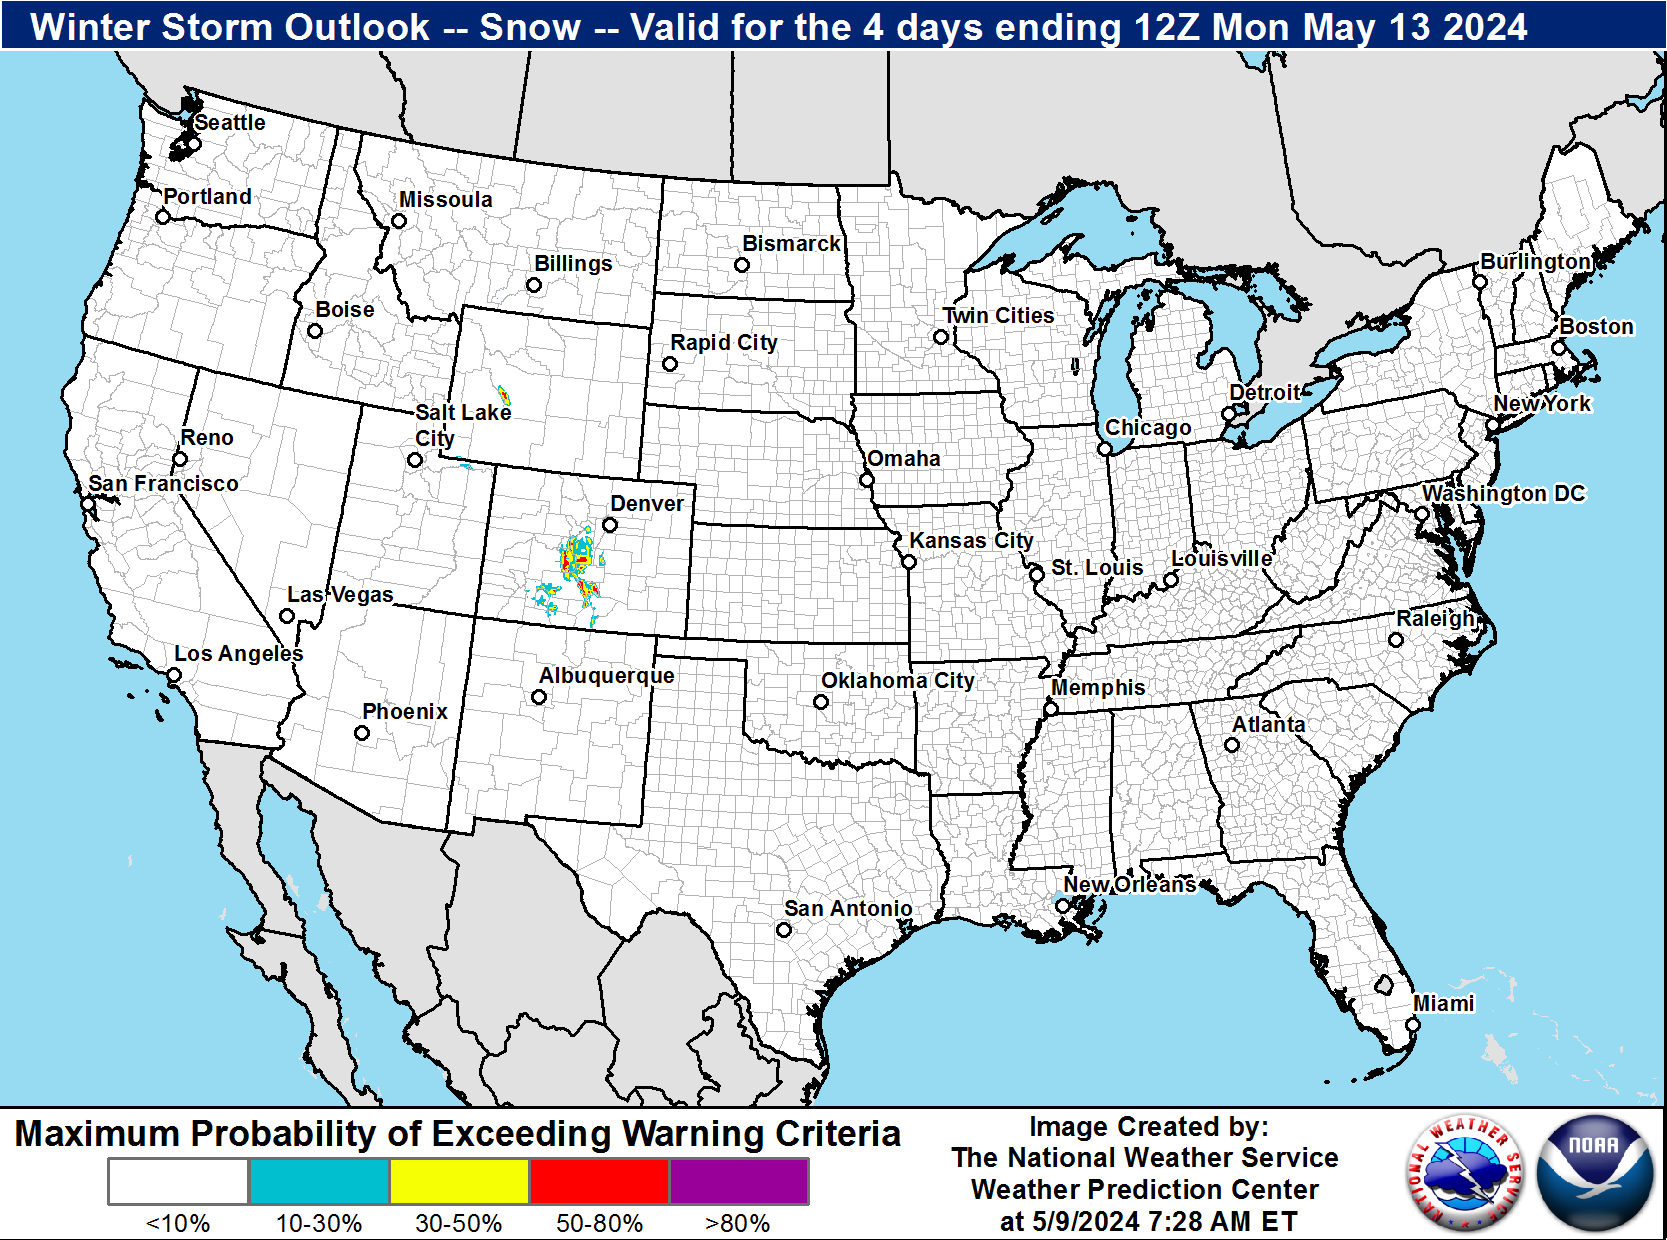
| Winter Storm Severity Index (WSSI) | Winter Storm Outlook (WSO) |
|---|---|
 |
 |
| Local Snow Reports | National Snowfall Analysis |
|---|---|
 |
 |
| Days 4-7 Winter Weather Outlook | |
| Day 4 Winter Weather Outlook | Day 5 Winter Weather Outlook |
 |
 |
| Day 6 Winter Weather Outlook | Day 7 Winter Weather Outlook |
 |
 |
|
|
|
| CPC Week-2 Experimental Heavy Snow Risk | |
 |
|
| CPC Temperature & Precipitation Maps | |
|
Days 6-10 |
|
| Temperature | Precipitation |
 |
 |
|
Days 8-14 |
|
| TEMPERATURE | PRECIPITATION |
 |
 |
|
Week 3-4 |
|
|
TEMPERATURE |
PRECIPITATION |
 |
 |
| Other Snow/Ice Information | ||
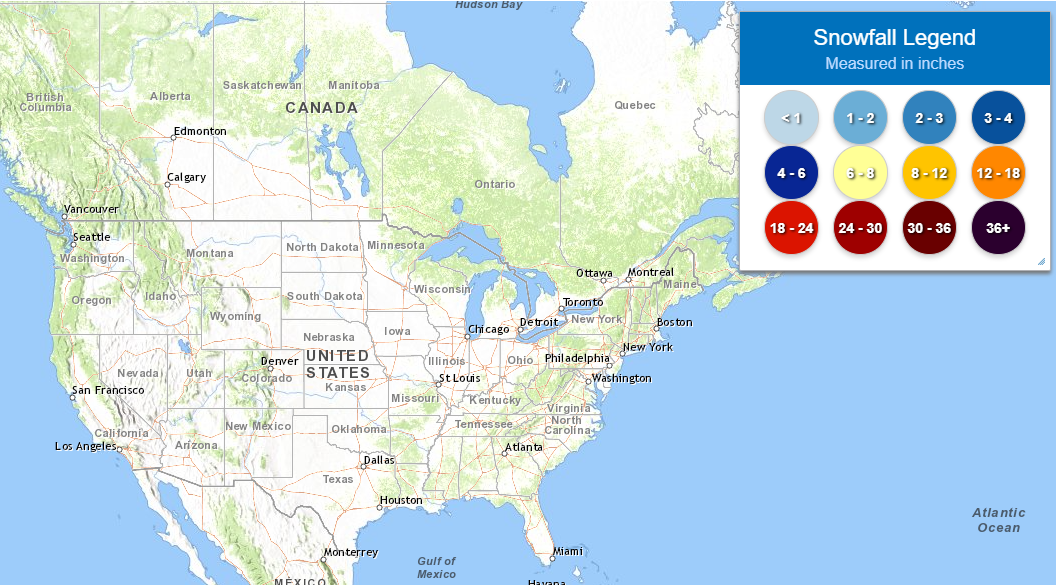
| NDFD Graphic Forecast Displays | Zoomable Snowfall Analysis | |
|---|---|---|
 |
||
| What's this? | ||
| Aberdeen, SD Products | ||||
| HAZARDOUS WEATHER OUTLOOK | FORECAST DISCUSSION | WINTER WEATHER WATCH/WARNING/ADVISORY | SPECIAL WEATHER STATEMENT | PUBLIC INFORMATION STATEMENT |
| Additional Winter Weather Information | ||||
| EM Briefing Page | SD EOC Page | SD Road Conditions | Winter Preparedness | |

