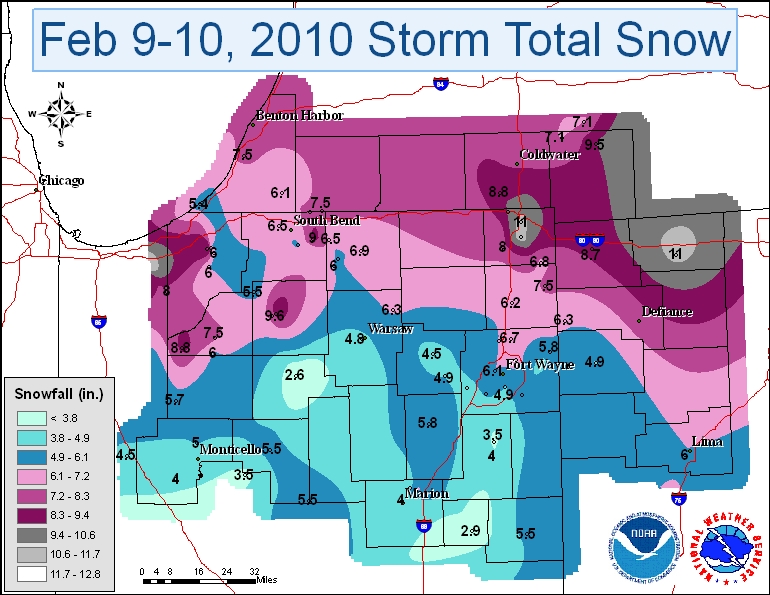
A strong winter storm moved from the Plains into the Midwest on Tuesday February 9th, bringing one of the heaviest snowfalls of the season to many parts of the area (outside of the lake effect region). This synoptic snowfall was followed by a brief but intense single band of lake effect snowfall on the morning of February 10th. Snowfall amounts ranged from as little as 3 inches in just a few spots, to more than 10 in several locations. The majority of our area received between 5 and 9 inches of snow (Figure 1).
Figure 1. Snowfall Total Map for Synoptic and Lake Effect Snow
As we saw during the heavy snowfall event at the beginning of January, another strong blocking pattern over the northern Atlantic Ocean into Greenland and Eastern Canada was partially responsible for the setup that led to this February heavy snowfall event (Figure 2).
|
|
This pattern allowed cold Canadian air to remain entrenched over the western Great Lakes while low pressure developed in the plains and moved through the Ohio Valley region. Deep moisture was pulled north from the Gulf of America ahead of the low (Figure 3). This led to the development of light to moderate snow over the entire area during the morning hours of February 9th (Figure 4). Snowfall accumulations varied significantly across the region as snowflake size was small and rates were generally light. This led to small accumulations in many areas. However...occasional bursts of moderate to heavy snow developed from time to time during the day in areas of stronger forcing which dramatically increased snowfall amounts in some locations. An example of this can be seen in the 1457z radar image in figure 4 across northwest Ohio.
| Figure 3. Water Vapor image from 15z Feb. 9th. | Figure 4. Radar image from 1500z Feb 9th. | |
 |
 |
As the surface low pressure passed by to the south of our area on Tuesday night, a narrow band of snow intensified from west to east across the central portion of the KIWX forecast area (Figure 5). This band initially moved north then south overnight and provided an additional 2 to 4 inches of snow in many areas. As the surface low moved through northern Ohio Tuesday night (Figure 6), the main upper level low moved into the Ohio Valley and this led to the development of a stronger surface low pressure system along the eastern seaboard (Figure 6). This turned out to be the second strong winter storm that dumped another 1 to 2 feet of snow on Washington, D.C., Philadelphia, and many other locations along the east coast that had just received similar amounts only a few days earlier.
| Figure 5. Radar image from 0415z Feb 10th. | Figure 6. Water Vapor image from 04z Feb. 10th. | |
 |
 |
Once the eastern U.S. low began to strengthen and deepen, the weaker low that have moved through the Ohio Valley began to dissipate while the upper level low moved toward the eastern coastal areas on Wednesday morning (Figure 7). Strong northerly winds developed which combined with the cold canadian air created an intense lake effect snow band that began in Illinois on the early morning hours of the 10th. This band moved east as the low level winds backed from northeast to north and eventually northwest. Snowfall rates of 1 to 3 inches per hour were observed around Chicago. By the time this band moved into the KIWX forecast area, it had weakened somwhat but was still providing snowfall rates of around an inch per hour (Figure 8). This band persisted until around noon local time before quickly dissipating as the deeper moisture from the synoptic low pressure system exited the region and warmer temperatures aloft helped shut down the lake effect machine.
| Figure 7. Water Vapor image from 15z Feb 10th. | Figure 8. Radar image from 1500z Feb 10th. | |
 |
 |
As a final gesture by this departing winter storm, once the deep moisture from the system departed, the lake effect snow changed over to freezing drizzle and light freezing rain Wednesday afternoon and evening (Figure 9), providing a thin glaze of ice over parts of northern Indiana and northwest Ohio. This was enough to keep snow covered roads and roads that had been plowed icy, slick and hazardous.
|
|
Below is a table with reporting station and total snowfall for the event.
| STATION | SNOWFALL |
| ANGOLA | 11.9 |
| WAUSEON | 11 |
| ANGOLA 4.1 N | 11 |
| FREMONT 6.4 W | 9.9 |
| LAPORTE | 9.8 |
| PLYMOUTH | 9.6 |
| JONESVILLE 5.9 ENE | 9.5 |
| MISHAWAKA 2.5 SE | 9 |
| NORTH JUDSON 4 W | 8.8 |
| BRONSON 5.9 SE | 8.8 |
| MONTPELIER 0.6 NW | 8.7 |
| WANATAH 2 WNW | 8 |
| HUDSON 4.6 N | 8 |
| GRANGER 1.6 N | 7.8 |
| PLYMOUTH 2.5 WSW | 7.6 |
| KNOX 4.1 SW | 7.5 |
| BUTLER 0.5 NNE | 7.5 |
| HUDSON 4.1 NNW | 7.5 |
| GRANGER 3.5 ENE | 7.5 |
| STEVENSVILLE 1.7 SSE | 7.5 |
| LITCHFIELD 0.3 ENE | 7.1 |
| HANOVER 3.8 W | 7.1 |
| GOSHEN 1.9 NW | 6.9 |
| HAMILTON 1.7 E | 6.8 |
| LEO 2.2 NW | 6.7 |
| FORT WAYNE 7.0 NE | 6.6 |
| ELKHART 4.8 SW | 6.5 |
| SOUTH BEND | 6.5 |
| MARION 5.6 NE | 6.3 |
| HICKSVILLE | 6.3 |
| NWS NORTHERN INDIANA | 6.3 |
| AUBURN 0.8 NE | 6.2 |
| FORT WAYNE 1.3 NNW | 6.1 |
| HUNTERTOWN 2.6 ESE | 6.1 |
| NILES 2.7 W | 6.1 |
| LIMA WWTP | 6 |
| NORTH JUDSON 5.7 ESE | 6 |
| KINGSBURY 0.3 WNW | 6 |
| WAKARUSA 0.3 WSW | 6 |
| KINGSBURY 1 N | 6 |
| LA PORTE 2.3 ESE | 6 |
| SOUTH BEND 4.6 SE | 5.9 |
| HUNTINGTON 0.3 W | 5.8 |
| WOODBURN 3 N | 5.8 |
| LA PORTE 1.2 E | 5.8 |
| FRANCESVILLE 2 SW | 5.7 |
| WAKARUSA 2.4 NNE | 5.6 |
| PORTLAND 1 SW | 5.5 |
| GALVESTON 1.3 ESE | 5.5 |
| LOGANSPORT 2.2 NNW | 5.5 |
| WALKERTON 2.7 SSE | 5.5 |
| FORT WAYNE 9.1 SE | 5.4 |
| NEW BUFFALO 0.4 WNW | 5.4 |
| FORT WAYNE AIRPORT | 5.2 |
| MONTICELLO 4.3 N | 5 |
| FORT WAYNE 4.0 SE | 4.9 |
| COLUMBIA CITY 6.6 SSE | 4.9 |
| PAULDING | 4.9 |
| WARSAW | 4.8 |
| MARION 5.4 NNE | 4.6 |
| FORT WAYNE 9.0 WSW | 4.6 |
| REMINGTON 0.3 SSE | 4.5 |
| WOODBURN 2.8 WSW | 4.5 |
| COLUMBIA CITY 0.5 NNE | 4.5 |
| MARION 2 N | 4 |
| CHALMERS 5 W | 4 |
| BLUFFTON 1 N | 4 |
| CAMDEN 4.9 NNE | 3.5 |
| BLUFFTON 4.1 N | 3.5 |
| HARTFORD CITY 4 ESE | 2.9 |
| ROCHESTER 2.4 NW | 2.6 |
Story compiled and written by Sam Lashley
Snowfall map and table created by B.J. Simpson