Great Mississippi River Flood of Spring 2011

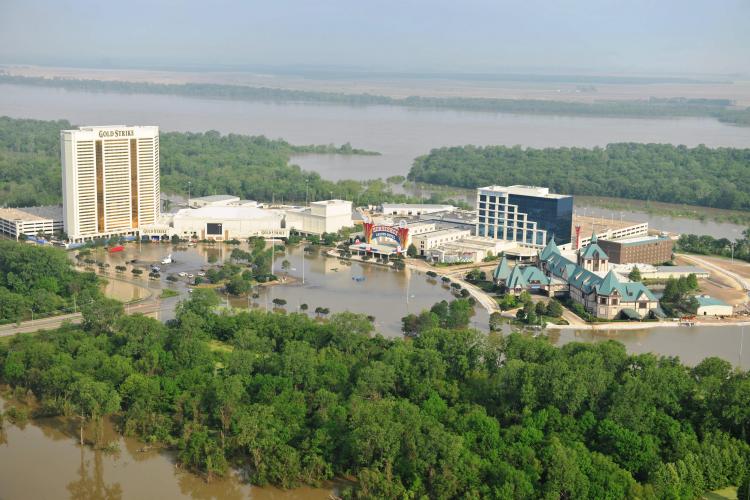
Comparing May 9, 2011 with May 4, 2012. Photos by: Bill Borghoff
Meteorological/Hydrological Antecedent Conditions
River Stages, Records, and Impacts for the Mississippi River
Tiptonville, TN
Caruthersville, MO
Osceola, AR
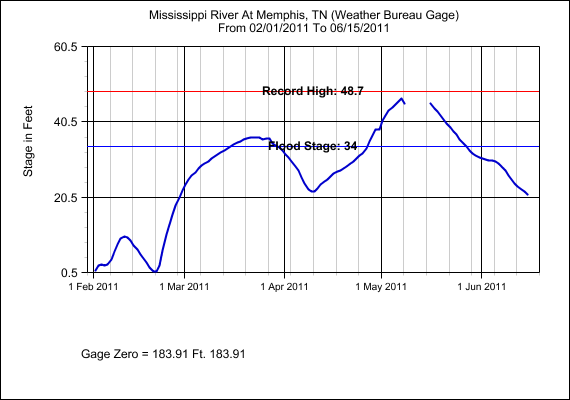
Memphis, TN
Tunica, MS
Helena, AR
How this flood compared to previous events
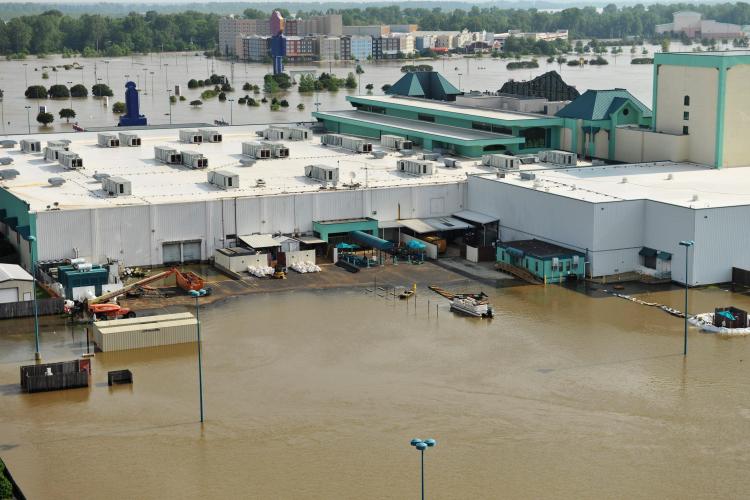
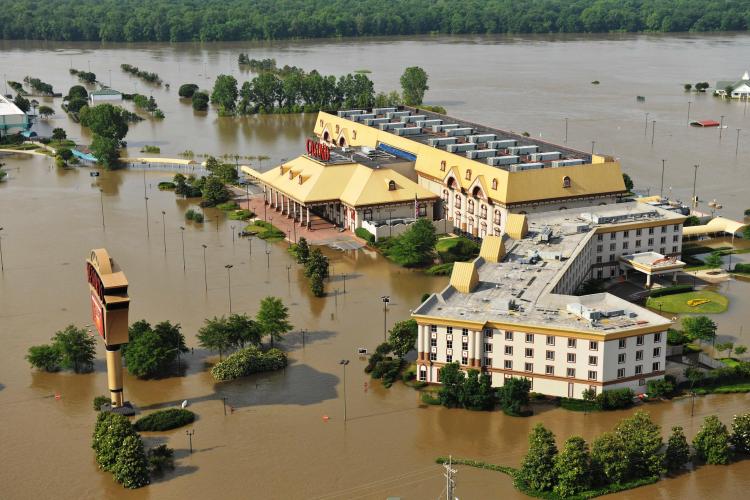
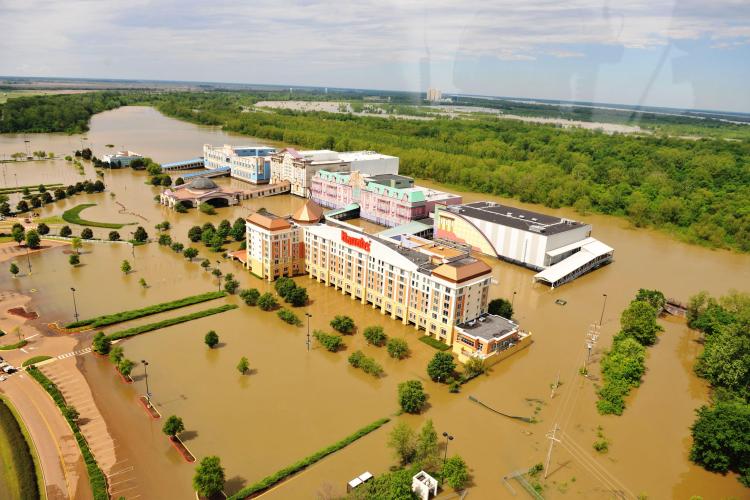
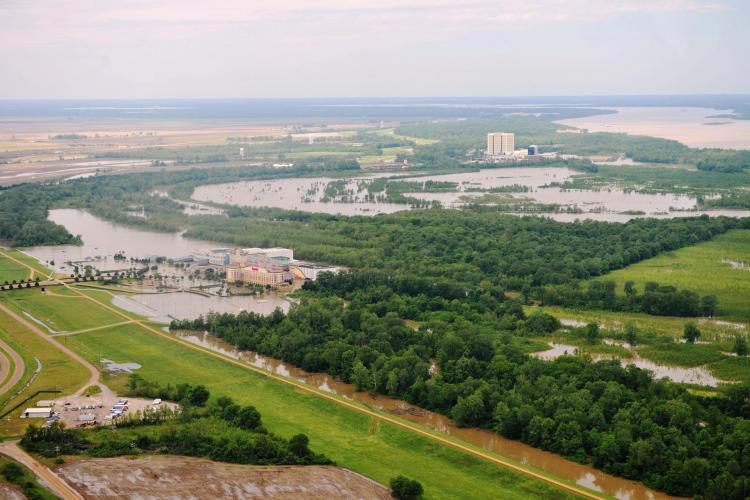
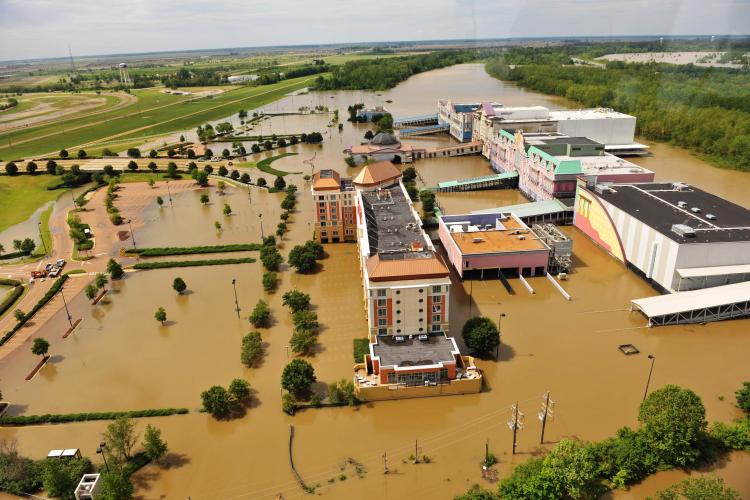
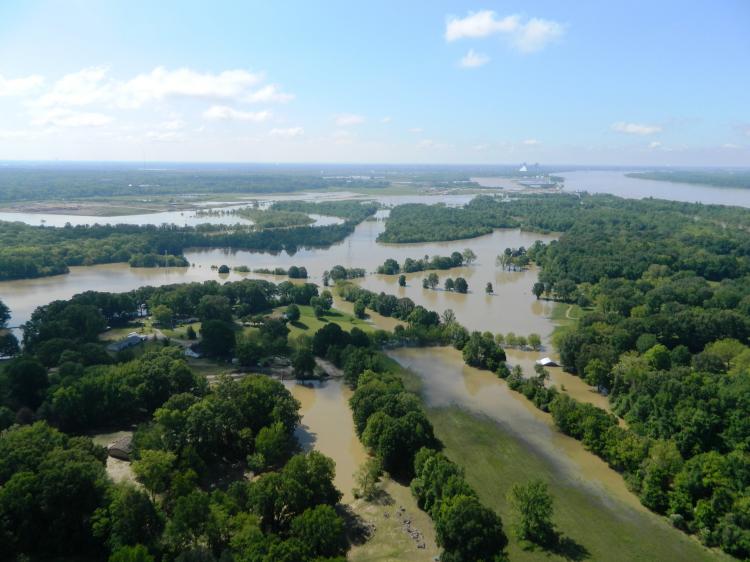
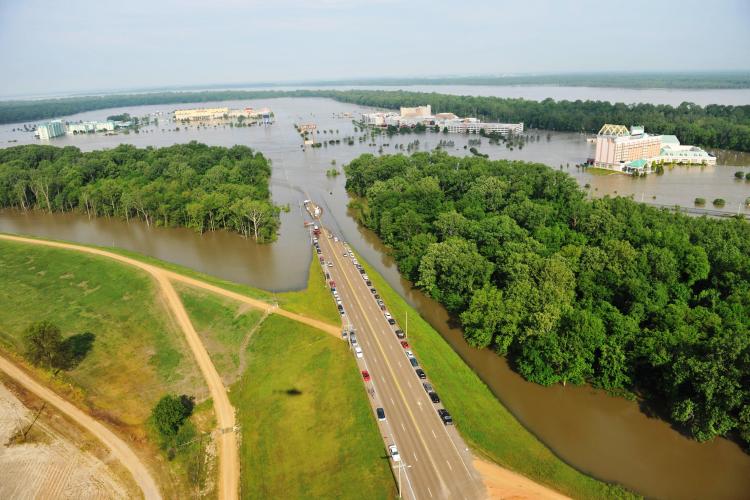
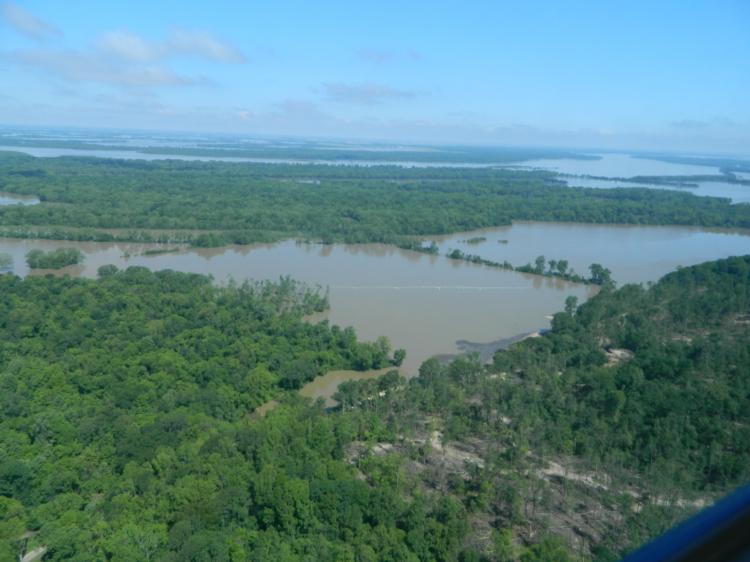
Pictures
Meteorological/Hydrological Antecedent Conditions
Significant Upper Midwest Snowpack
The prevailing weather pattern of winter 2010/2011 featured a trough over the Plains and Upper Midwest, bringing a storm track through the center of the nation. This led to an anomalously high number of powerful winter storms across the Upper Midwest. Many cities near the headwaters of the Mississippi River in Minnesota and across much of the western Great Lakes and Upper Midwest experienced 50 to 75% higher than normal seasonal snowfall.
The Groundhog Day Blizzard was the most powerful of winter storms to impact that region. The storm began across the Southern Plains on February 1st, where it dropped 1 to 2 feet of snow across Texas, Oklahoma, and Missouri. The largest snow amounts occurred across northern Illinois and southern Wisconsin on the 2nd. At Chicago's O’Hare Airport, the 20.2 inches of snow was the third largest storm accumulation ever recorded for the city. Racine, Wisconsin observed 26 inches of snow during the event, breaking the city’s 48-hour and 72-hour snowfall records. The storm left a snow depth of 2 to 3 feet over an expansive area across the Mid Mississippi Valley and western Great Lakes.
The snowpack melted in late February and March when it drained down the Mississippi River. Mostly minor flooding occurred along the Mississippi in the Midsouth with this spring thaw without creating too many problems. However, as the hydrographs indicate, this first round was slow to recede and the events leading up to the catastrophic event were worse because of the already swollen river and its tributaries.
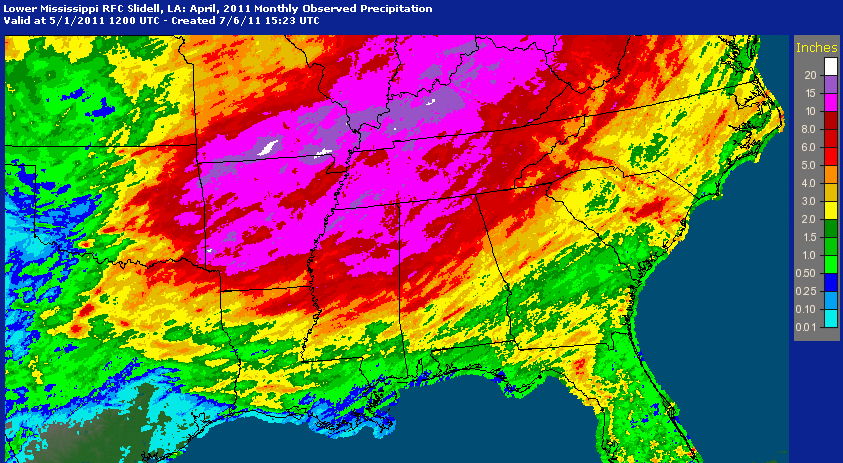
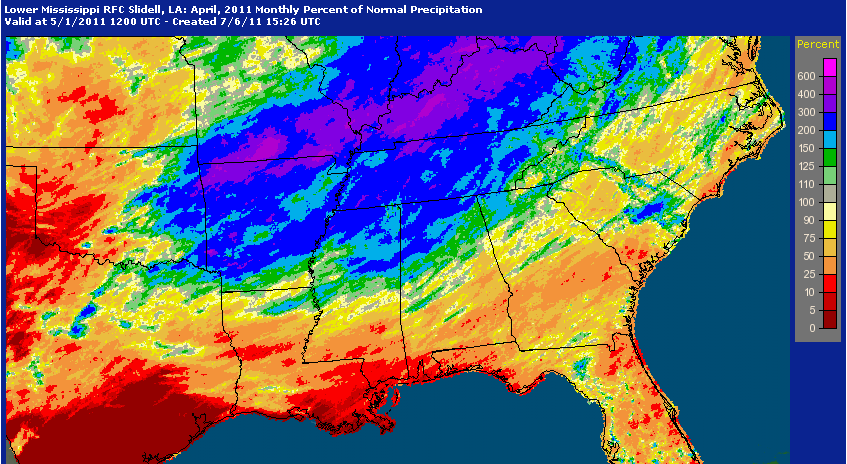
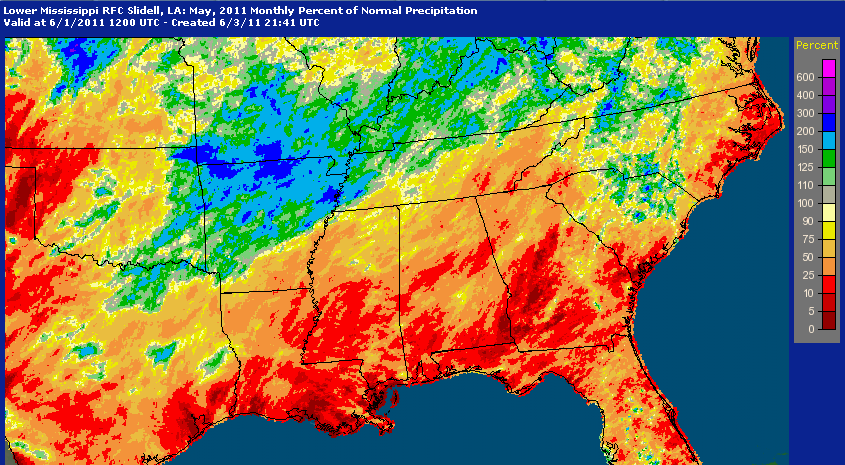
April 2011 Excessive Rainfall
A very stagnant pattern and a quasi-stationary front along the Ohio River basin persisted for the last half of April 2011. Deep tropical moisture surged northward, intersecting this boundary and transient weather disturbances. The result were numerous large thunderstorm complexes propagating across eastern Oklahoma, Arkansas, southern Missouri, western Tennessee, and northeast along the entire Ohio River basin, leaving considerable rainfall totals. Widespread amounts ranged from 15 to 20 inches, but localized areas in southeast Missouri recorded more than two feet of rain.
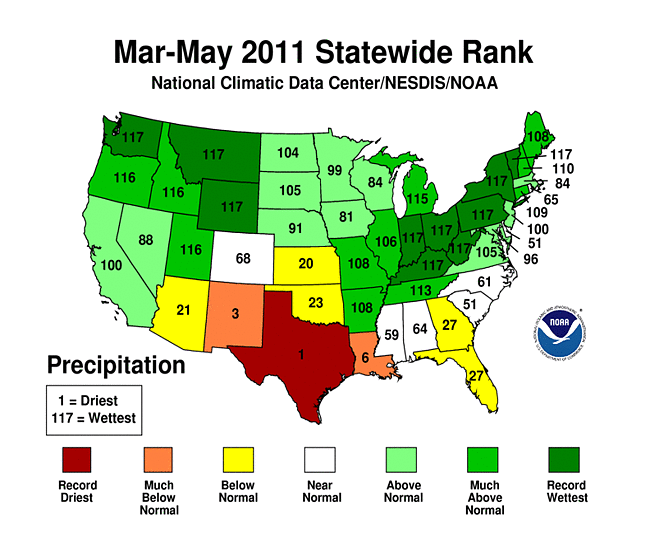
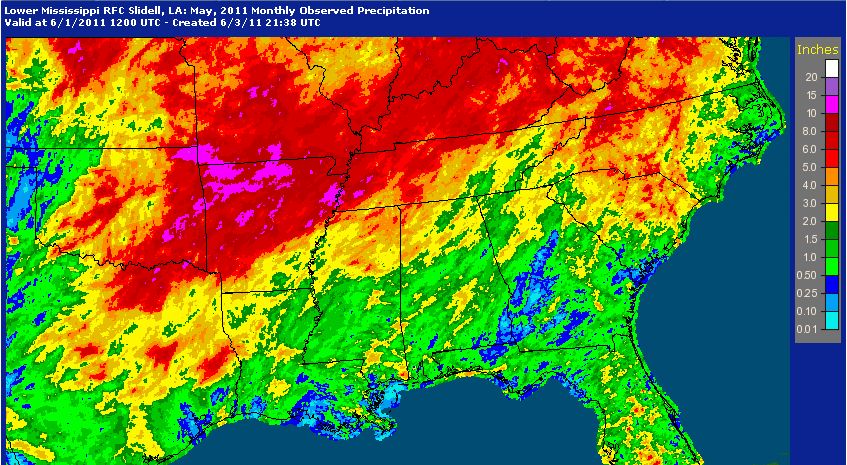
Because such excessive rain fell across the entire Ohio Valley and Mid Mississippi Valleys, incredible amounts of water built up in these river basins and set the stage for record flooding and billions of dollars worth of damage. The period of March through May 2011 was the wettest on record for much of the Ohio Valley.
Click the following images to enlarge:
|
|
|
|
Below are selected rainfall totals for April 2011 through May 5, 2011:
Cape Girardeau, MO: 24.89 inches
Poplar Bluff, MO: 24.04 inches
Paducah, KY: 21.81 inches
West Plains, MO: 18.68 inches
WFO Memphis: 17.96 inches
Harrison, AR: 17.75 inches
Mountain Home, AR: 17.67 inches
Louisville, KY: 17.33 inches
Evansville, KY: 16.66 inches
Jackson, TN: 15.90 inches
Memphis, TN: 15.84 inches
Dyersburg, TN: 15.18 inches
Cincinnati, OH: 14.58 inches
Batesville, AR: 14.22 inches
Jonesboro, AR: 13.93 inches
We examine the Mississippi River from north to south through the Midsouth.
Note: the Memphis and Tunica gages malfunctioned due to the stage of the river near its crest. The official stage was obtained later from watermarks.
Tiptonville, TN
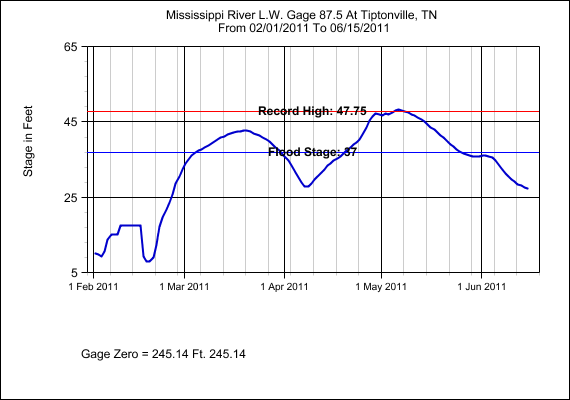
Flood Categories (in feet)
| Major Flood Stage: | 47 |
| Moderate Flood Stage: | 45 |
| Flood Stage: | 37 |
| Action Stage: | 34 |
Historical Crests
(1) 48.35 ft on 05/05/2011
(2) 47.75 ft on 02/06/1937
(3) 46.00 ft on 05/29/1995
(4) 45.50 ft on 05/10/1983
(5) 45.10 ft on 04/03/1975
Impacts
Lake County:
A few homes along the river were flooded and sustained damage while additional homes in Tiptonville were flooded and sustained minor damage. Campgrounds at Reelfoot Lake were flooded. Several thousand acres of agriculture fields were flooded. Several roads were flooded and/or damaged. Lake County Airport was closed due to the flooding.
Total damages: $750,000
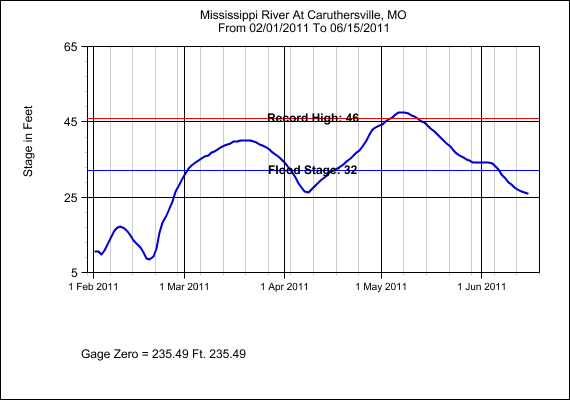
| Major Flood Stage: | 43 |
| Moderate Flood Stage: | 41 |
| Flood Stage: | 32 |
| Action Stage: | 29 |
Historical Crests
(1) 47.61 ft on 05/07/2011
(2) 46.00 ft on 02/05/1937
(3) 42.40 ft on 04/04/1975
(4) 42.40 ft on 04/03/1973
(5) 42.21 ft on 03/11/1997
Impacts
Pemiscot County:
The city of Caruthersville held back the river by reinforcing the flood wall with sandbags thus the city was able to stay mainly dry with the exception of a few streets that were flooded. However, surrounding areas were flooded including many agriculture fields and a few homes right along the river. The casino boat in Caruthersville was closed due to flooding. Barge traffic was closed for a short time on the river.
Total damages: $250,000
Dyer County:
A few homes along the river were flooded and sustained damage. Several thousand acres of agriculture fields were flooded. Several roads were flooded and/or damaged.
Total damages: $750,000
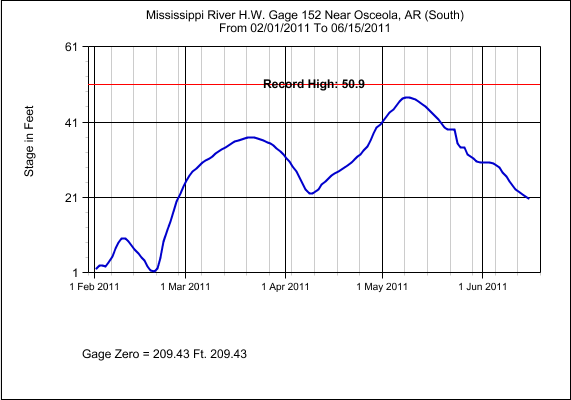
| Major Flood Stage: | 35 |
| Moderate Flood Stage: | 31 |
| Flood Stage: | 28 |
| Action Stage: | 24 |
Impacts
Mississippi County:
About 50 homes were damaged by backwater flooding from the Mississippi River into tributaries and along the Mississippi River itself. Several thousand acres of agriculture fields were flooded. Several roads were flooded and/or damaged.
Total damages: $750,000
Lauderdale County:
A few homes along the river were flooded and sustained damage. Several thousand acres of agriculture fields were flooded. Several roads were flooded and/or damaged.
Total damages: $750,000
Tipton County:
A few homes along the river were flooded and sustained damage. Several thousand acres of agriculture fields were flooded. Several roads were flooded and/or damaged.
Flood Categories (in feet)
| Major Flood Stage: | 46 |
| Moderate Flood Stage: | 40 |
| Flood Stage: | 34 |
| Action Stage: | 28 |
Historical Crests
(1) 48.70 ft on 02/10/1937
(2) 48.03 ft on 05/10/2011
(3) 45.80 ft on 04/23/1927
(4) 40.76 ft on 03/14/1997
(5) 40.50 ft on 05/08/1973
Impacts
Shelby County:
Portions of Beale Street, Riverside Drive, Tom Lee Park and the Pyramid parking lot were flooded. Portions of Mud Island flooded as well including the Mud Island Ampitheater. The flooding wiped out nearly half mile section of the eastern bank of Presidents Island. As a result, the port at McKellar Lake was closed. Several businesses on Presidents Island sustained damage. Backwater from the Mississippi River caused the Wolf River to rise above flood stage. Numerous homes along the Wolf River in North Memphis and Raleigh were flooded as a result. Two mobile home parks in Millington were evacuated due to concerns of high water on Big Creek from backwater of the Mississippi River.
Total damages: $2,000,000,000
Crittenden County:
Levees held back the water thus only a few homes along the river were flooded and sustained damage. Several thousand acres of agriculture fields were flooded. Several roads were flooded and/or damaged.
Total damages: $500,000
Desoto County:
The Lakeview community was flooded. Several homes were flooded and sustained at least minor damage. Several roads were flooded and/or damaged as well. Several hundred acres of fields were flooded as well.
Total damages: $750,000
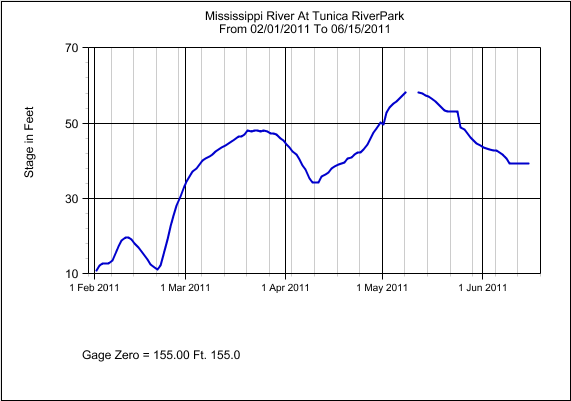
Flood Categories (in feet)
| Major Flood Stage: | 52 |
| Moderate Flood Stage: | 46 |
| Flood Stage: | 41 |
| Action Stage: | 38 |
Historical Crests (Records only go back a few years)
(1) 58.45 ft on 05/10/2011
(2) 48.66 ft on 03/22/2011
(3) 46.83 ft on 04/18/2008
Impacts
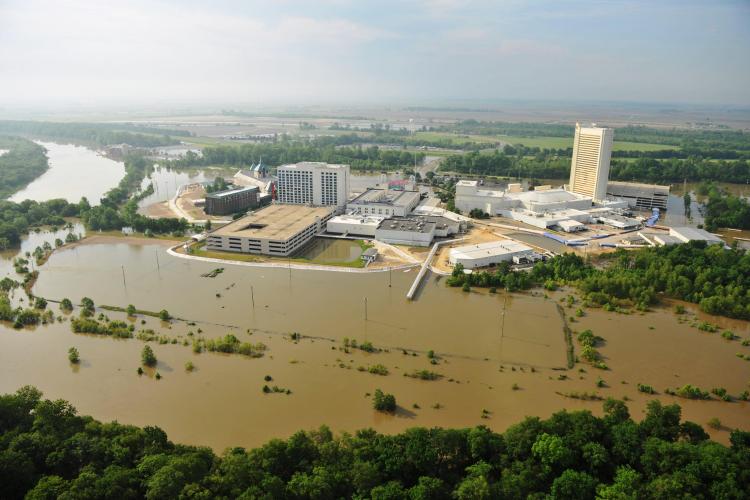
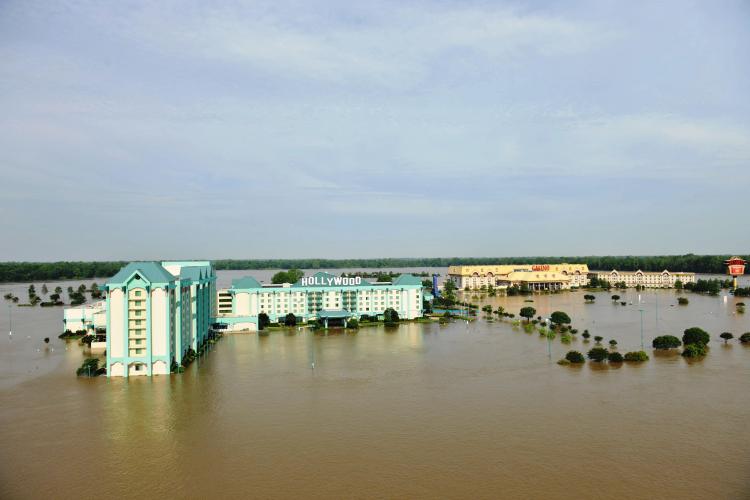
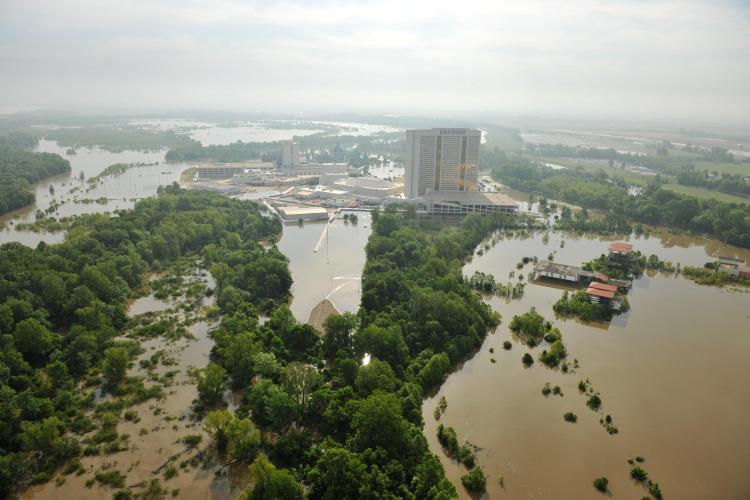
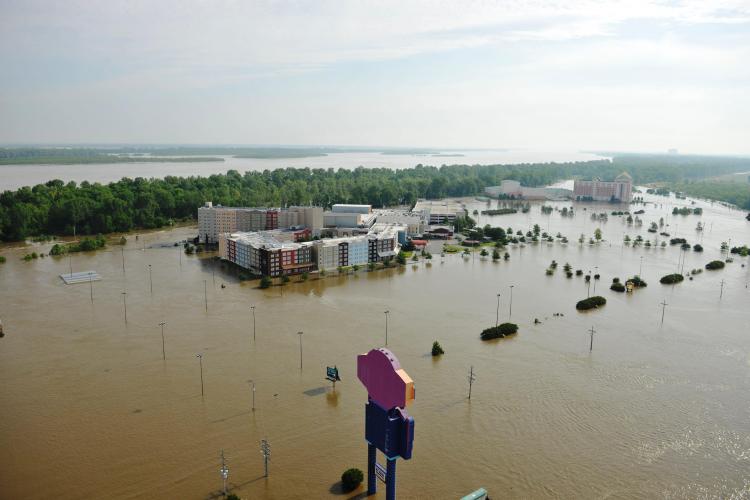
Tunica County:
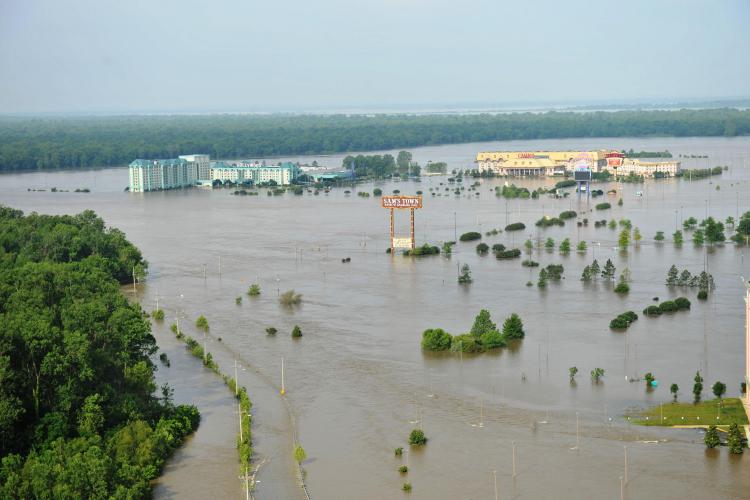
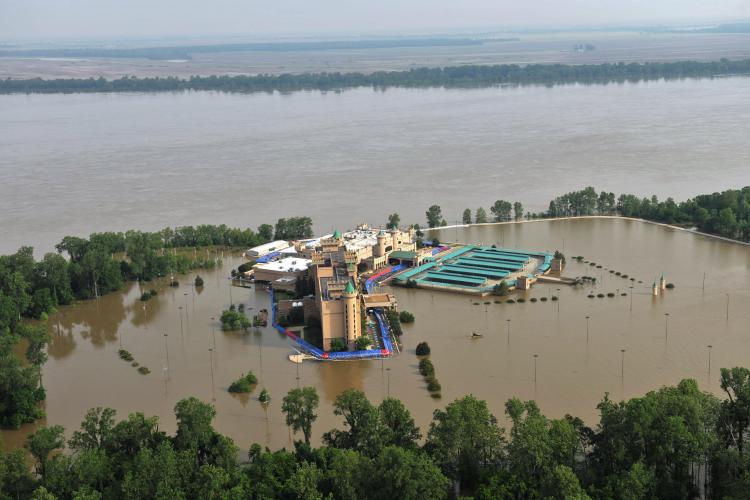
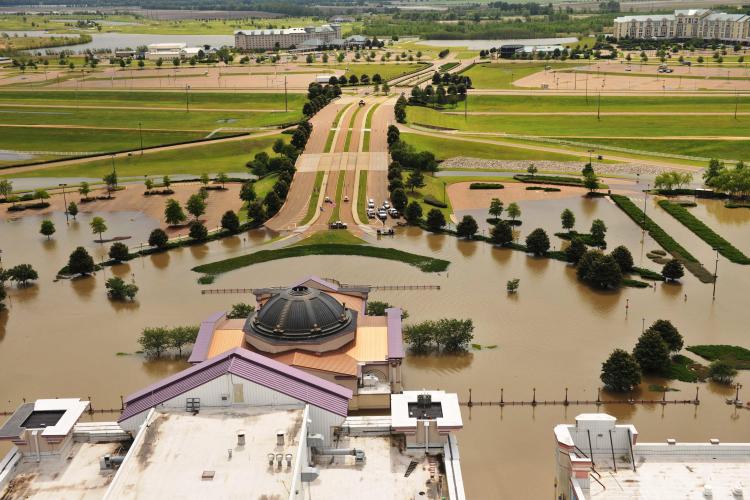
The area known as Tunica Cut-Off was flooded as many as 357 homes sustained damage. All nine casinos in Tunica County were closed and sustained some damage from flooding. Several roads were flooded and/or damaged. Several hundred acres of fields were flooded as well.
Total damages: $1,000,000,000
Lee County:
Several homes sustained minor damage from the flooding. Several roads were closed and/or damaged. Several hundred acres of cropland was flooded. Backwater from the Mississippi River aggravated flooding further on the St. Francis River and L'Anguille River.
Total damages: $550,000
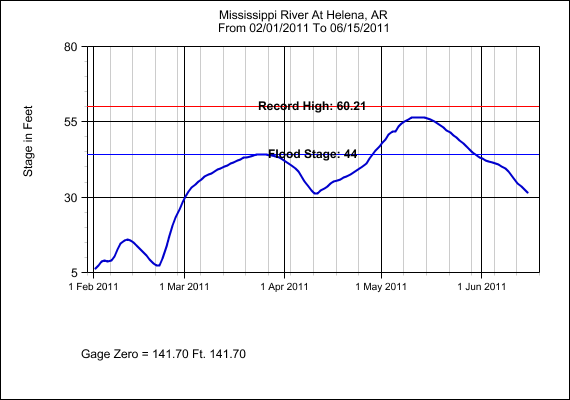
Flood Categories (in feet)
| Major Flood Stage: | 55 |
| Moderate Flood Stage: | 50 |
| Flood Stage: | 44 |
| Action Stage: | 40 |
Historical Crests
(1) 60.21 ft on 02/12/1937
(2) 56.75 ft on 04/27/1927
(3) 56.59 ft on 05/12/2011
(4) 55.20 ft on 04/22/1913
(5) 54.30 ft on 04/22/1912
Impacts
Phillips County:
Helena-West Helena escaped the flood waters by reinforcing the flood wall with sandbags. A residential area off of Highway 44 and Lithium Road was evacuated as a precaution. A few roads were flooded and/or damaged. Several thousand acres of fields were flooded.
Total damages: $200,000
Coahoma County:
A few homes located right along the river were flooded and sustained damage but mostly forest area along the river was flooded. A few roads were flooded and/or damaged. Several hundred acres of fields were flooded.
Total damages: $750,000
How this flood compares to previous events
This flood ranks in the top three floods for the Mississippi River since records began, and in some cases was the worst. It is difficult to quantify differences between flood events because the bathymetry of the river bottom changes constantly. In addition, levee systems were developed substantially after the 1927 flood and measuring techniques have also evolved over time. Nonetheless, it is safe to say this was one of the most devastating flooding events along the Mississippi River in the Midsouth with over 2 billion dollars worth of damage.
For a more comprehensive summary of this event and how past planning helped to mitigate the effects of this flood, consult this online book by Charles A. Camillo called, Divine Providence.
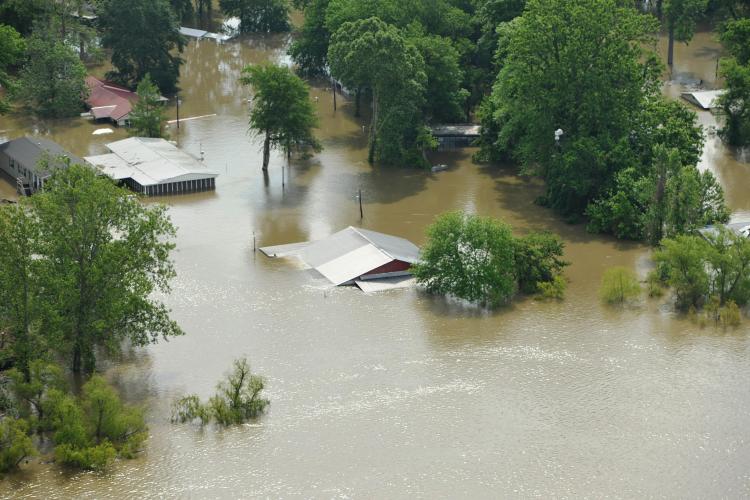
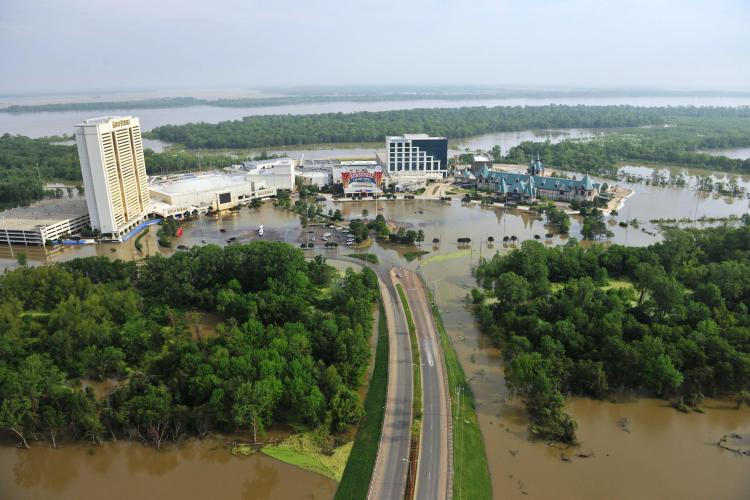
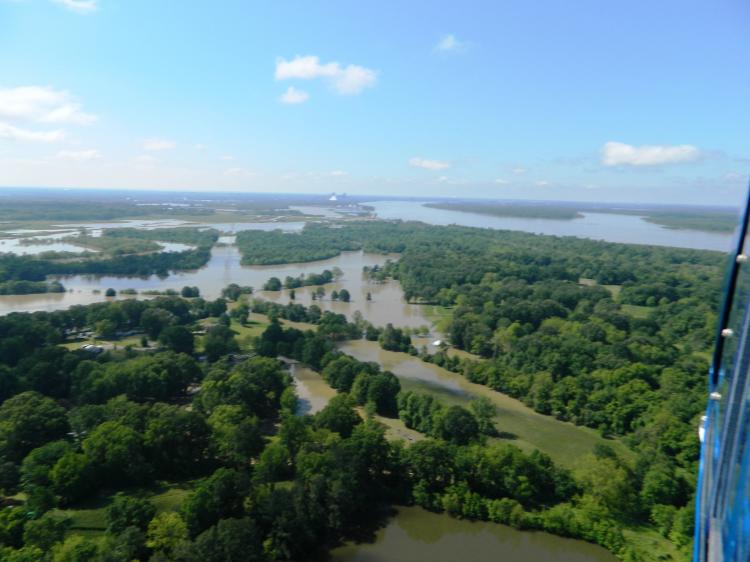
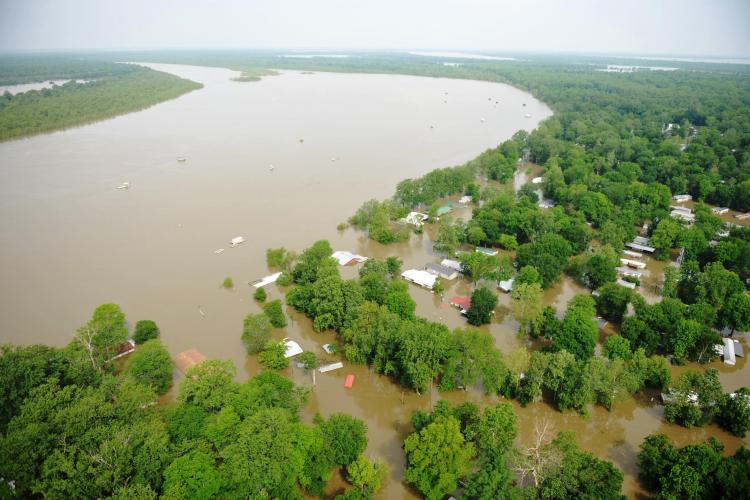
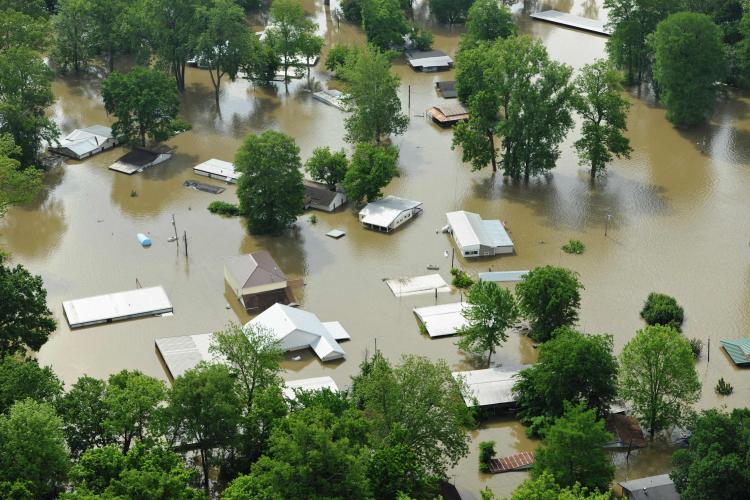
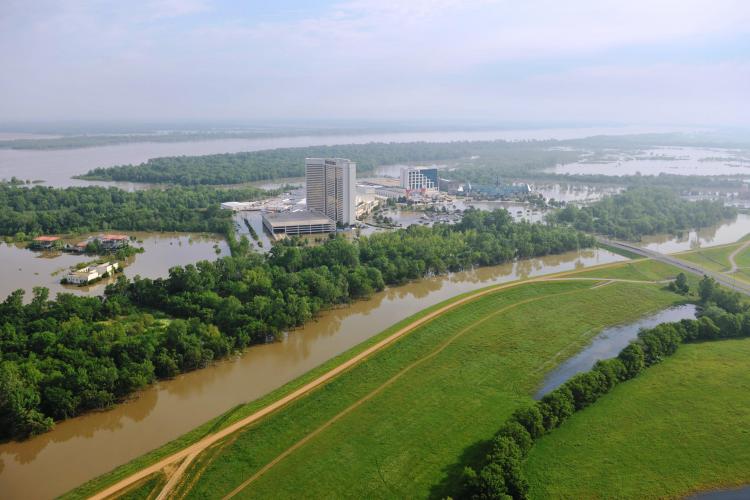
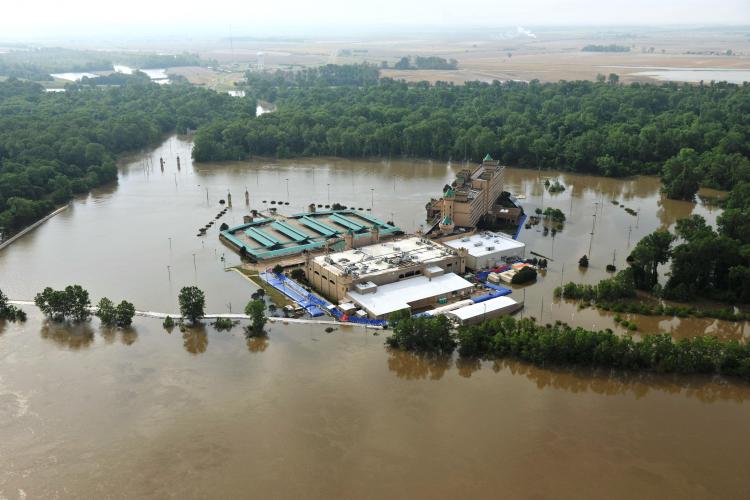
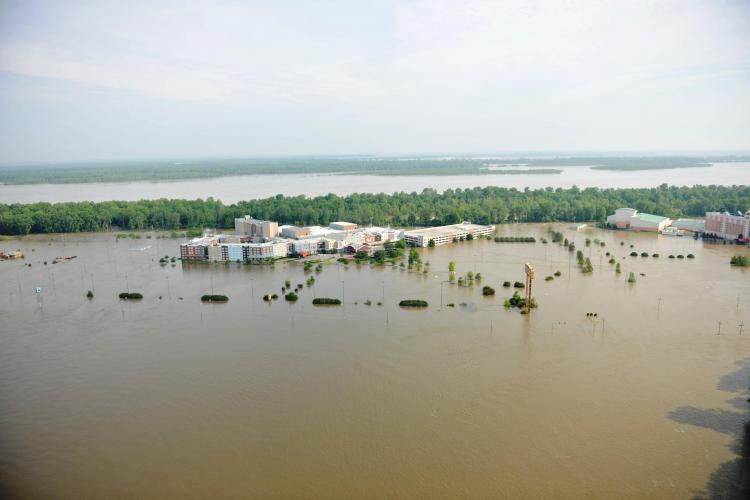
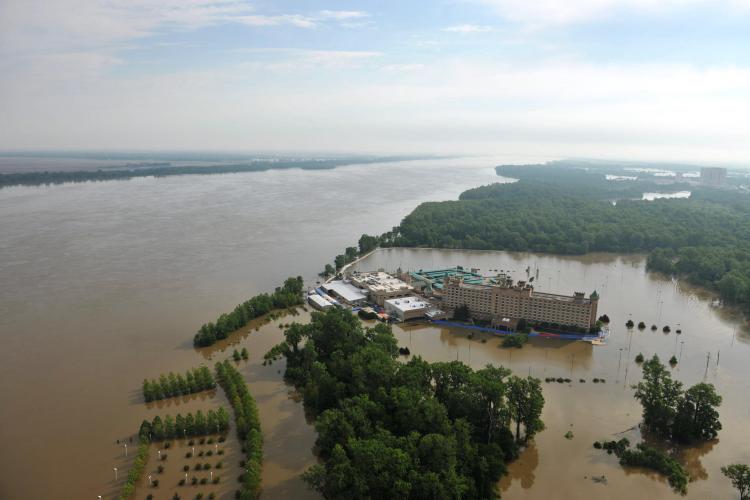
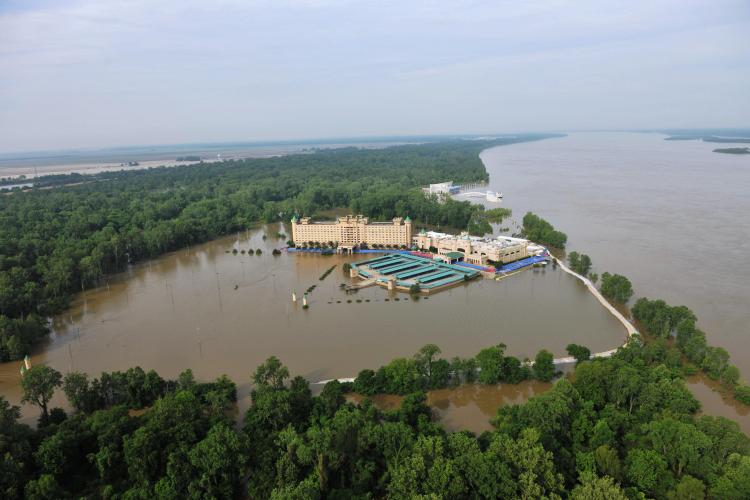
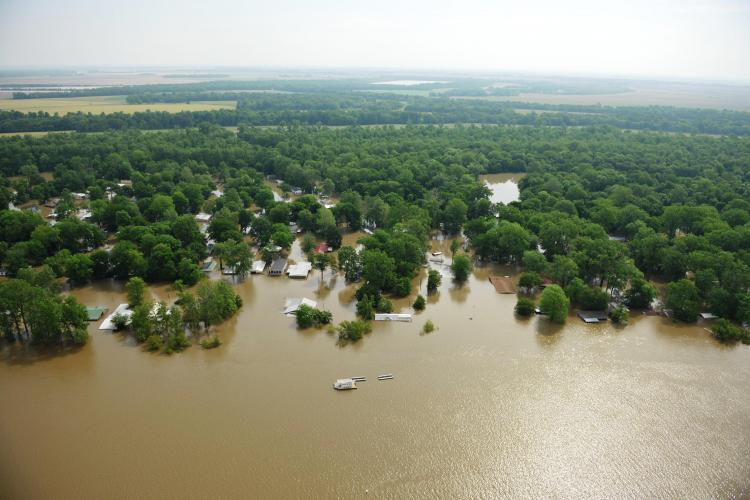
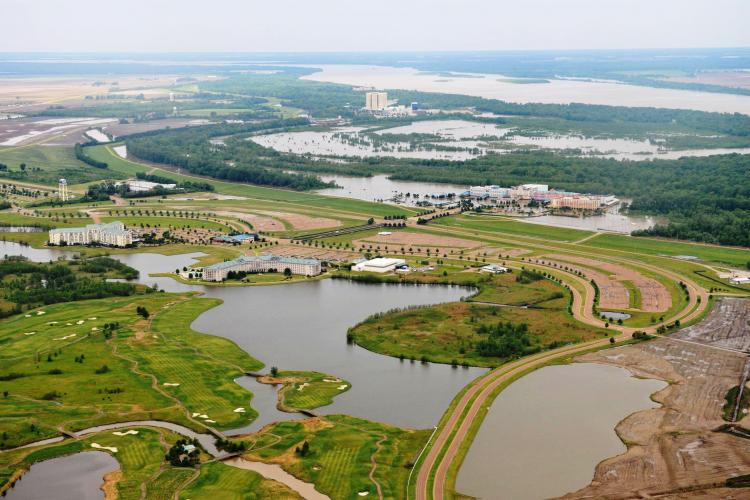
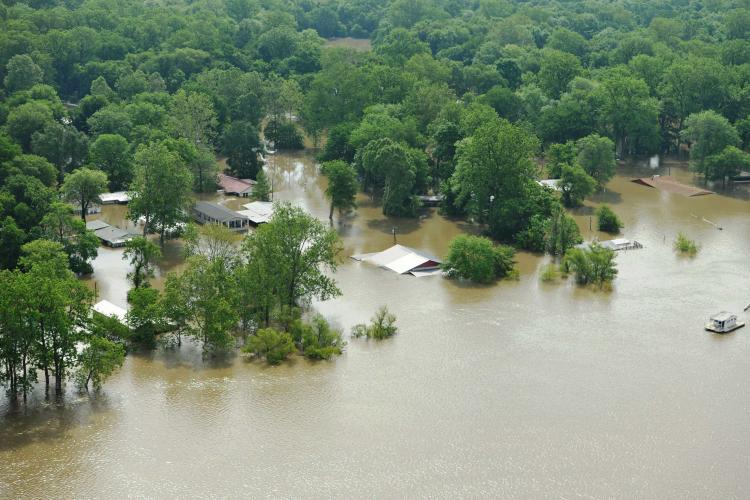
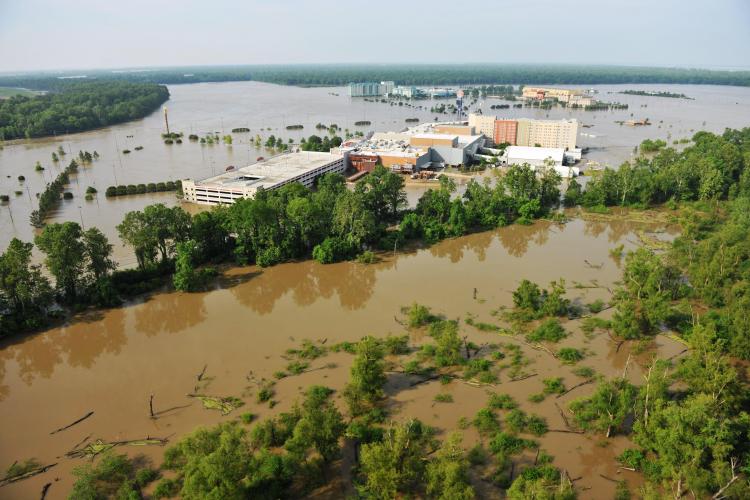
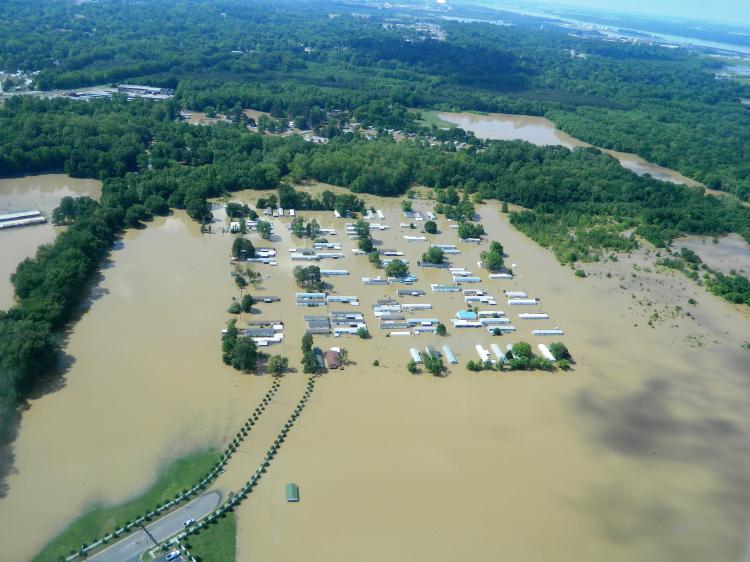
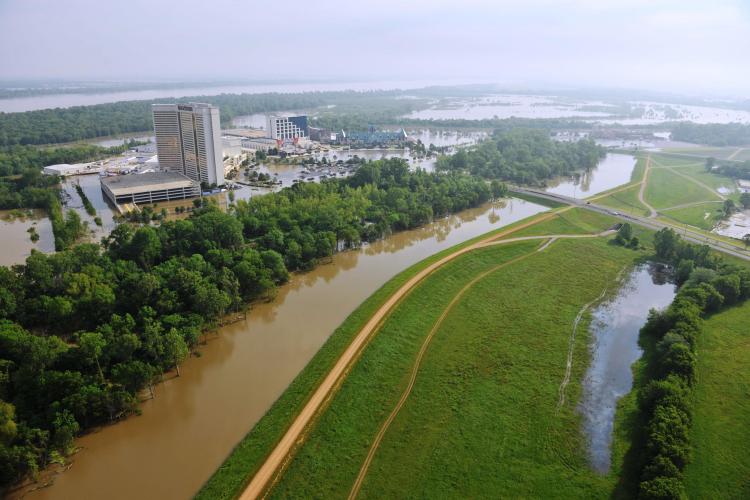
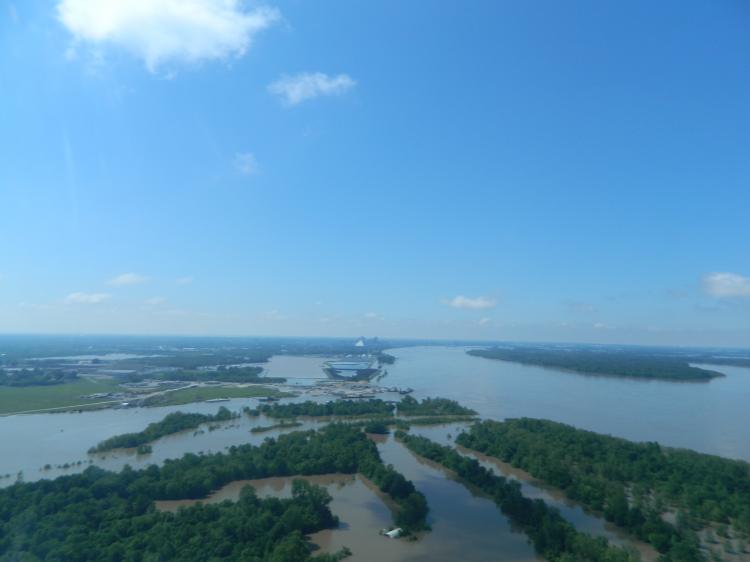
Pictures
Click to enlarge:
 |
 |
 |
 |
 |
 |
 |
 |
 |
 |
 |
 |
 |
 |
 |
 |
 |
 |
 |
 |
 |
 |
 |
 |
 |
 |
 |
 |
 |
 |
 |
 |
 |
 |
 |
 |
 |
 |
 |
 |
Acknowledgements
The climate plot of precipitation is from the National Climatic Data Center. The rainfall and rainfall anomally maps are from the NWS' Advanced Hydrologic Prediction System. The hydrographs are from the U.S. Army Corps of Engineer's rivergages.com website. The pictures are from the NWS Memphis, Memphis District of the Army Corps of Engineers.
Borghoff

