The rainfall event on the 8th - 10th of November produced record flooding in northern New York watersheds including the Ausable and Saranac River watersheds. According to the United States Geological Survey (U.S.G.S.) office in Albany, New York, the November 1996 event was a 100 to 200 year return period flood. Basin wide, 4 to 5 inches of rain fell in these watersheds with some point rainfall observations in the 6 to 7 inch range for the entire event. The heaviest rainfall intensity that was found in or near these watersheds was 4.30 inches in 7 hours at Peru, New York in the Little Ausable River watershed.
Federal Disaster Areas as declared by President Clinton included Clinton and Essex counties where damage reports exceeded 30 million dollars. The major rivers in these disaster area counties are the Ausable, Saranac, and Chazy. The U.S.G.S. reported that this event was greater than the previous recorded ice jam/snowmelt floods that frequent the region. The gage reading at the East Branch of the Ausable River at Ausable Forks was 1.18 feet higher than the previous record flood.
Extremely warm air along the Eastern seaboard for early November in New York and New England preceded a strong cold front moving in from the Midwest. The 1340Z surface map prepared on the 8th of November showed a 1035mb High pressure system south of Newfoundland and a 985mb Low pressure system over Hudson's Bay. A strong cold front extended south from the Low pressure system in Canada all the way to the Yucatan Peninsula in Mexico at 12z on the 8th and progressed eastward to the New England coast at 03z on the 10th (Figure 1).
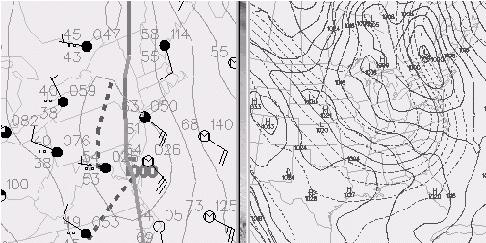 |
| Figure 1: Surface Map - 1340Z November 8, 1996 |
The slow progression of this front and a long fetch of 850mb winds advecting moisture into eastern New York and western New England can be seen on satellite imagery (Figure. 2). From the GOES water vapor imagery alone, the moisture transport from the eastern Caribbean was not well defined. Figure 2 is a GOES infrared image that shows the connection of moisture from Central America.
 |
| Figure 2: GOES Infrared Imagery -- Cold front stretching from Canada to Central America - 12z 11/9/96 |
Figure 3 shows the 850mb winds advecting higher dew points into eastern New York and western New England along with the 300mb pattern. Precipitable water values from the tropical connection to the south were nearly 200% of normal at 1.6 inches. Synoptic scale flooding often occurs when precipitable waters are greater than 180% of normal with the moist 850mb flow.
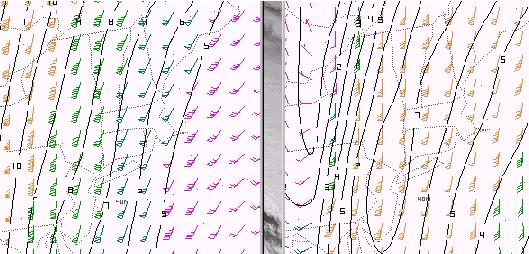 |
| Figure 3: Images of 850 mb winds (left) and the 300 mb pattern (right) |
Figure 4 shows the THETA-E 850mb pattern depicting the moisture tongue in the northern Adirondacks. The 300mb winds are also aligned with the surface and 850mb flow along the East coast. The ETA 850mb THETA-E ridge is clearly evident over the most affected watersheds (i.e. the Chazy, Ausable, and Saranac Rivers in the northeastern corner of New York just west of the Vermont border). The Theta-e ridge is forecast to slowly move east during the 12 hour period. The surface and 500mb analysis also showed a negatively tilted trough digging into the area from the Midwest with high dew points and a deep moisture layer ahead of the front.
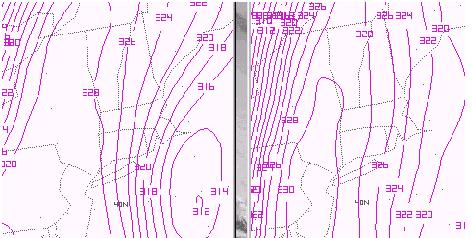 |
| Figure 4: Images of the 850 mb Theta-e pattern. |
No major rainfall event had occurred for at least 2 weeks prior to this event in Essex and Lewis counties. Overall rainfall for the previous 30 days in this part of the Adirondack/western Champlain basins was in the average to above average range. Streamflow was near normal for the time of year in this part of New York prior to the event. Vegetative cover was no longer a consideration as the late autumn season was underway, therefore evaporation and transpiration were now negligible.
Rainfall in the affected area began in western portions of the basins with a heavy shot before 00Z on the 9th and again later between 03Z and 10Z with another shot of heavy precipitation. The earlier rainfall was estimated between 1 and 2 inches with 2 to 4 inches falling in the next heavy round of precipitation. Interestingly, however, a heavy area of rain ahead of the main frontal precipitation produced 2.05 to 4.30 inches in a 7 hour period in the Saranac and Little Ausable River basins at Gabriel, NY and Peru, NY.
At one point during the early morning on Saturday, the 9th, both rivers were rising at 1 foot per hour. Figure 5 below shows the stage versus time hydrograph for the event. The dashed red line on the graph is the current stage when flooding begins. The shape of each hydrograph is an indicator of the geomorphologic response of each basin. This information also relates the requirement of good, reliable real-time rainfall data that is necessary to make a timely forecast.
The East Branch of the Ausable, with a flood stage of 7 feet, crested at 15.15 feet at 10Z on November 9. The Saranac River at Plattsburgh, which also has a 7 foot flood stage, crested at 11.8 feet at about the same time. The stage at Ausable Forks was the record stage recorded at that gage.
 |
| Figure 5: Images of the flood hydrographs for the East Branch of the Ausable (left) and Saranac River (right). |
Heaviest precipitation from the Burlington, Vermont (Figure 6) is indicated west of the headwaters of the Ausable and Chazy Rivers, but bright band contamination was evident with the radar as well as some under estimation in the basins themselves according to the final storm totals from the sparse observer network.
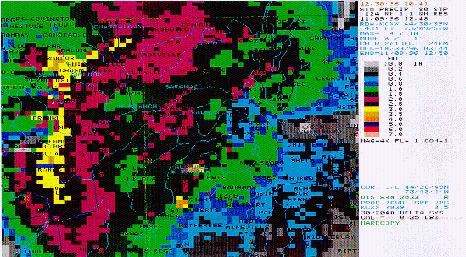 |
| Figure 6: Image of Burlington, VT radar. |
East Branch Ausable River preliminary backwater analysis was completed using the available mapping and USGS information to determine the backwater affect on the stage at the USGS gage during extreme events. After coordinating with the USGS on the flooding at the gage site, they indicated the area just downstream of the gage between the two bridges tends to cause a backwater condition during extreme events due to the configuration of the river, bridges, and the roadway downstream of the gage. During the flooding in November 1996, the gage area was inundated with flow going through the bridge and weir flow going over a portion of the roadway. A hydraulic analysis using HEC-RAS and HEC-2 from available data indicated a 2 to 3 foot backwater effect from the downstream channel and the adjacent bridge structures. The floodplain top width at the gage is near 700 feet wide and constricts to 365 feet downstream of the bridge. Both the bridge and downstream channel cause a combined backwater near 2.5 feet for the extreme flood event analyzed. Better survey data would refine the analysis to allow for a better rating curve definition at the gage during extreme high flows. USGS personnel at the site during the event indicated a backwater effect was occurring in the reach downstream of the gage from the gage site to a point nearly 1500 feet downstream.

