Summary: A rapidly intensifying low pressure system tracked from off the Southeast US coast on Christmas day and then past the Mid Atlantic Coast on Sunday December 26th to just east of Long Island by early Monday morning December 27th. This intense low pressure system spread snowfall into the region Sunday morning...with bands of heavy snow plus embedded thunderstorms and very strong winds affecting the region Sunday afternoon through Sunday night. The powerful blizzard brought a widespread area of 20 to 30 inches of snow across the NYC metro, Northeast New Jersey and Lower Hudson Valley...with 10 to 20 inches to the east. The heavy snow was accompanied by areawide winds of 25 to 40 mph and gusts in excess of 60 mph Sunday afternoon into Sunday night...resulting in near whiteout conditions with blowing and drifting snow and making travel extremely difficult to nearly impossible.
Synopsis
There were several synoptic players in this intense blizzard. In the top left panel...northern stream and southern stream jet energy phased together with a 150+ kt upper jet streaking up the coast and allowing for rapid intensification of the mid and low level low pressure system as it tracked up the coast. In the top right panel...a rapidly deepening closed mid-level low tracked just south of the region enhancing the instability and instensifying the banding across the region. In the lower left panel...a tight baroclinic zone and strong low level jet dynamics allowed for strong frontogenic forcing and upward motion of incoming Atlantic/Gulf moisture...resulting in heavy snow banding across the region. Meanwhile at the surface...a rapidly intensifying low pressure system tracking just southeast of Long Island and polar high anchored across the central US resulted in a strong pressure gradient and therefore the very strong winds.
|
300mb
|
500mb
|
 |
 |
|
850-700mb Frontogenesis
|
Surface
|
 |
 |
Sounding
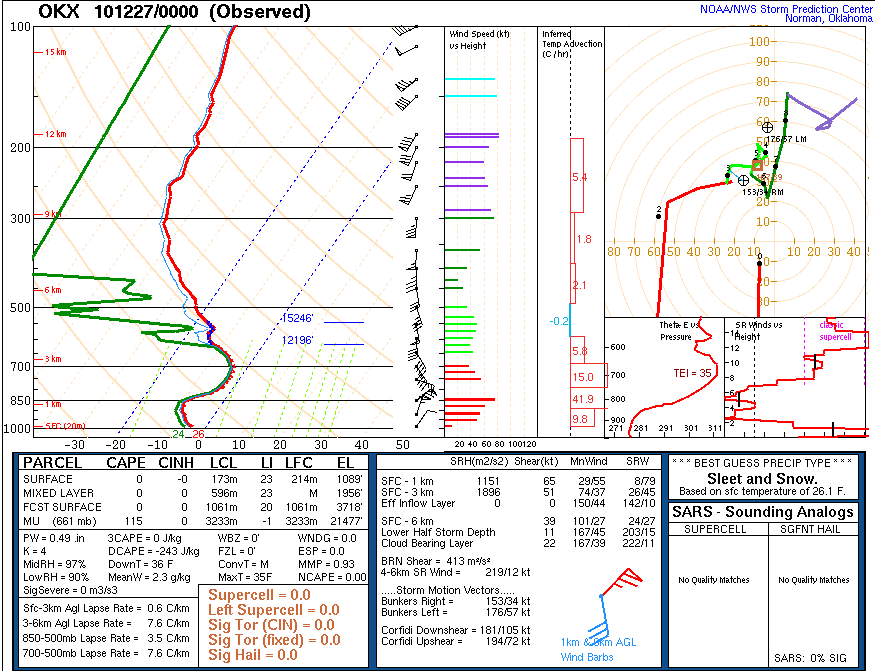
The following sounding depicts the steep mid-level (700-500 mb) lapse rates and elevated instability that developed Sunday evening as the upper low tracked just south of the region. The available instability further strengthened the snow banding and facilitated development of thundersnow. Also note the 80 kt low-level jet at 850 mb and 55-60 kt at 925 mb which was mixed down in the heavy snow bands and caused the very strong winds.
|
OKX 12/27/2010 00Z Upper Air Sounding
|
|
 |
|
Satellite Imagery
The following are GOES satellite loops of the powerful storm system as as it affected the area. On the water vapor imagery to the left...note the trough digging to the gulf coast with closed low sliding south of the region and the strong upper jet (yellow/orange) racing up the coast...all providing deep lift of Atlantic and Gulf moisture over the region. On the IR imagery to the right...note the cooling cloud tops (red) to the left of the low pressure track...indicative of strong upward vertical motions and convective elements producing heavy snow. Also a fuzzy "eye" of low pressure can be made out tracking se of LI...evidence of an intense low pressure system.
|
Water Vapor Satellite Loop
|
IR Satellite Loop
|
 |
 |
Radar Data:
OKX 0.5 Degree Reflectivity Data
The following is a base reflectivity RADAR loop from the KOKX WSR-88D with surface fronts and pressure overlayed. Note the mutiple convective bands of heavy snow feeding off the ocean into the large stationary N/S very heavy snow band (with occasional lightning) across Northeastern New Jersey, New York City Metro, and the Lower Hudson Valley. This is a common radar presentation seen in the most intense winter storms.
Another interesting note with this system was the development of a secondary heavy snow/rain band across Eastern Massachussets Sunday night and a corresponding lack of radar returns just to the west across Eastern Connecticut and Central Massachussetts. This accounted for the lower snow totals in this area...and may have been due to subsidence on the cold side of the frontogenetic band.
National Weather Service New York, NY Watch/Warning/Advisory Products
The following Watches, Warning, Advisories were issued for this event by The New York, NY National Weather Service Office:


 Coastal Flooding
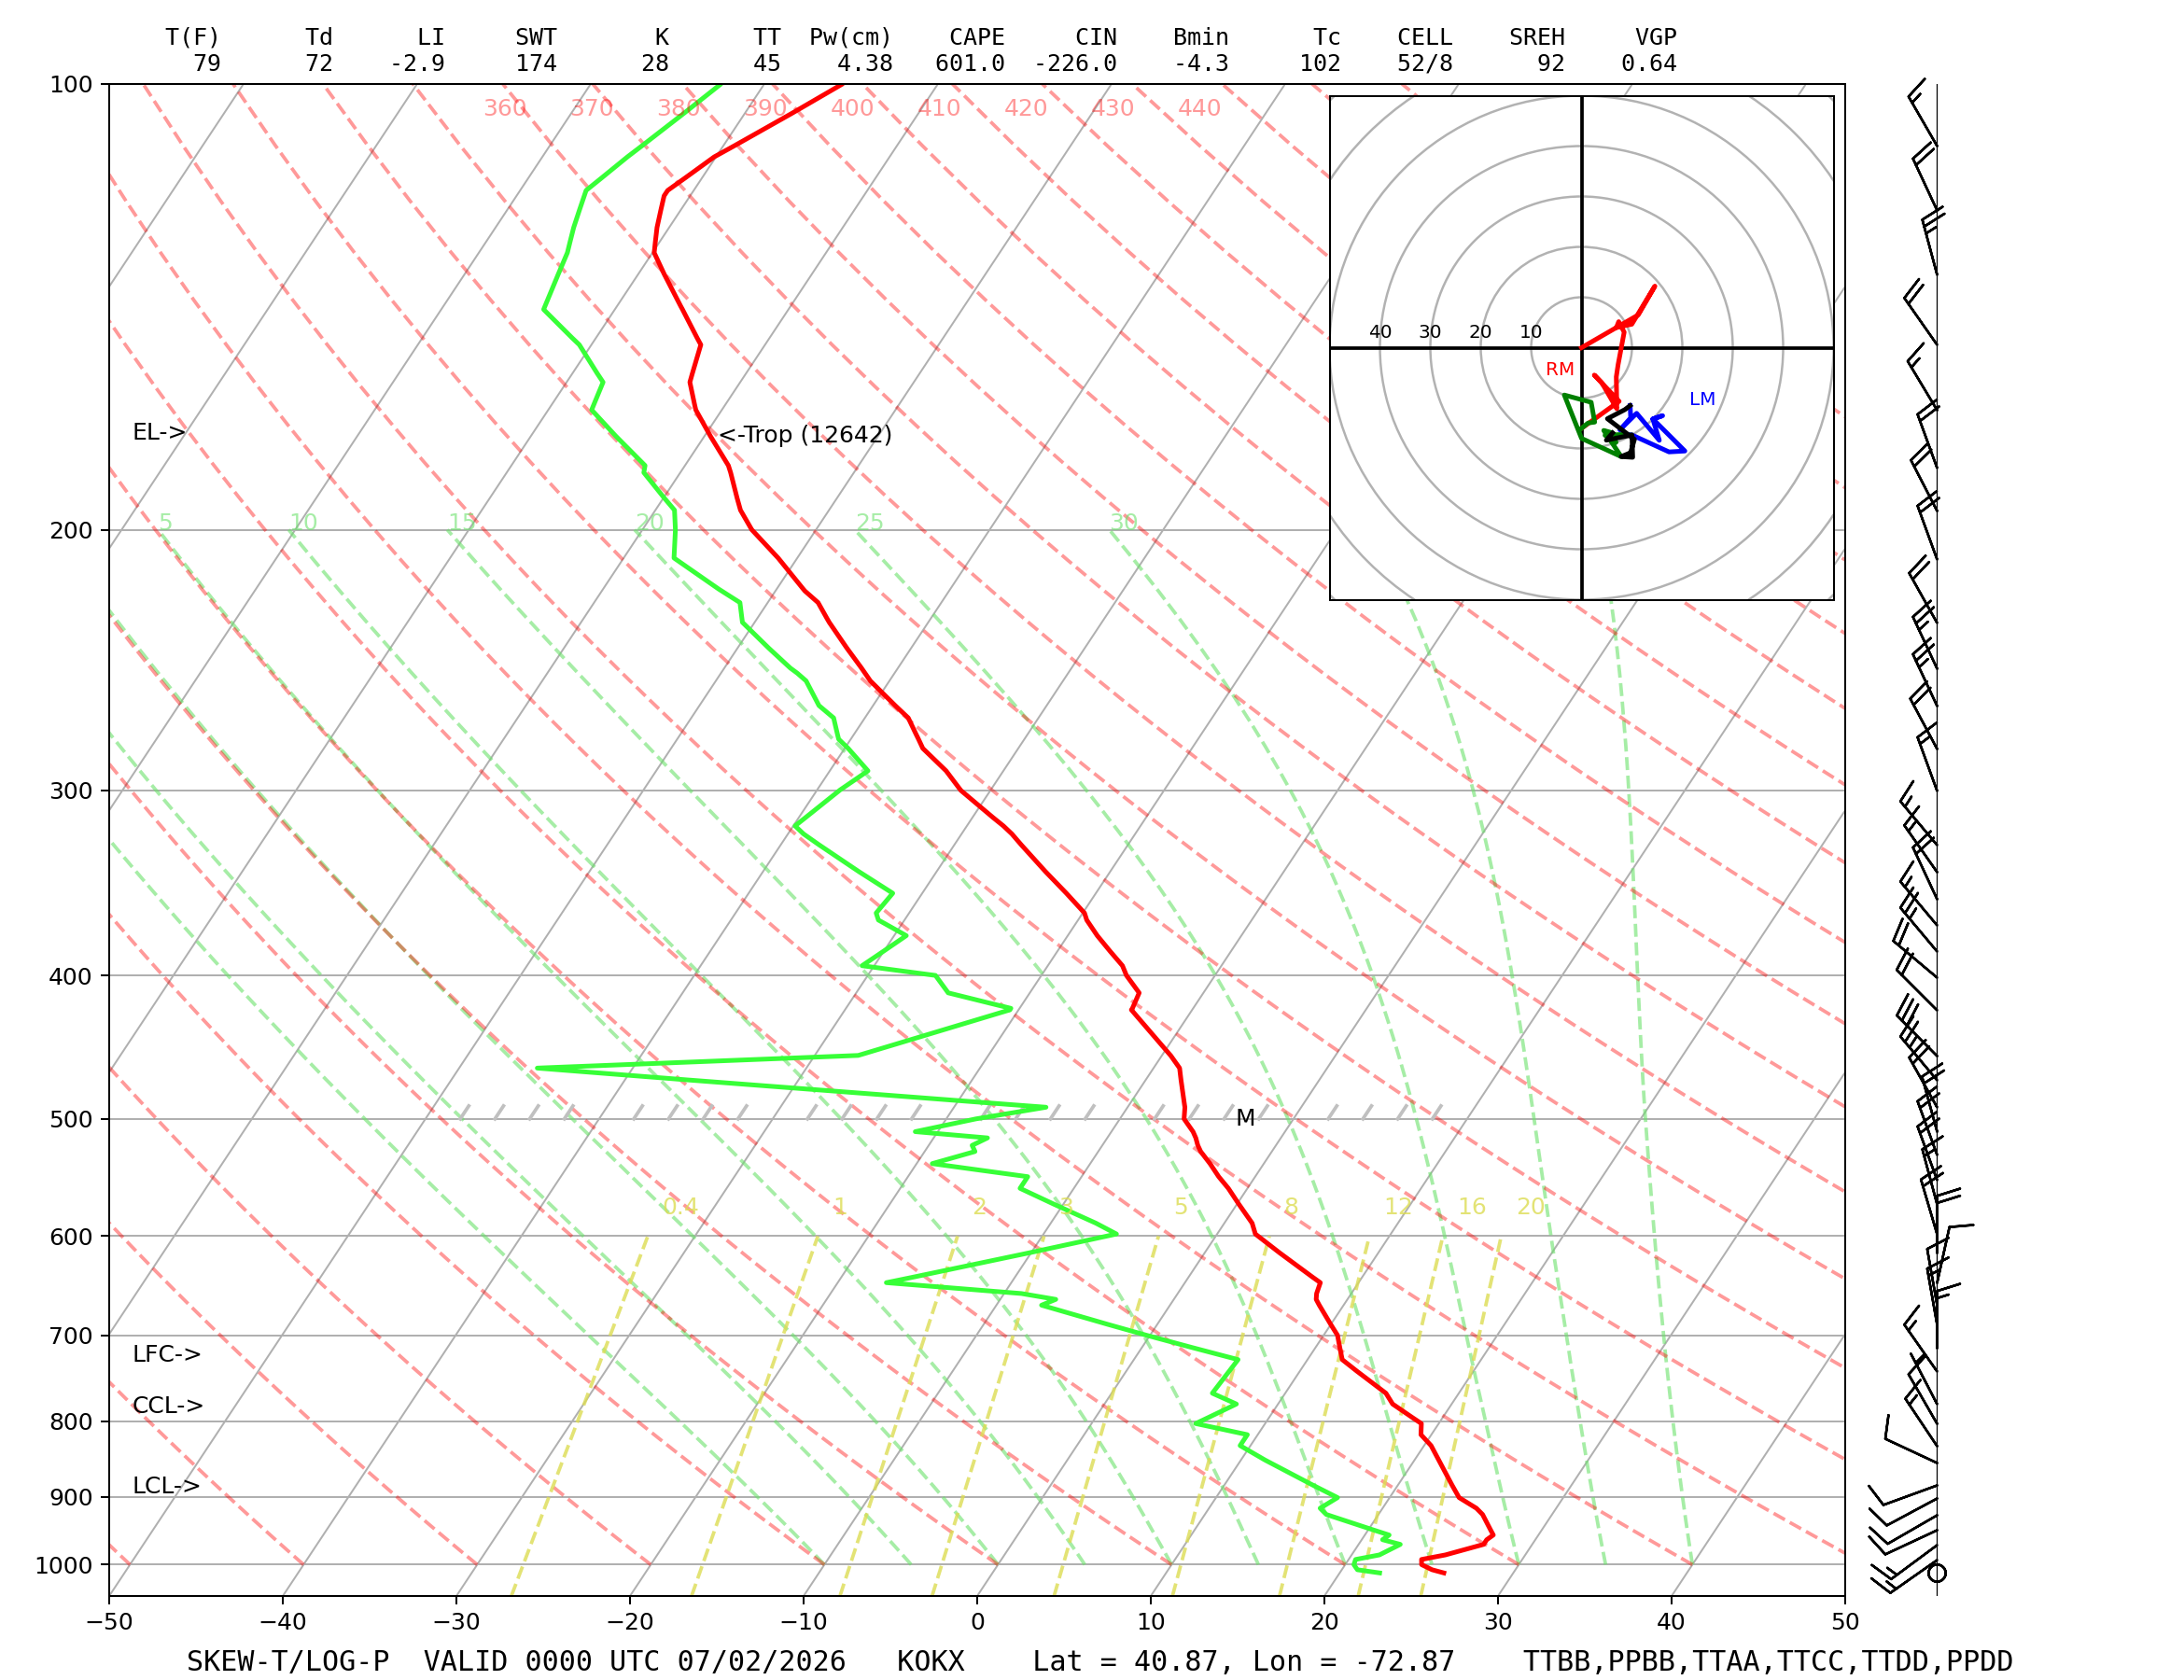