2023 Annual Climate Review:
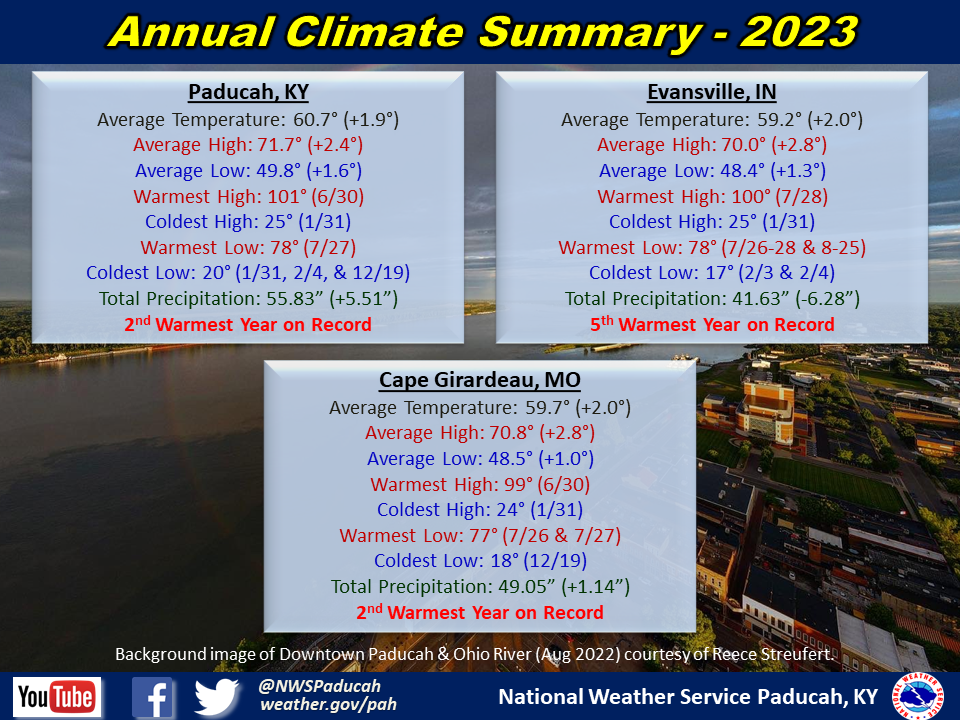
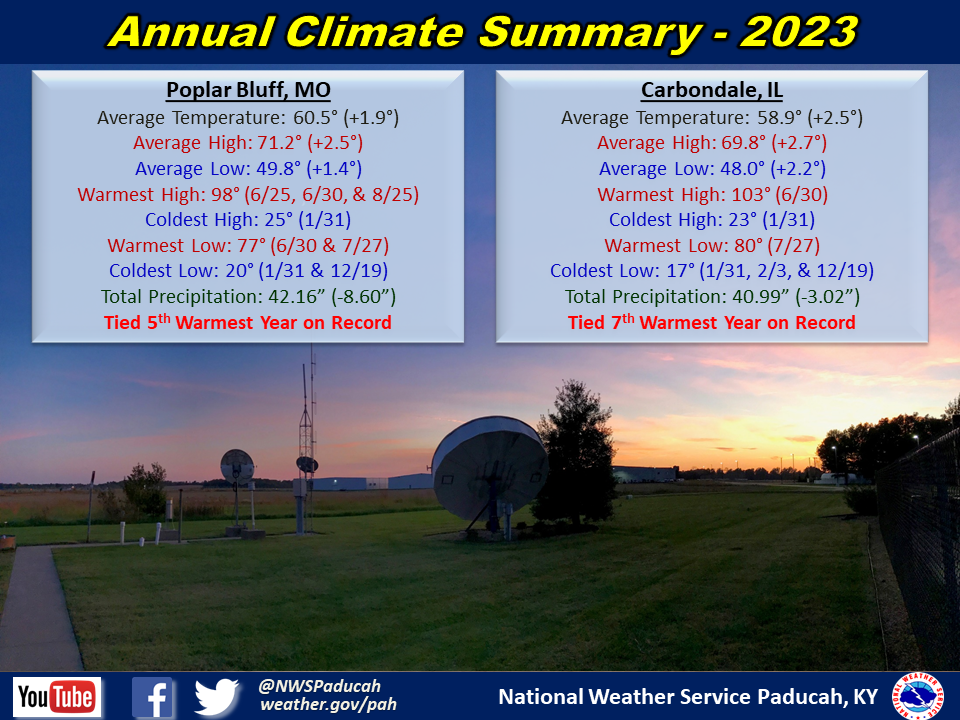
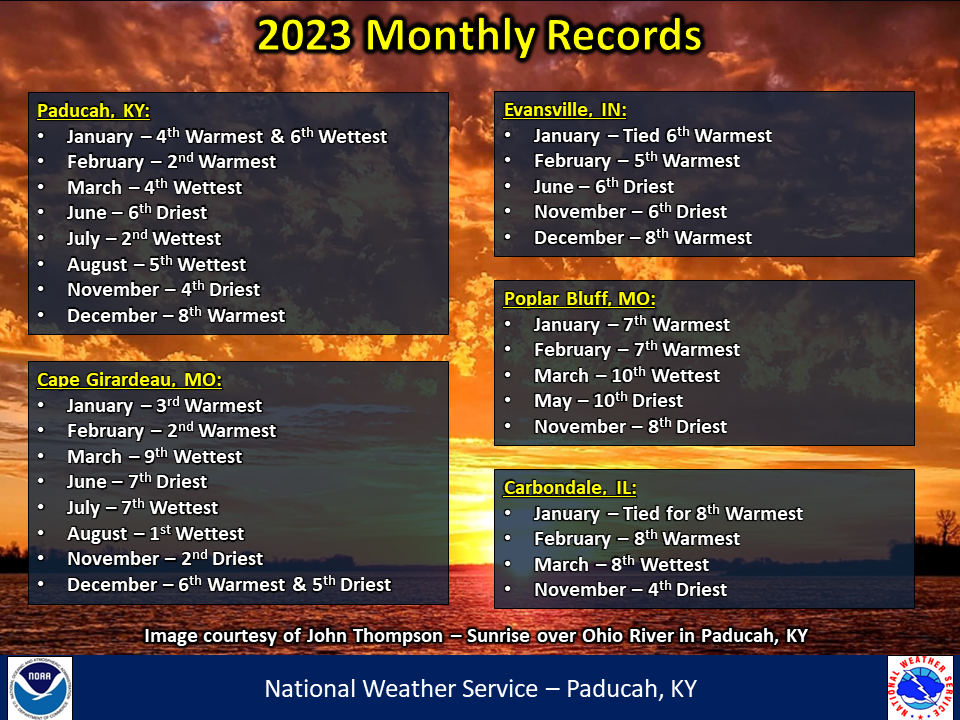
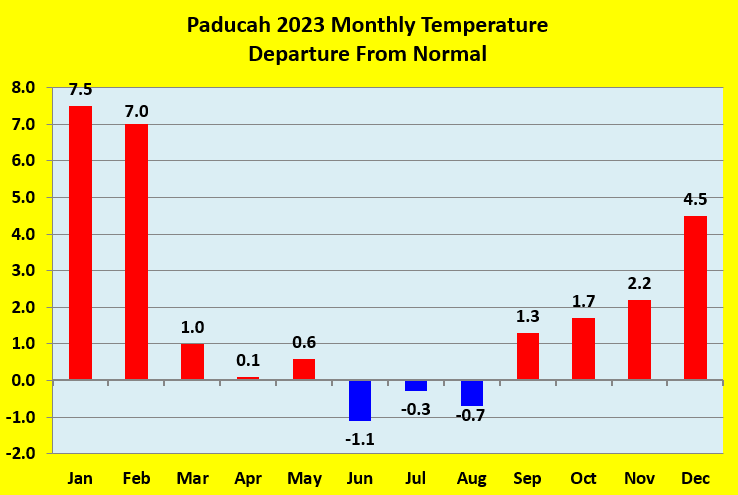
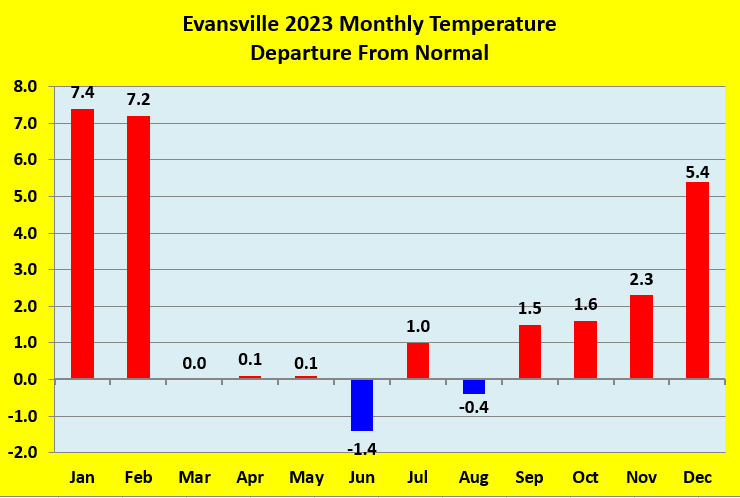
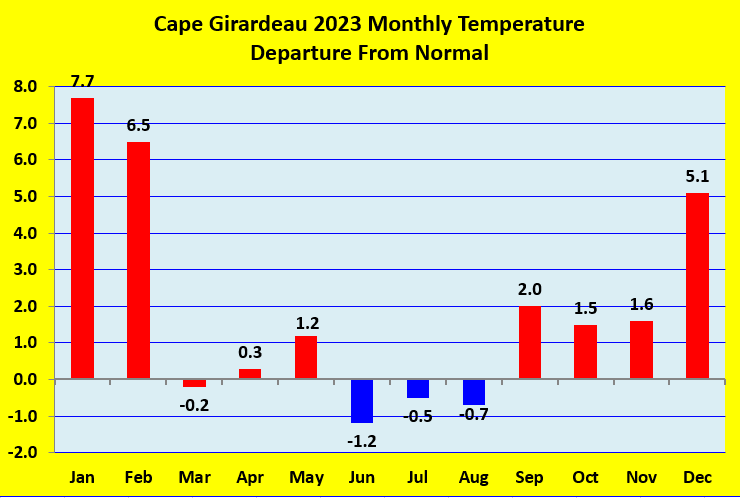
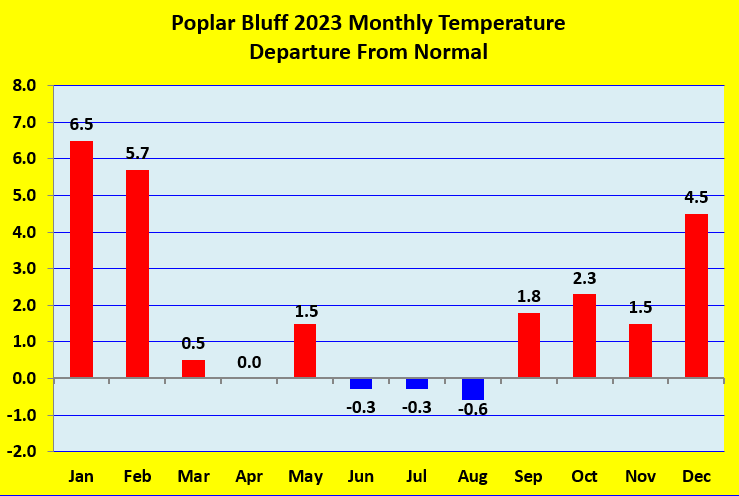
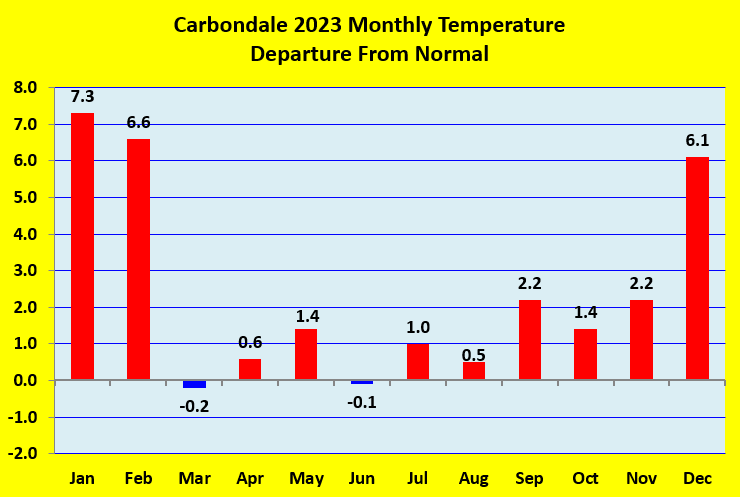
Temperatures finished above normal by a whopping 2 to 2.5 degrees. For one month this departure isn’t substantial, but for an entire year it is. All 5 of our long-term climate stations observed one of their top 7 warmest years on record, with Paducah and Cape Girardeau leading the way with their 2nd warmest. This was the first year on record where the temperature never fell below 20 degrees in Paducah. The most abnormally warm months compared to normal were all during the cooler months: January, February, and December. Cooler than normal temperatures were largely absent in 2023. 10 of the 12 months finished near or above normal, with the only 2 that registered slightly cooler than normal temperatures being June (1 degree below normal) and August (0.5 degree below normal).
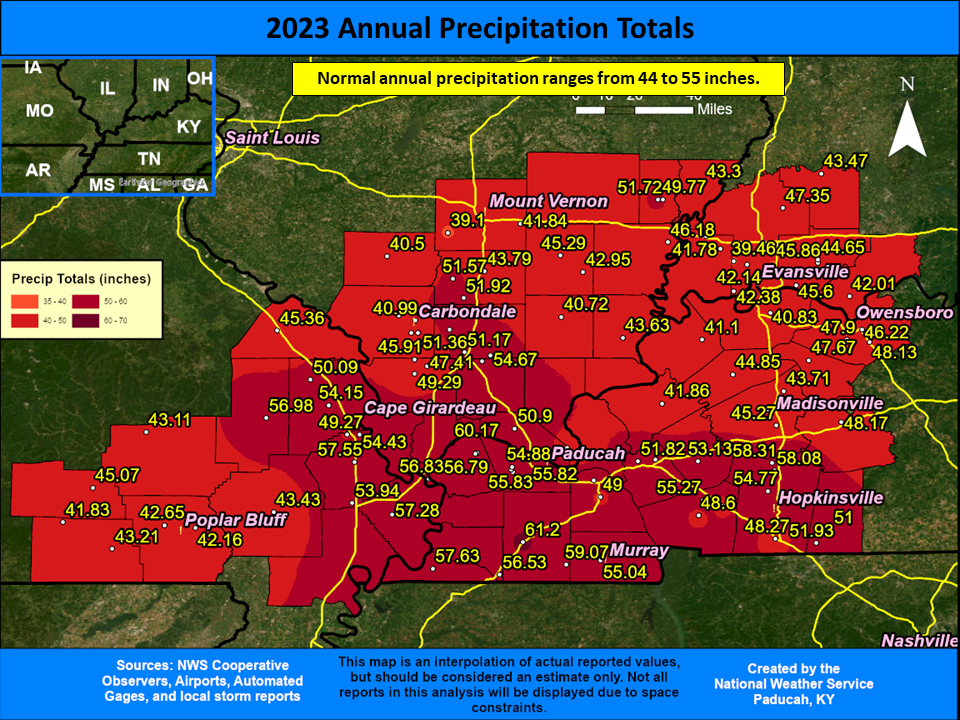
Precipitation was highly variable across the region, ranging anywhere from nearly 10 inches drier than normal to 8 inches wetter than normal. Amounts ranged from around 40 inches to just over 60 inches. Wetter than normal conditions were observed across portions of southeast Missouri (Marble Hill, Cape Girardeau, and Sikeston areas), southern portions of west Kentucky (Paducah, Mayfield, Murray, Hopkinsville areas), and far southern Illinois (West Frankfort, Marion, Vienna, Metropolis, and Cairo areas). Meanwhile, drier than normal conditions were observed across western portions of southeast Missouri (Poplar Bluff, Dexter, Van Buren areas), many areas north of Route 13 in southern Illinois (Carbondale, Mount Vernon, and Harrisburg areas), most of southwest Indiana, and parts of northwest Kentucky (Henderson and Madisonville). The highest observed amount was 61.20” at the Graves County, Kentucky mesonet station (11.28” of this falling in a 24 hour period on July 18-19 which set a new Kentucky state record). The wettest months compared to normal were March, July and August. The 6 week period from July 1 – August 15th was exceptionally wet with several locations logging their wettest such period on record. On the flip side, the driest months compared to normal were May, June, November, and December. Portions of the region were in moderate to severe drought during these times.
Snowfall was below normal across much of the region with most areas only receiving 1 to 6 inches on average. Evansville observed a measly 0.9” for the entire calendar year, which was the 2nd lowest amount on record (snowfall records go back to 1948). The only year with less snow in Evansville was 2020, when they only received a trace. The most notable snow event for the year was January 24-25 when portions of southeast Missouri and southern Illinois received amounts ranging from 3 to 8 inches. Another winter storm impacted the region a week later, with primarily a wintry mix of sleet and ice being observed on January 30-31.
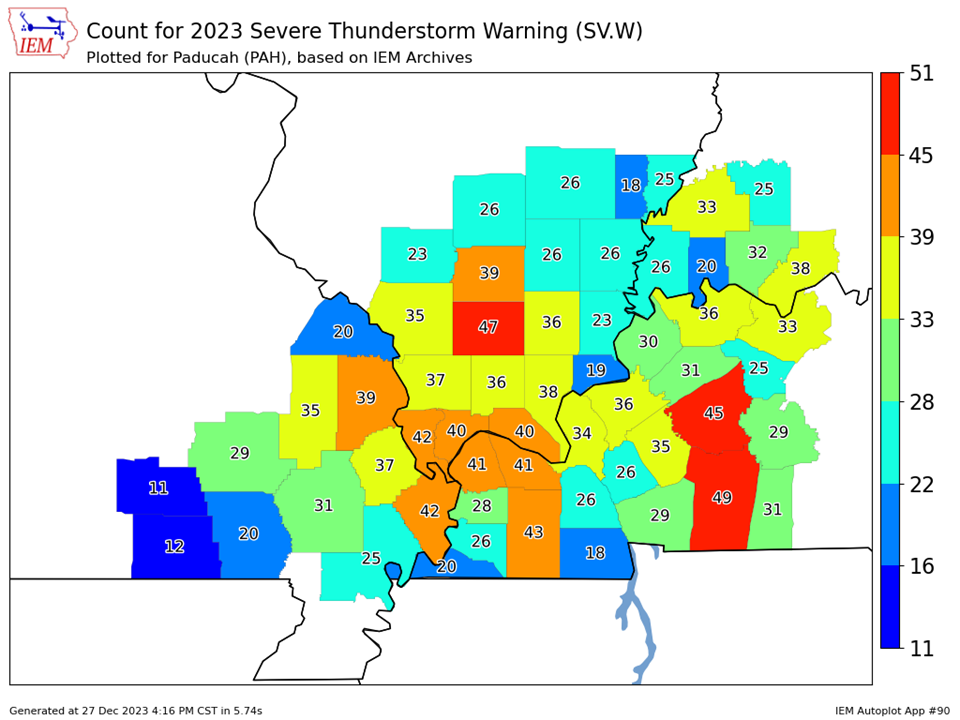
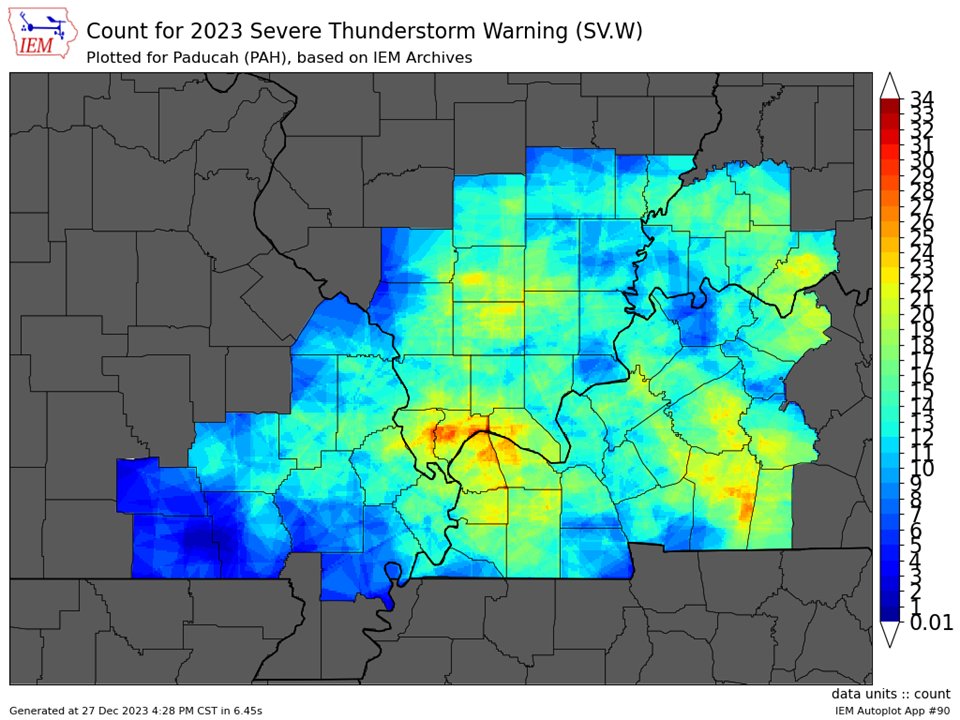
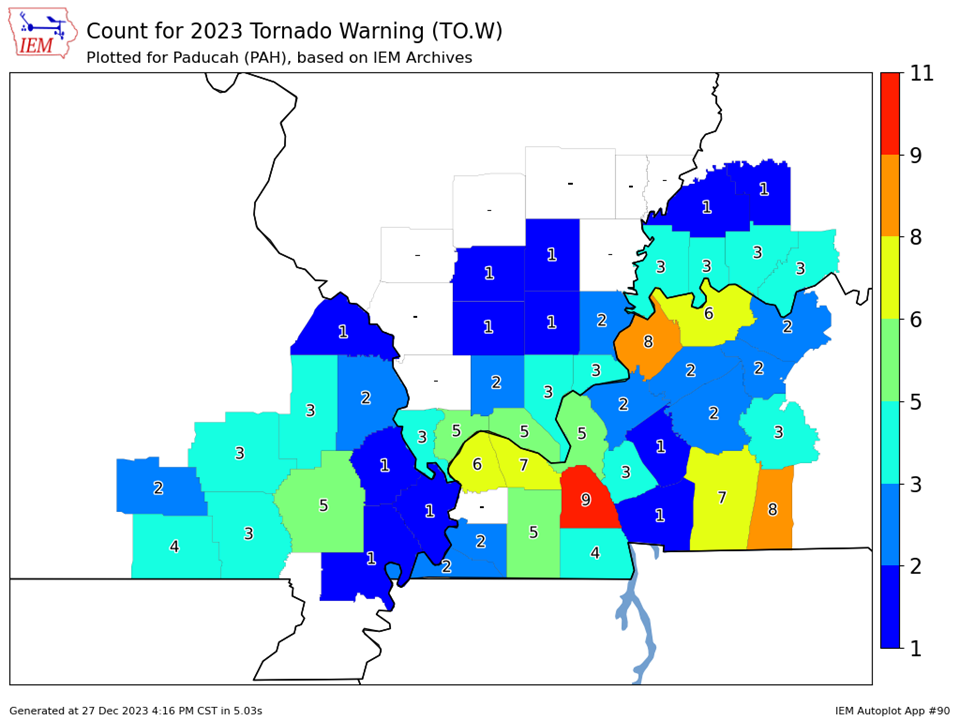
It was a very active year for severe thunderstorms and flash flooding across the region. Our office issued a total of 647 combined warnings (severe thunderstorm, tornado ,and flash flood) which was the 2nd most on record for a year (only behind the 709 warnings issued in 2006). Oddly enough the months of April and May were rather quiet regarding severe thunderstorms, when typically this is our most active time of the year. Instead, it was the period from late June through mid August and also March in which we observed much of our severe weather.
The graphic below is an interpolated rainfall map using actual observations. Please note that there are likely discrepancies in between observations, since the values are estimated based on nearest reports.
| 2023 Annual Review: Precipitation and Temperature Maps (Click on image to enlarge) |
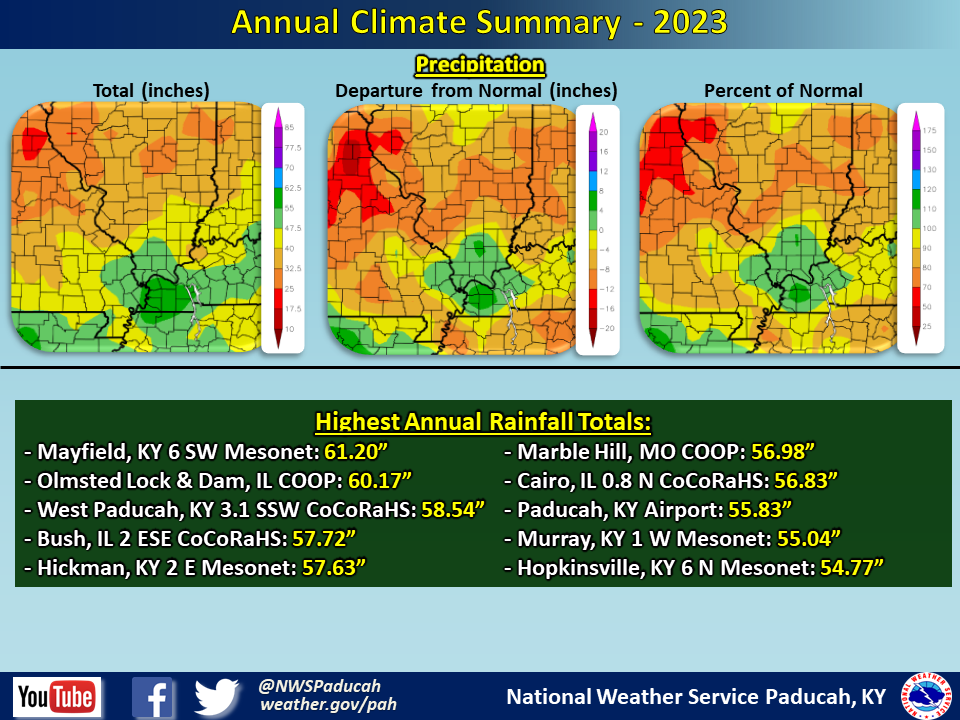 |
| Climate Maps are from the Northeast Regional Climate Center |
 |
 |
 |
 |
 |
| Severe Thunderstorm Warnings - County Based | Severe Thunderstorm Warnings - Polygon Based |
 |
 |
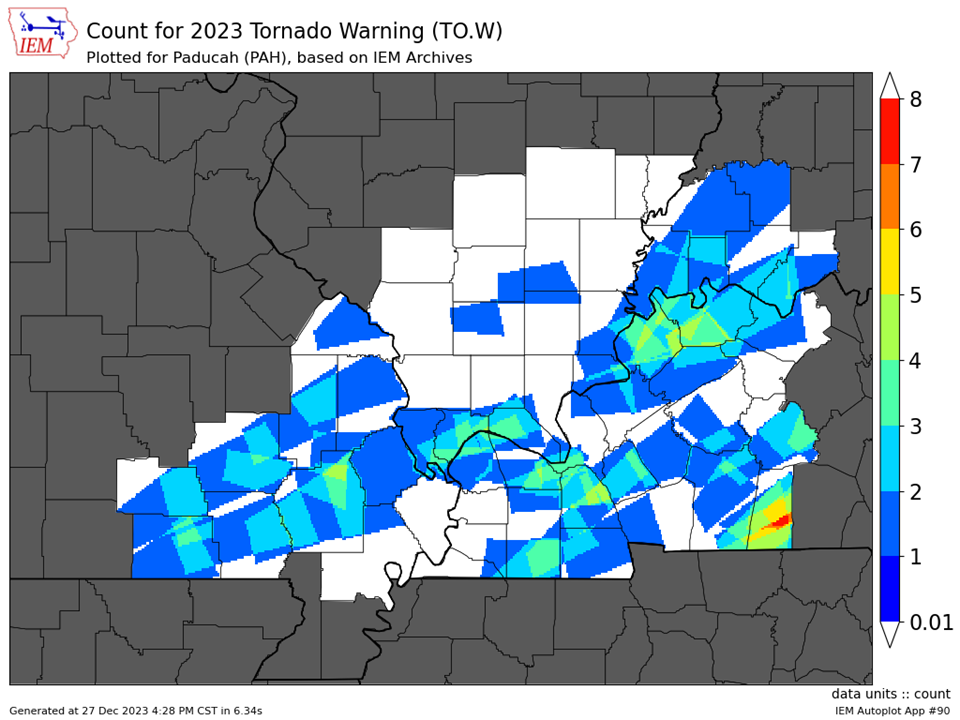
| Tornado Warnings - County Based | Tornado Warnings - Polygon Based |
 |
 |
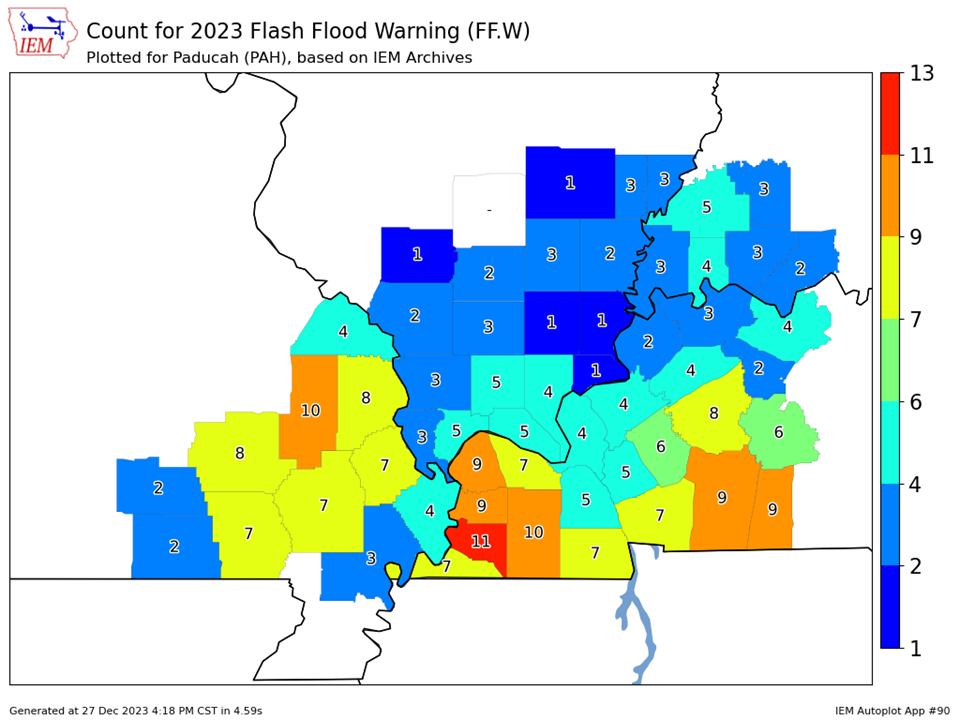
| Flash Flood Warnings - County Based | |
 |

