*Climate Data has been recorded at Barkley Regional Airport in West Paducah since 1949 and prior to that was observed in downtown Paducah back to December of 1937.
Independence Day, commonly known as the Fourth of July, is a federal holiday in the United States commemorating the adoption of the Declaration of Independence on July 4, 1776, declaring independence from Great Britain.
Here is a look at high and low temperature frequencies and extremes as well as precipitation statistics for the 4th of July in Paducah.
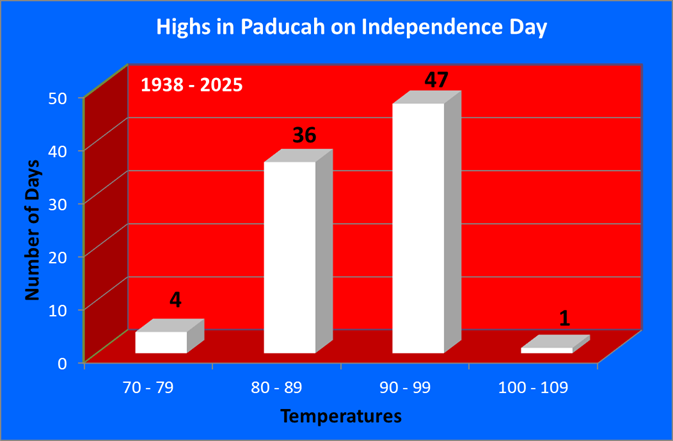
As seen by this graphic high temperatures are predominately in the 80s or 90s on the 4th of July, encompassing 94% of all years on record.
| Warmest Highs | Coldest Highs |
| 101 in 2012 | 72 in 1972 |
| 97 in 2018 | 77 in 1997 |
| 97 in 1954 | 79 in 1970 |
| 96 in 2002 | 79 in 1967 |
| 96 in 1990 | 80 in 1984 |
| 96 in 1988 | 80 in 1968 |
| 96 in 1938 | |
| Normal High: | 89 |
Paducah has only hit the century mark on one occasion, back in 2012 when the temperature soared to 101 degrees! There have been 4 years where the high temperature failed to reach 80 degrees. This hasn't happened since 1997 when the high was only 77 degrees.
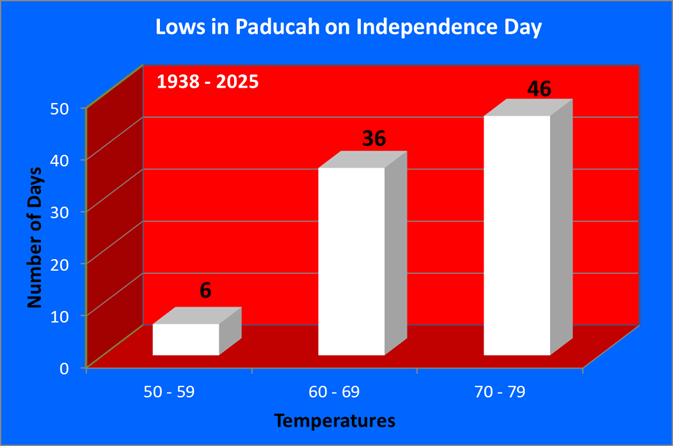
Low temperatures usually fall in the 60s or 70s, which accounts for 92% of the years on record. There have been 6 years where the low dipped into the 50s, most recently in 2014.
| Warmest Lows | Coldest Lows |
| 76 in 2024 | 52 in 1968 |
| 76 in 1999 | 56 in 1996 |
| 75 in 2018 | 58 in 2014 |
| 75 in 1993 | 58 in 1967 |
| 74 in 2012 | 58 in 1959 |
| 74 in 2010* | 58 in 1947 |
| Normal Low: | 69 |
*Denotes a tie in previous year(s)
Measurable precipitation has fallen 32% of the time, with over an inch of precipitation falling on 5 different occasions, most recently in 2016.
| Wettest |
| 3.44 in 1984 |
| 2.19 in 2016 |
| 1.91 in 1941 |
| 1.55 in 2009 |
| 1.34 in 1950 |
Here is a look at the observed weather for the past 15 years:
| Recent Weather for 4th of July | |||
| Year | High | Low | Precip |
| 2011 | 84 | 70 | 0.43 |
| 2012 | 101 | 74 | 0.25 |
| 2013 | 84 | 61 | 0 |
| 2014 | 83 | 58 | 0 |
| 2015 | 82 | 69 | 0 |
| 2016 | 84 | 72 | 2.19 |
| 2017 | 90 | 72 | 0.05 |
| 2018 | 97 | 75 | 0 |
| 2019 | 93 | 72 | 0.01 |
| 2020 | 93 | 69 | 0 |
| 2021 | 87 | 60 | 0 |
| 2022 | 95 | 73 | 0 |
| 2023 | 90 | 70 | 0 |
| 2024 | 92 | 76 | 0.34 |
| 2025 | 91 | 68 | 0 |
*Climate Data has been recorded at Evansville Regional Airport since January of 1897.
Independence Day, commonly known as the Fourth of July, is a federal holiday in the United States commemorating the adoption of the Declaration of Independence on July 4, 1776, declaring independence from Great Britain.
Here is a look at high and low temperature frequencies and extremes as well as precipitation statistics for the 4th of July in Evansville.
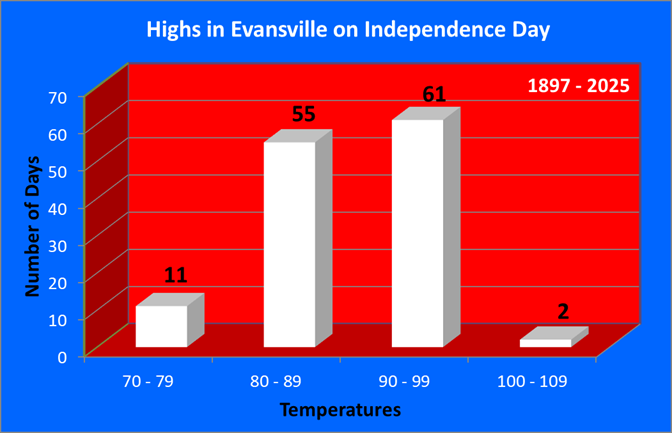
As seen by this graphic high temperatures are predominately in the 80s or 90s on the 4th of July, encompassing 89% of all years on record.
| Warmest Highs | Coldest Highs |
| 103 in 2012 | 72 in 2009 |
| 101 in 1921 | 72 in 1972 |
| 99 in 1911 | 76 in 1997 |
| 97 in 1897 | 76 in 1967 |
| 96 in 2022* | 77 in 1941* |
| Normal High: | 89 |
*Denotes a tie in previous year(s)
Evansville has only hit the century mark twice on this holiday, with the hottest being back in 2012 with a scorching 103 degrees! There have been 11 years where the high temperature failed to reach 80 degrees. This last occurred back in 2016 when the high only hit 78 degrees.
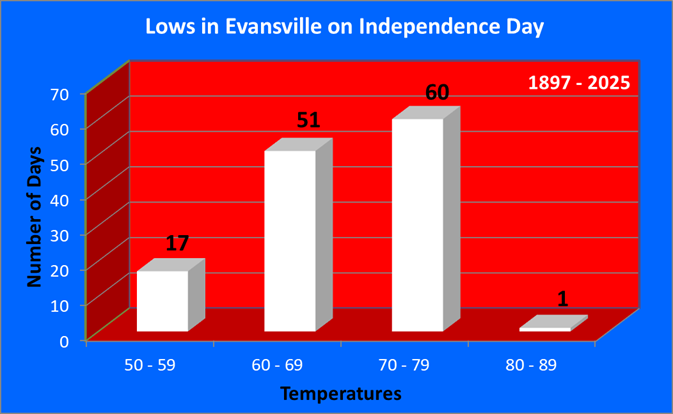
Low temperatures usually fall in the 60s or 70s, which accounts for 85% of the years on record. There have been 17 years where the low dipped into the 50s, most recently in 2014.
| Warmest Lows | Coldest Lows |
| 80 in 1911 | 50 in 1968 |
| 78 in 1926 | 51 in 1996 |
| 76 in 1934 | 52 in 1967 |
| 76 in 1928 | 55 in 1930 |
| 76 in 1897 | 55 in 1927 |
| Normal Low: | 68 |
Measurable precipitation has fallen 32% of the time, with over an inch of precipitation falling on 4 different occasions, most recently in 2016.
| Wettest |
| 2.28 in 2016 |
| 1.65 in 1912 |
| 1.20 in 1910 |
| 1.01 in 1984 |
| 0.80 in 1972 |
Here is a look at the observed weather for the past 15 years:
| Recent Weather for 4th of July | |||
| Year | High | Low | Precip |
| 2011 | 84 | 69 | 0.28 |
| 2012 | 103 | 73 | 0.41 |
| 2013 | 80 | 63 | 0 |
| 2014 | 81 | 58 | 0 |
| 2015 | 83 | 66 | 0 |
| 2016 | 78 | 71 | 2.28 |
| 2017 | 89 | 69 | T |
| 2018 | 95 | 74 | 0 |
| 2019 | 84 | 69 | 0.05 |
| 2020 | 94 | 71 | 0 |
| 2021 | 87 | 61 | 0 |
| 2022 | 96 | 70 | 0 |
| 2023 | 90 | 70 | 0 |
| 2024 | 92 | 75 | 0.2 |
| 2025 | 94 | 71 | 0 |
*Climate Data has been recorded at Cape Girardeau Regional Airport, located 5 miles southwest of Cape Girardeau, since June of 1960.
Independence Day, commonly known as the Fourth of July, is a federal holiday in the United States commemorating the adoption of the Declaration of Independence on July 4, 1776, declaring independence from Great Britain.
Here is a look at high and low temperature frequencies and extremes as well as precipitation statistics for the 4th of July in Cape Girardeau.
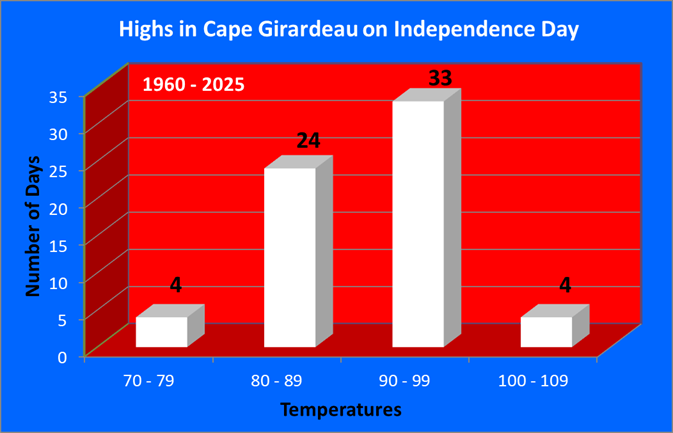
As seen by this graphic high temperatures are predominately in the 80s or 90s on the 4th of July, encompassing 86% of all years on record.
| Warmest Highs | Coldest Highs |
| 103 in 2012 | 73 in 1972 |
| 102 in 1969 | 77 in 1960 |
| 100 in 1990 | 78 in 2008 |
| 100 in 1962 | 78 in 1997 |
| 98 in 1982 | 80 in 1968 |
| 96 in 2024* | 80 in 1967 |
| Normal High: | 89 |
*Denotes a tie in previous year(s)
Cape Girardeau has hit the century mark 4 times on this holiday, most recently in 2012 when the temperature soared to 103 degrees! There have been 4 years where the high temperature failed to reach 80 degrees. This last occurred in 2008 with a reading of 78 degrees.
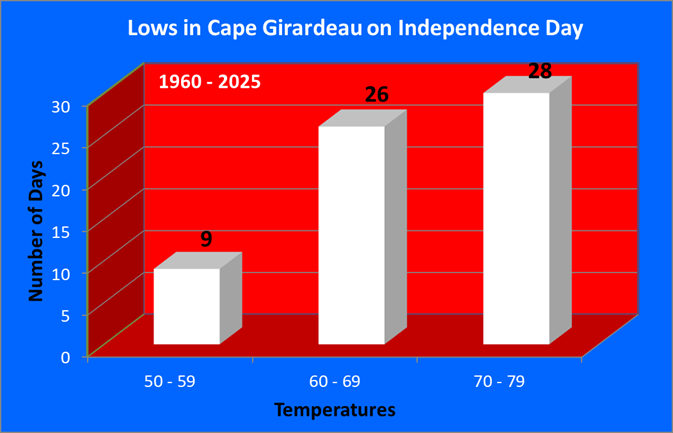
Low temperatures usually fall in the 60s or 70s, which accounts for 86% of the years on record. There have been 9 years where the low dipped into the 50s, most recently in 2021.
| Warmest Lows | Coldest Lows |
| 76 in 1990 | 53 in 1968 |
| 75 in 2018 | 57 in 2013 |
| 75 in 2010 | 58 in 2014 |
| 75 in 1999 | 58 in 1967 |
| 75 in 1994* | 59 in 2021* |
| Normal Low: | 68 |
*Denotes a tie in previous year(s)
Measurable precipitation has fallen 33% of the time, with the wettest July 4th occurring in 2016 when 1.19 inches fell.
| Wettest |
| 1.19 in 2016 |
| 0.86 in 2006 |
| 0.67 in 1984 |
| 0.57 in 1981 |
| 0.55 in 2005 |
| 0.55 in 1979 |
Here is a look at the observed weather for the past 15 years:
| Recent Weather for 4th of July | |||
| Year | High | Low | Precip |
| 2011 | 85 | 70 | 0.30 |
| 2012 | 103 | 72 | 0 |
| 2013 | 85 | 57 | 0 |
| 2014 | 81 | 58 | 0 |
| 2015 | M | M | M |
| 2016 | 83 | 71 | 1.19 |
| 2017 | 88 | 65 | T |
| 2018 | 95 | 75 | 0 |
| 2019 | 92 | 71 | 0 |
| 2020 | 91 | 68 | 0 |
| 2021 | 86 | 59 | 0 |
| 2022 | 94 | 72 | 0 |
| 2023 | 91 | 72 | 0 |
| 2024 | 96 | 73 | 0 |
| 2025 | 90 | 67 | 0 |
Climate Data has been recorded at the Poplar Bluff Airport, located 4 miles east of Poplar Bluff, since December of 1997. Prior to that data was taken at the Poplar Bluff COOP station, located a half mile west of downtown. Data for the COOP station dates back to January 1893.
Independence Day, commonly known as the Fourth of July, is a federal holiday in the United States commemorating the adoption of the Declaration of Independence on July 4, 1776, declaring independence from Great Britain.
Here is a look at high and low temperature frequencies and extremes as well as precipitation statistics for the 4th of July in Poplar Bluff.
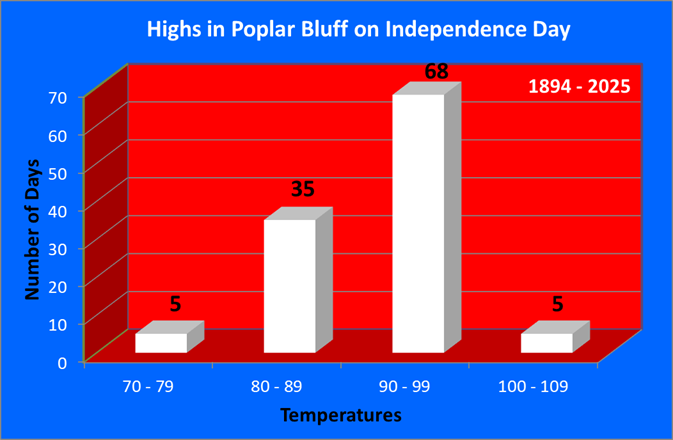
As seen by this graphic high temperatures are predominately in the 80s or 90s on the 4th of July, encompassing 92% of all years on record.
| Warmest Highs | Coldest Highs |
| 102 in 1926 | 74 in 1995 |
| 102 in 1925 | 76 in 1976 |
| 101 in 1901 | 76 in 1924 |
| 100 in 2012 | 77 in 1895 |
| 100 in 1954 | 79 in 1968 |
| Normal High: | 89 |
Poplar Bluff has hit the century mark 5 times on this holiday, most recently in 2012 when the temperature soared to 100 degrees! There have been 5 years where the high temperature failed to reach 80 degrees. This last occurred in 1995 with a reading of 74 degrees.
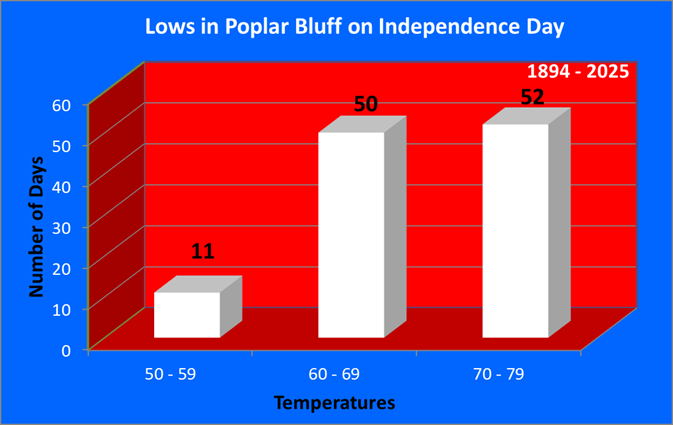
Low temperatures usually fall in the 60s or 70s, which accounts for 90% of the years on record. There have been 10 years where the low dipped into the 50s, most recently in 2021.
| Warmest Lows | Coldest Lows |
| 78 in 1973 | 52 in 1968 |
| 77 in 1983 | 54 in 1924 |
| 75 in 2018 | 54 in 1922 |
| 75 in 1998 | 54 in 1917 |
| 74 in 2024* | 56 in 1940* |
| Normal Low: | 70 |
*Denotes a tie in previous year(s)
Measurable precipitation has fallen 27% of the time, with the wettest July 4th occurring in 1937 when a whopping 5.52 inches fell!
| Wettest |
| 5.52 in 1937 |
| 2.00 in 1941 |
| 1.70 in 2016 |
| 1.58 in 1976 |
| 1.34 in 1972 |
Here is a look at the observed weather for the past 15 years:
| Recent Weather for 4th of July | |||
| Year | High | Low | Precip |
| 2011 | 85 | 70 | 0.48 |
| 2012 | 100 | 73 | 0 |
| 2013 | 88 | 61 | 0.02 |
| 2014 | 82 | 60 | 0 |
| 2015 | 81 | 68 | 0 |
| 2016 | 82 | 72 | 1.70 |
| 2017 | 84 | 67 | T |
| 2018 | 95 | 75 | 0 |
| 2019 | 91 | 72 | 0 |
| 2020 | 91 | 73 | 0 |
| 2021 | 85 | 58 | 0 |
| 2022 | 96 | 73 | 0 |
| 2023 | 90 | 71 | 0 |
| 2024 | 94 | 74 | T |
| 2025 | 91 | 69 | 0 |
Climate Data has been recorded at Southern Illinois Airport, located 4 miles northwest of Carbondale, since August of 1998. Prior to that data was taken at the Carbondale Sewage Plant COOP station, located 3 miles east of Carbondale. Data for the COOP station dates back to November 1898.
Independence Day, commonly known as the Fourth of July, is a federal holiday in the United States commemorating the adoption of the Declaration of Independence on July 4, 1776, declaring independence from Great Britain.
Here is a look at high and low temperature frequencies and extremes as well as precipitation statistics for the 4th of July in Carbondale.
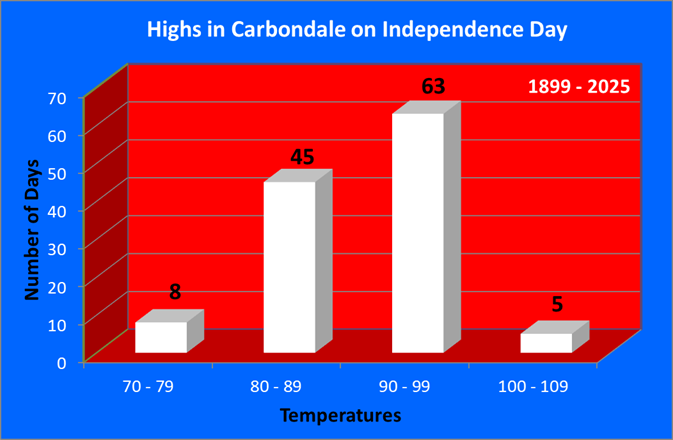
As seen by this graphic high temperatures are predominately in the 80s or 90s on the 4th of July, encompassing 89% of all years on record.
| Warmest Highs | Coldest Highs |
| 104 in 2012 | 71 in 1989 |
| 104 in 1911 | 73 in 1995 |
| 101 in 1926 | 74 in 1976 |
| 100 in 1921 | 77 in 2009 |
| 100 in 1901 | 77 in 2008 |
| Normal High: | 88 |
Carbondale has hit the century mark 5 times on this holiday, most recently in 2012 when the temperature soared to 104 degrees! There have been 8 years where the high temperature failed to reach 80 degrees. This last occurred in 2009 with a reading of 77 degrees.
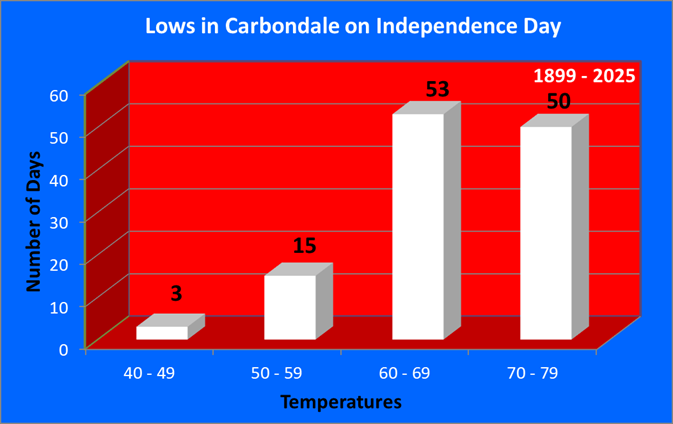
Low temperatures usually fall in the 60s or 70s, which accounts for 84% of the years on record. There have been 3 years where the low dipped into the 40s, most recently in 1940.
| Warmest Lows | Coldest Lows |
| 75 in 2018 | 48 in 1922 |
| 75 in 2010 | 49 in 1940 |
| 75 in 1928 | 49 in 1924 |
| 74 in 1935 | 50 in 1968 |
| 74 in 1926* | 51 in 1927 |
| Normal Low: | 67 |
*Denotes a tie in previous year(s)
Measurable precipitation has fallen 32% of the time, with over 1 inch of precipitation occurring on 7 different occasions, most recently in 2016.
| Wettest |
| 1.63 in 2006 |
| 1.42 in 1910 |
| 1.18 in 1980 |
| 1.13 in 2016 |
| 1.09 in 1970 |
Here is a look at the observed weather for the past 15 years:
| Recent Weather for 4th of July | |||
| Year | High | Low | Precip |
| 2011 | 86 | 70 | 0.02 |
| 2012 | 104 | 73 | 0 |
| 2013 | 84 | 57 | 0 |
| 2014 | 82 | 57 | 0 |
| 2015 | 83 | 67 | 0 |
| 2016 | 81 | 70 | 1.13 |
| 2017 | 87 | 66 | 0 |
| 2018 | 94 | 75 | 0 |
| 2019 | 92 | 70 | 0 |
| 2020 | 92 | 70 | 0 |
| 2021 | 86 | 58 | 0 |
| 2022 | 94 | 71 | 0 |
| 2023 | 90 | 72 | T |
| 2024 | 94 | 73 | 0.04 |
| 2025 | 90 | 70 | 0 |

