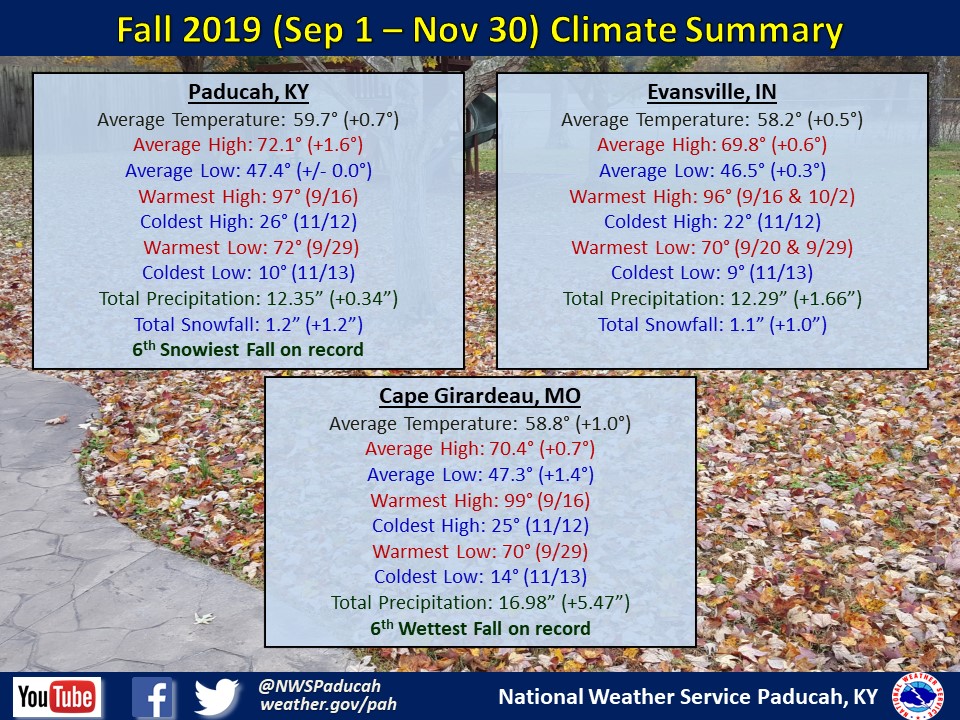
Fall Seasonal Summary (September 1 through November 30): Temperatures averaged out near normal for the Fall season, but they were no where near normal the majority of the time! The short version is we went straight from summer to winter, with very little in between. But for those that want the longer version, here you go: September into the first week of October were exceptionally warm, feeling much more like the middle of summer than Fall. September ranked as the warmest on record in Cape Girardeau, 2nd warmest in Paducah, and 5th warmest in Evansville. This was followed by the warmest October temperatures on record at all 3 locations on October 2nd. The pattern changed rather quickly though, with near record lows being observed down into the 20s on Halloween. Paducah and Evansville observed their coldest start to November on record through November 18th. Temperatures moderated during the last 2 weeks of the month though. November finished as the 4th coldest in Cape Girardeau, 6th coldest in Evansville, and 9th coldest in Paducah.
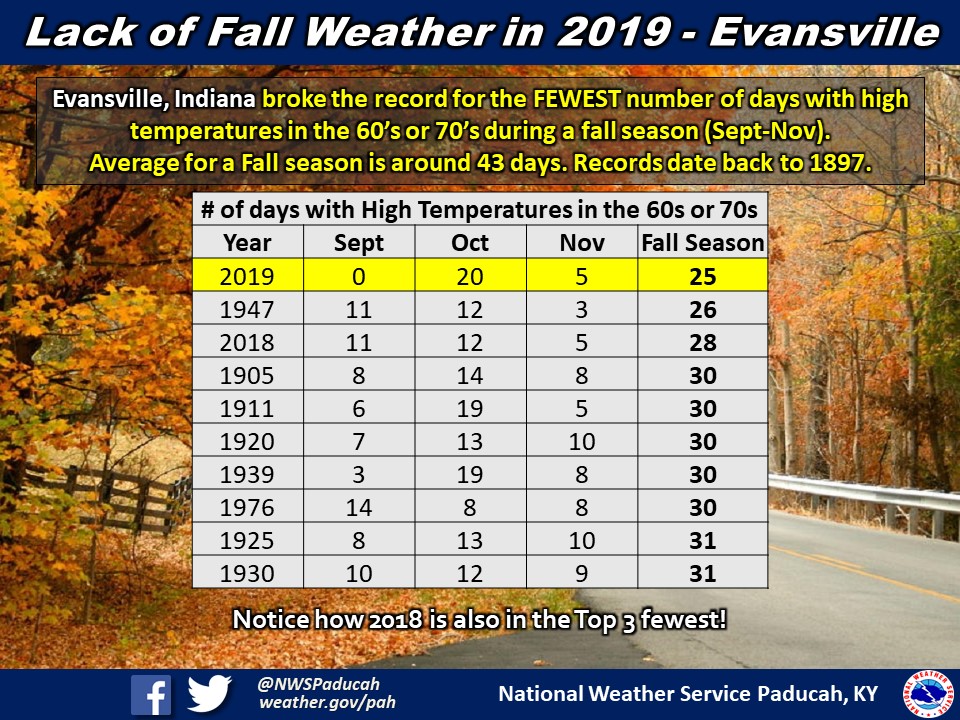
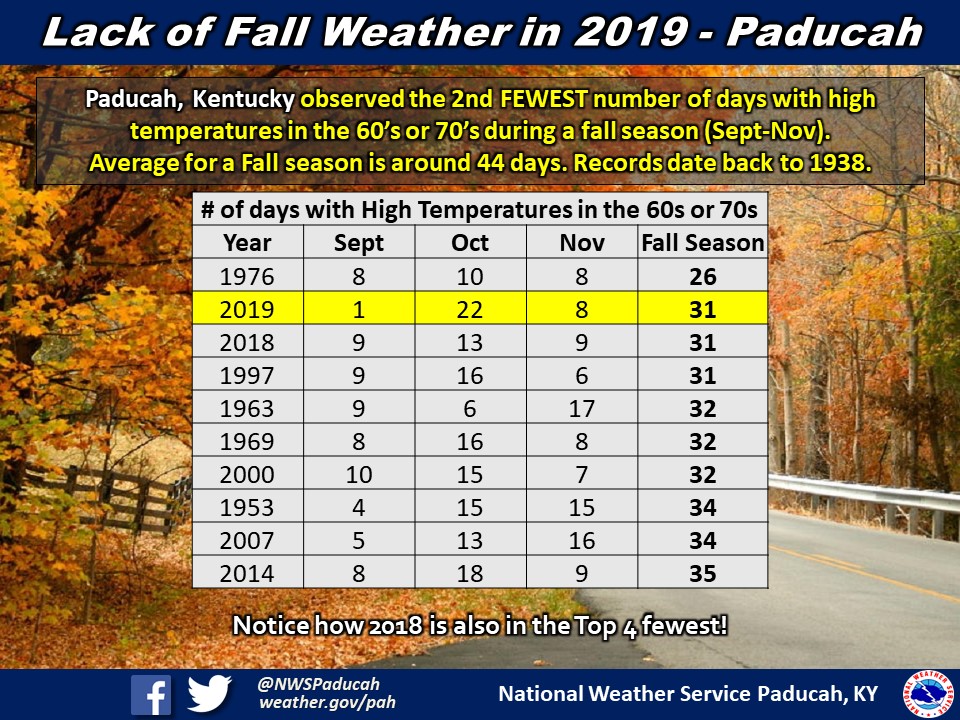
For the Fall season, Evansville only observed 25 days with high temperatures in the 60s or 70s. This broke the record for the fewest number of so called “comfortable days” for a Fall season, with the previous record being 26 days set in Fall of 1947. In Paducah, we observed 31 days with high temperatures in the 60s or 70s, tying for the 2nd fewest with 2018 and 1997. The record is 26 days set in Fall of 1976.
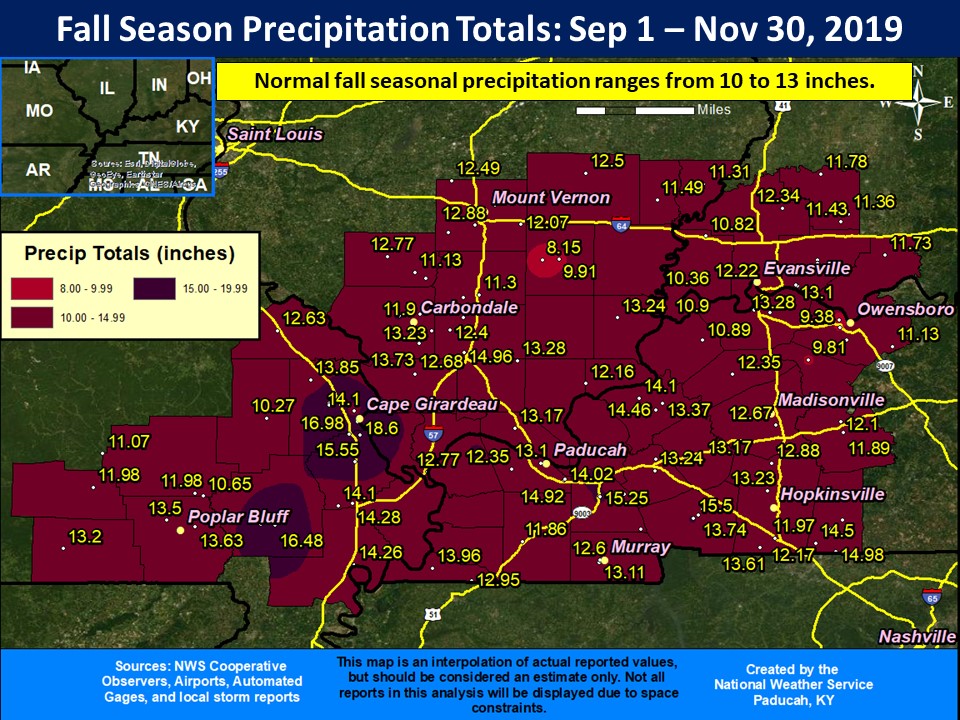
Precipitation was above normal across the majority of the Quad state region, with 12 to 15 inches common across a large swath of the area. The highest total observed in our forecast area was 18.6” at a CoCoRaHS station in Scott City, MO. The exception to the wet conditions was across portions of the Missouri Ozark Foothills, southeast Illinois, southwest Indiana, and northwest Kentucky. These areas received near to slightly below normal precipitation amounts for the Fall season. Several locations observed their driest September on record, including Evansville. Paducah went 29 days without any measurable rain, marking the longest dry stretch since 1999. But the year of plenty returned in October and November, making it a short-lived drought.
The graphic below is an interpolated rainfall map using actual observations. Please note that there are likely discrepancies in between observations, since the values are estimated based on nearest reports.
| Fall Season 2019 Review: Precipitation and Temperature Maps (Click on image to enlarge) |
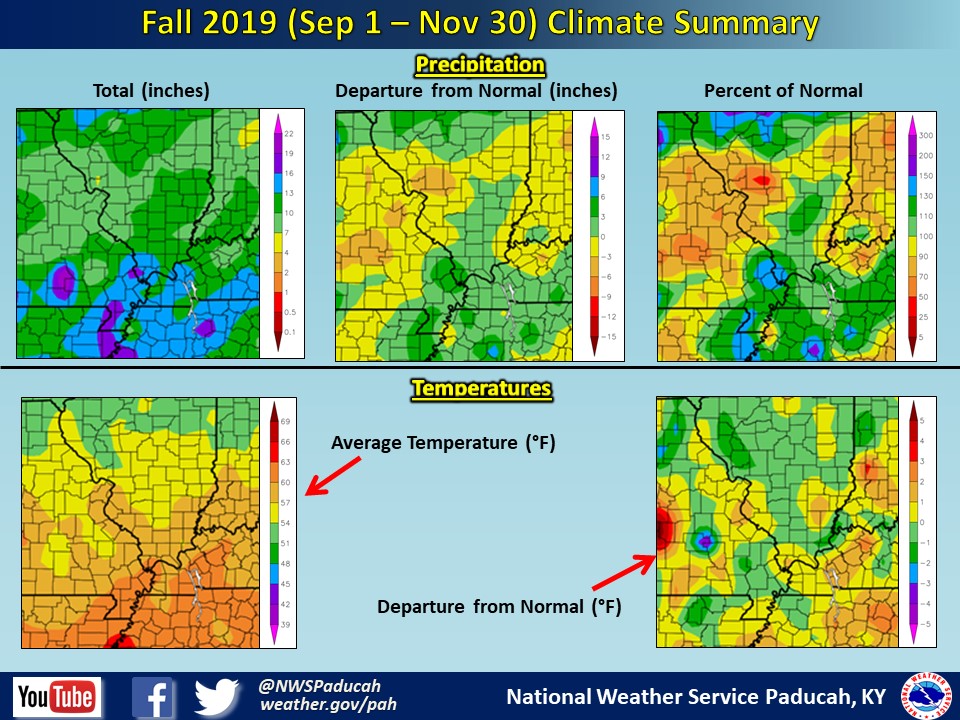 |
| Climate Maps are from the Northeast Regional Climate Center |