June 2023 Climate Review:
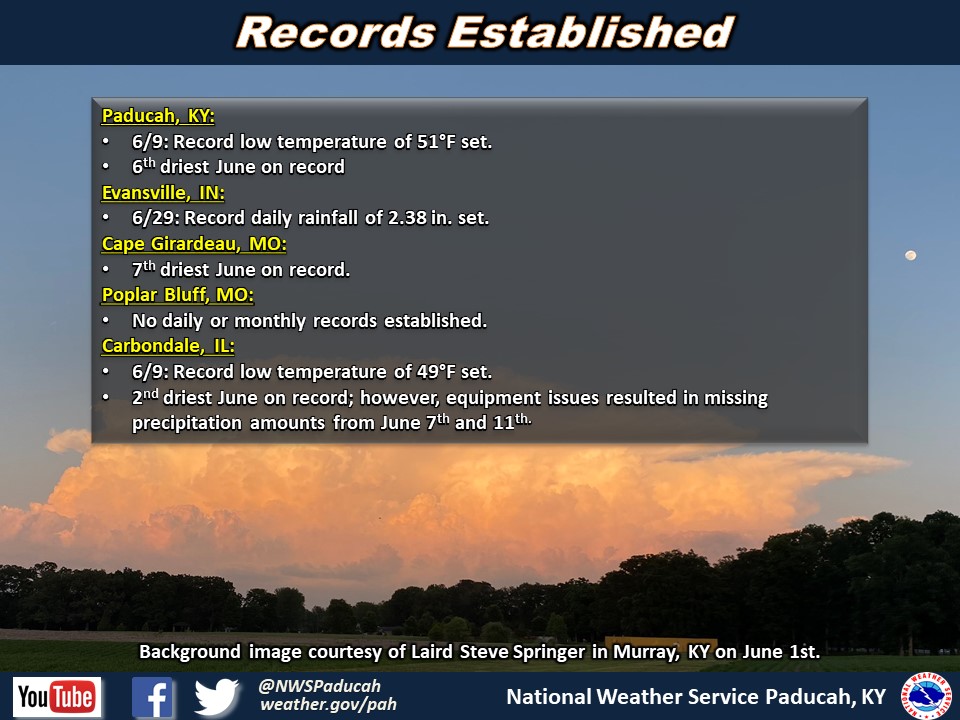
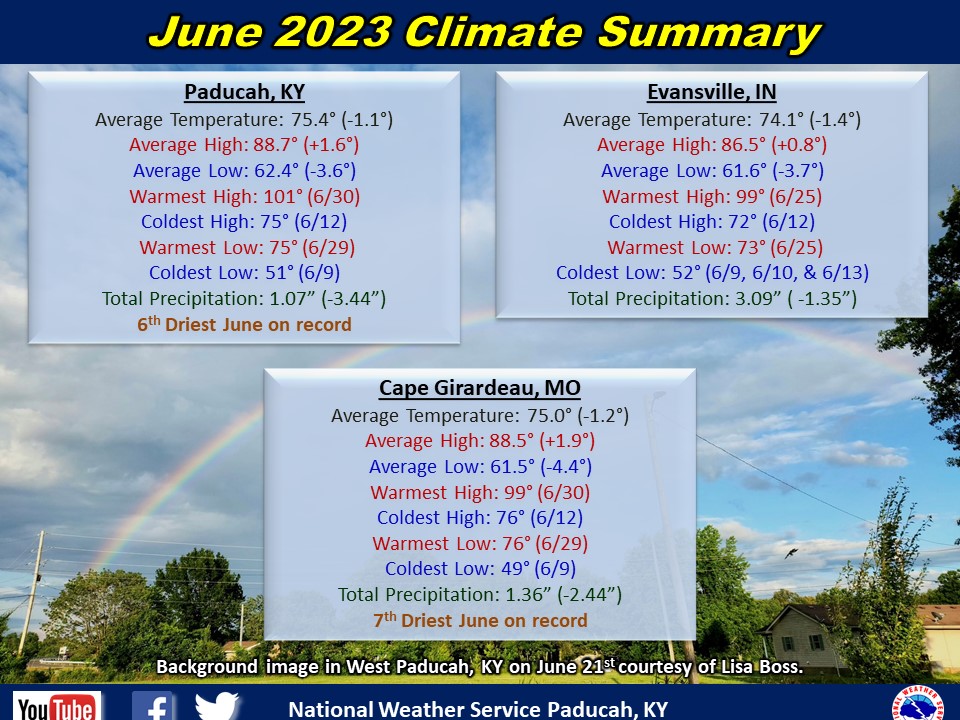
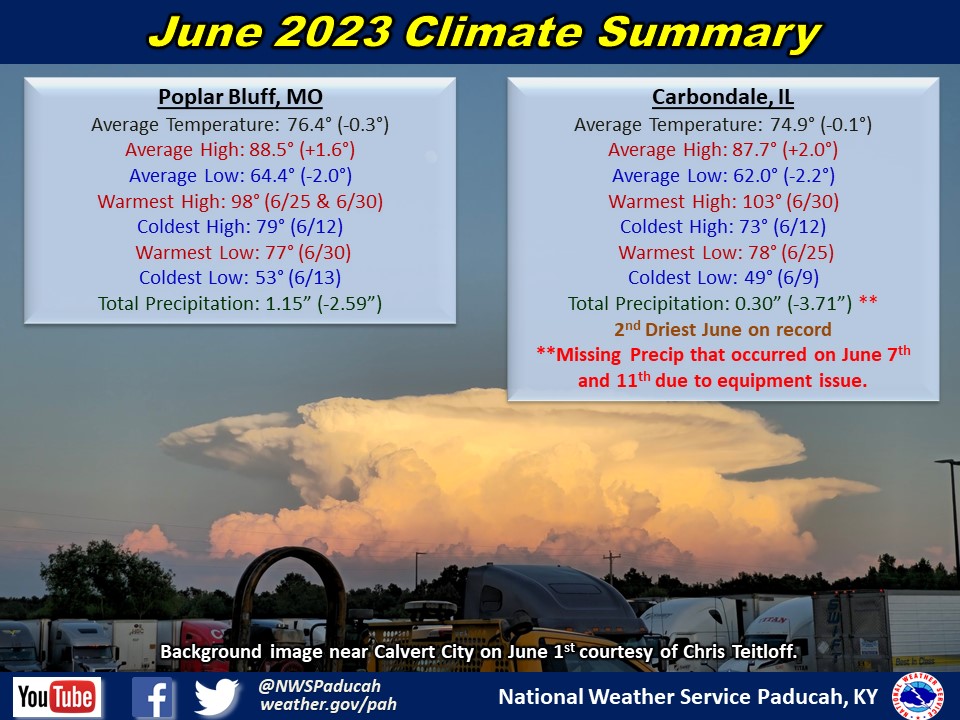
Temperatures averaged below normal by around 1 degree. This was due to a much larger diurnal range than we typically see in June. Low temperatures were on the order of 3 to 4 degrees below normal. Meanwhile, high temperatures actually finished around 1.5 degrees above normal. The large range in temperatures was due to the worsening drought situation across the region. The month started off warm through the first 5 days, with highs reaching the low to mid 90s. Then a prolonged cooler stretch took hold of the region from the 6th through the 23rd. The most pronounced period was between the 7th and 14th when highs were generally only in the mid 70s to mid 80s and lows dipped into the low to mid 50s much of the time. A few sites (Cape Girardeau and Carbondale) even had lows fall into the 40s on the 9th. The last week of the month brought warmer temperatures with highs back into the upper 80s and 90s. We even had some locations top 100 degrees on June 25th and again on the 29th and 30th. Carbondale registered their warmest temperatures since 2012 when they reached 103 on June 30th.
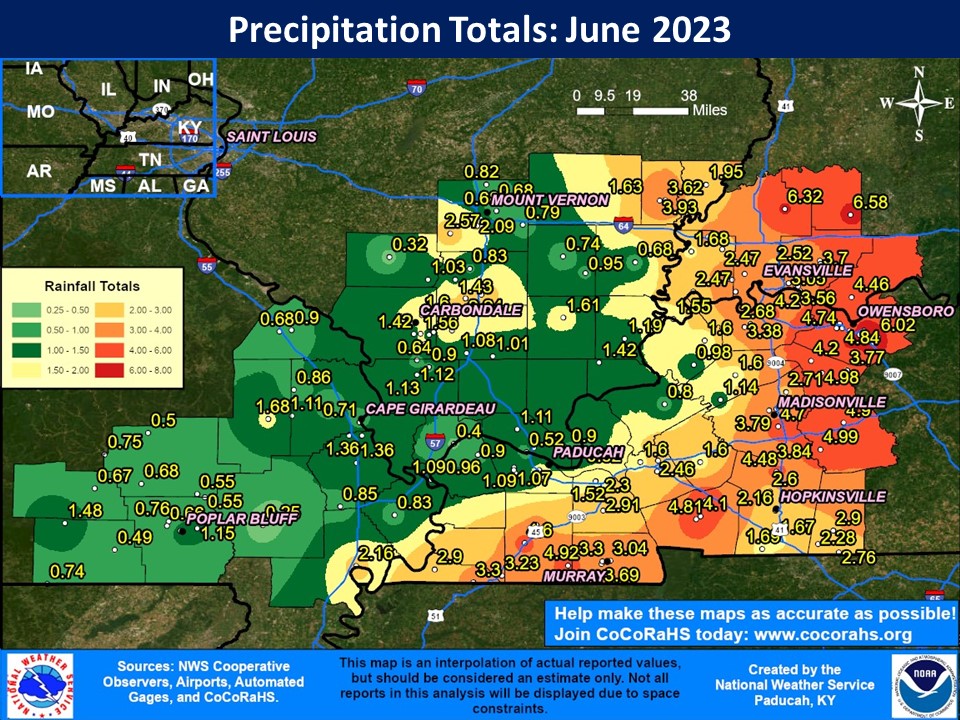
Precipitation was drier than normal across much of the region, with many locations only receiving 0.50” to 2” of rain for the entire month. This was generally 2 to 4” below normal for June. By the end of the month a large portion of the region was observing moderate drought conditions. A few locations across southeast Missouri and southern Illinois barely picked up a 0.25”. However, the last two days of the month saw heavy rainfall in portions of Southwest Indiana and the Kentucky Pennyrile with 2 to 5” of rain on the 29th in Southwest Indiana and across the river in Daviess County. The area that faired the best for the first four weeks of the month was across portions of west Kentucky near the Tennessee border and into the Pennyrile region, which generally picked up amounts of 2 to 5”, but the last two day rainfall pushed the Owensboro area and Southwest Indiana to the lead. The highest observed amount for the month was 6.85” at a CoCoRaHS stations in Daviess County, Kentucky (Owensboro 3.5 ESE).
| June 2023 Review: Precipitation and Temperature Maps (Click on image to enlarge) |
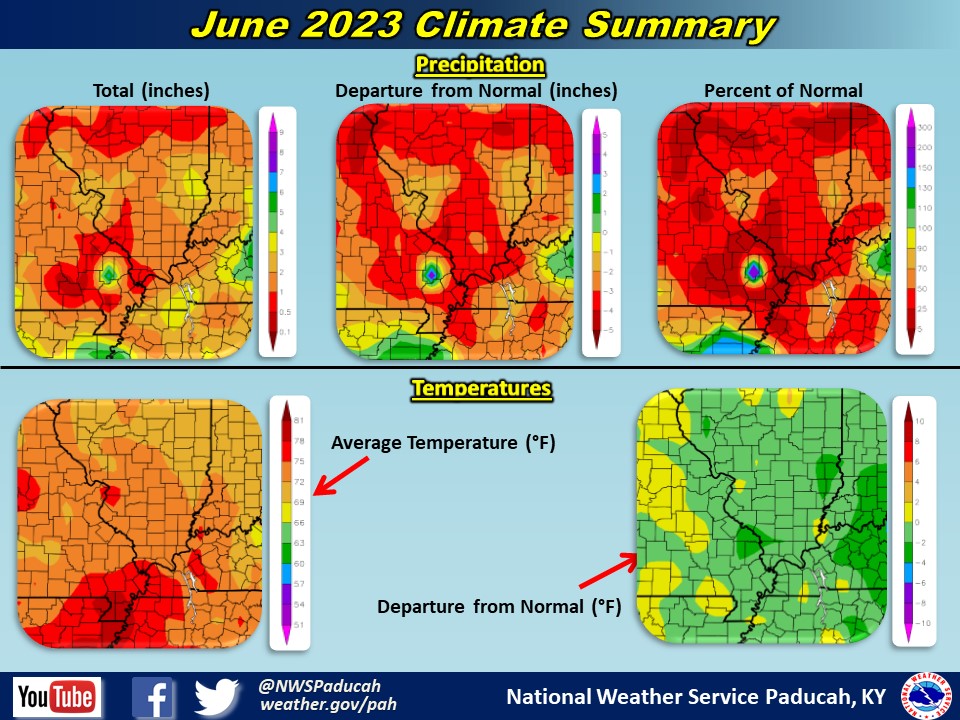 |
| Climate Maps are from the Northeast Regional Climate Center |
Monthly Climate Report: Paducah | Evansville | Cape Girardeau | Poplar Bluff | Carbondale