*Climate Data has been recorded at Barkley Regional Airport in West Paducah since 1949 and prior to that was observed in downtown Paducah back to December of 1937.
Labor Day is a holiday celebrated on the first Monday in September. It is a celebration of the American Labor Movement. For climate purposes, the 1st Monday in September for all years on record are used meaning anytime from September 1st through the 7th.
Here is a look at high and low temperature frequencies and extremes as well as precipitation statistics for Labor Day in Paducah.
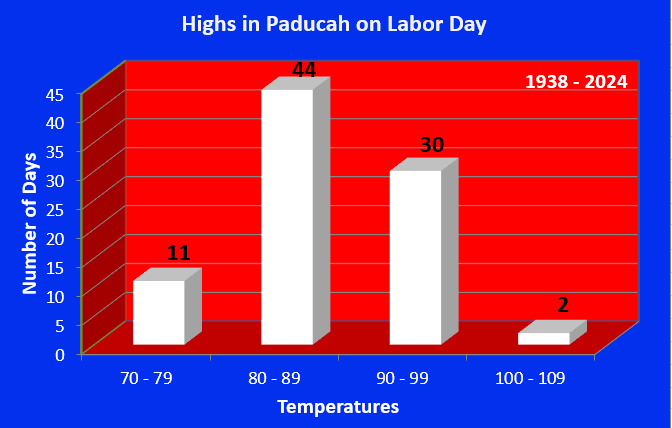
As seen by this graphic high temperatures are predominately in the 80s or 90s on Labor Day, encompassing 84% of all years on record.
| Warmest Highs | Coldest Highs |
| 101 in 1954 | 72 in 2011 |
| 100 in 1947 | 72 in 1986 |
| 97 in 1960 | 73 in 1972 |
| 96 in 1990 | 75 in 2006 |
| 95 in 2007* | 76 in 1994* |
| Normal High: | 86 |
*Denotes a tie in previous year(s)
Paducah has only hit the century mark on two occasions, and it hasn't occurred since 1954. There have been 11 years where the high temperature failed to reach 80 degrees. This last happened in 2011 when a record cold high for the holiday was set of 72 degrees.
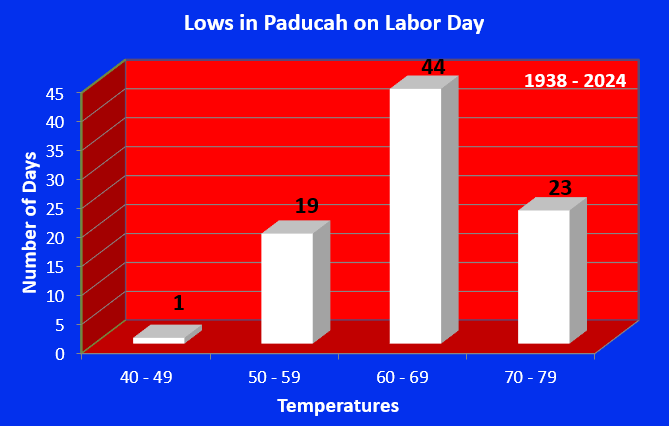
Low temperatures typically fall in the 60s, which accounts for 51% of the years on record. There are exceptions to this though: in 1988 the low dipped down to 49 degrees. On the warm side of the spectrum, lows have been held above 75 degrees twice, last occurring in 2014.
| Warmest Lows | Coldest Lows |
| 77 in 1980 | 49 in 1988 |
| 76 in 2014 | 51 in 1976 |
| 74 in 1970 | 53 in 1967 |
| 74 in 1939 | 55 in 1974 |
| 73 in 2018* | 55 in 1968* |
| Normal Low: | 62 |
*Denotes a tie in previous year(s)
Measurable precipitation has fallen 24% of the time, with over an inch of precipitation falling on 3 different occasions, most recently in 1987.
| Wettest |
| 1.50 in 1948 |
| 1.46 in 1952 |
| 1.28 in 1987 |
| 0.94 in 1994 |
| 0.74 in 1962 |
Here is a look at the observed weather for the past 15 years:
| Recent Weather for Labor Day | |||
| Year | High | Low | Precip |
| 2010 | 92 | 59 | 0 |
| 2011 | 72 | 58 | 0 |
| 2012 | 83 | 73 | 0.13 |
| 2013 | 89 | 65 | 0 |
| 2014 | 89 | 76 | 0 |
| 2015 | 92 | 70 | 0 |
| 2016 | 90 | 70 | 0 |
| 2017 | 89 | 70 | 0 |
| 2018 | 94 | 73 | 0 |
| 2019 | 89 | 67 | 0 |
| 2020 | 89 | 69 | 0 |
| 2021 | 87 | 56 | 0 |
| 2022 | 86 | 69 | 0 |
| 2023 | 91 | 72 | 0.60 |
| 2024 | 86 | 64 | 0 |
*Climate Data has been recorded at Evansville Regional Airport since January of 1897.
Labor Day is a holiday celebrated on the first Monday in September. It is a celebration of the American Labor Movement. For climate purposes, the 1st Monday in September for all years on record are used meaning anytime from September 1st through the 7th.
Here is a look at high and low temperature frequencies and extremes as well as precipitation statistics for Labor Day in Evansville.
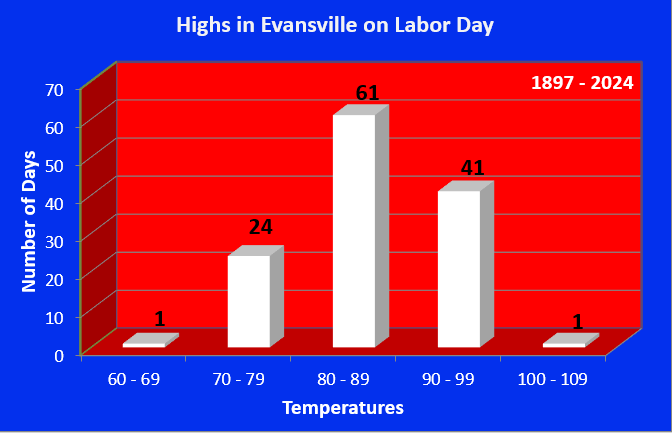
As seen by this graphic high temperatures are predominately in the 80s or 90s on Labor Day, encompassing 78% of all years on record.
| Warmest Highs | Coldest Highs |
| 101 in 1925 | 69 in 2011 |
| 99 in 1954 | 70 in 1905 |
| 97 in 2007 | 71 in 1986 |
| 97 in 1960 | 71 in 1974 |
| 97 in 1913 | 72 in 1972 |
| Normal High: | 86 |
Evansville has only hit the century mark once on this holiday, all the way back in 1925. This was quite the contrast to the coldest high temperature which occurred in 2011 with a cool reading of 69 degrees.
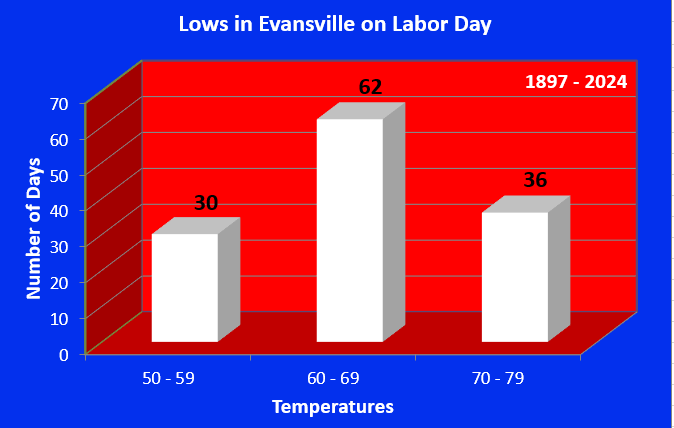
Low temperatures fall in the 60s most frequently, accounting for 48% of the years on record. Overall low temperatures don't vary all that much on Labor day with low temperatures having always fallen in the 50s, 60s, or 70s.
| Warmest Lows | Coldest Lows |
| 79 in 1907 | 52 in 1976 |
| 78 in 1925 | 52 in 1958 |
| 74 in 1983 | 52 in 1953 |
| 74 in 1912 | 53 in 1956 |
| 74 in 1902 | 54 in 1988* |
| Normal Low: | 62 |
*Denotes a tie in previous year(s)
Measurable precipitation has fallen 28% of the time, with over an inch of precipitation falling on 4 different occasions, but this hasn't happened since 1971.
| Wettest |
| 2.52 in 1962 |
| 2.10 in 1971 |
| 1.49 in 1914 |
| 1.13 in 1948 |
| 0.93 in 1984 |
Here is a look at the observed weather for the past 15 years:
| Recent Weather for Labor Day | |||
| Year | High | Low | Precip |
| 2010 | 93 | 55 | 0 |
| 2011 | 69 | 58 | T |
| 2012 | 87 | 73 | 0.25 |
| 2013 | 88 | 69 | 0 |
| 2014 | 84 | 73 | 0.15 |
| 2015 | 93 | 69 | 0 |
| 2016 | 93 | 67 | 0 |
| 2017 | 89 | 68 | T |
| 2018 | 94 | 72 | 0 |
| 2019 | 84 | 66 | 0 |
| 2020 | 88 | 66 | 0 |
| 2021 | 87 | 57 | 0 |
| 2022 | 85 | 70 | 0.05 |
| 2023 | 91 | 70 | 0 |
| 2024 | 86 | 61 | 0 |
*Climate Data has been recorded at Cape Girardeau Regional Airport, located 5 miles southwest of Cape Girardeau, since June of 1960.
Labor Day is a holiday celebrated on the first Monday in September. It is a celebration of the American Labor Movement. For climate purposes, the 1st Monday in September for all years on record are used meaning anytime from September 1st through the 7th.
Here is a look at high and low temperature frequencies and extremes as well as precipitation statistics for Labor Day in Cape Girardeau.
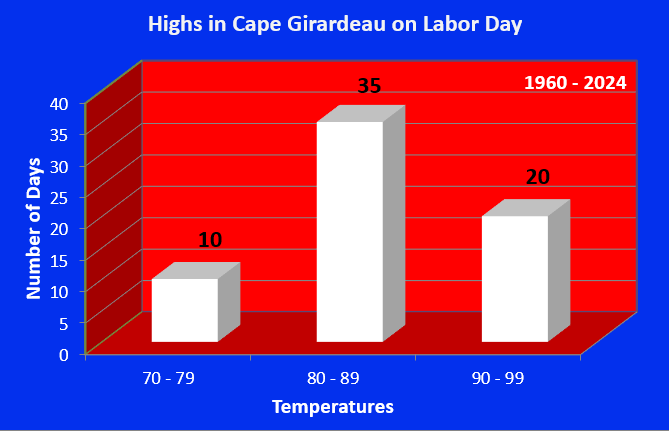
As seen by this graphic high temperatures are predominately in the 80s or 90s on Labor Day, encompassing 82% of all years on record.
| Warmest Highs | Coldest Highs |
| 98 in 1970 | 73 in 1984 |
| 98 in 1960 | 73 in 1974 |
| 97 in 1980 | 73 in 1972 |
| 95 in 2007 | 74 in 1988 |
| 94 in 1990 | 74 in 1986 |
| Normal High: | 86 |
Cape Girardeau has seen high temperatures as warm as 98 degrees on this holiday, last set in 1970. It has also been as cool as 73 degrees, last set in 1984.
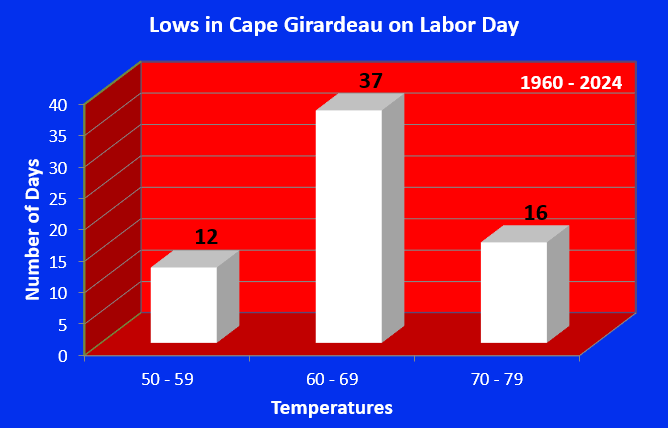
Low temperatures typically fall in the 60s, which accounts for 56% of the years on record. There are always exceptions, with Labor Day 1983 seeing lows only dipping to 75 degrees. On the cold side of the spectrum, in 1968 the low temperature went all the way down to 53 degrees.
| Warmest Lows | Coldest Lows |
| 75 in 1983 | 53 in 1968 |
| 74 in 2014 | 54 in 1976 |
| 74 in 2003 | 55 in 2021 |
| 74 in 1980 | 55 in 2010 |
| 74 in 1971 | 55 in 2005* |
| Normal Low: | 61 |
*Denotes a tie in previous year(s)
Measurable precipitation has fallen 23% of the time, with over an inch of precipitation falling on 4 different occasions, most recently in 2023.
| Wettest |
| 1.50 in 2016 |
| 1.23 in 1962 |
| 1.13 in 1969 |
| 1.00 in 2023 |
| 0.67 in 1994 |
Here is a look at the observed weather for the past 15 years:
| Recent Weather for Labor Day | |||
| Year | High | Low | Precip |
| 2010 | 89 | 55 | 0 |
| 2011 | 75 | 60 | 0 |
| 2012 | 85 | 69 | 0 |
| 2013 | 88 | 62 | 0 |
| 2014 | 86 | 74 | 0 |
| 2015 | 90 | 68 | 0.31 |
| 2016 | 89 | 73 | 1.50 |
| 2017 | 91 | 66 | 0 |
| 2018 | 91 | 72 | 0 |
| 2019 | 88 | 64 | 0 |
| 2020 | 87 | 67 | 0 |
| 2021 | 87 | 55 | 0 |
| 2022 | 87 | 68 | 0 |
| 2023 | 92 | 71 | 1.00 |
| 2024 | 86 | 64 | 0 |
Climate Data has been recorded at the Poplar Bluff Airport, located 4 miles east of Poplar Bluff, since December of 1997. Prior to that data was taken at the Poplar Bluff COOP station, located a half mile west of downtown. Data for the COOP station dates back to January 1893.
Labor Day is a holiday celebrated on the first Monday in September. It is a celebration of the American Labor Movement. For climate purposes, the 1st Monday in September for all years on record are used meaning anytime from September 1st through the 7th.
Here is a look at high and low temperature frequencies and extremes as well as precipitation statistics for Labor Day in Poplar Bluff.
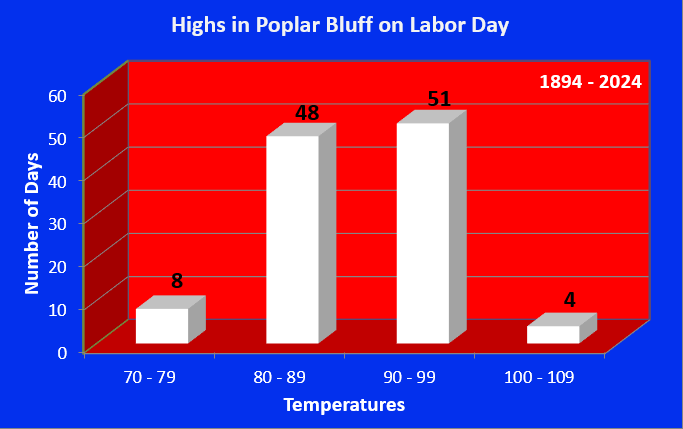
As seen by this graphic high temperatures are predominately in the 80s or 90s on Labor Day, encompassing 89% of all years on record.
| Warmest Highs | Coldest Highs |
| 108 in 1925 | 72 in 1972 |
| 104 in 1954 | 75 in 1974 |
| 102 in 1947 | 75 in 1937 |
| 101 in 1960 | 76 in 1934 |
| 99 in 1944* | 77 in 2011* |
| Normal High: | 85 |
Poplar Bluff has seen high temperatures above 100 degrees four times on Labor Day, most recently back in 1960. Meanwhile there have been eight years with highs stuck in the 70s, most recently in 2011.
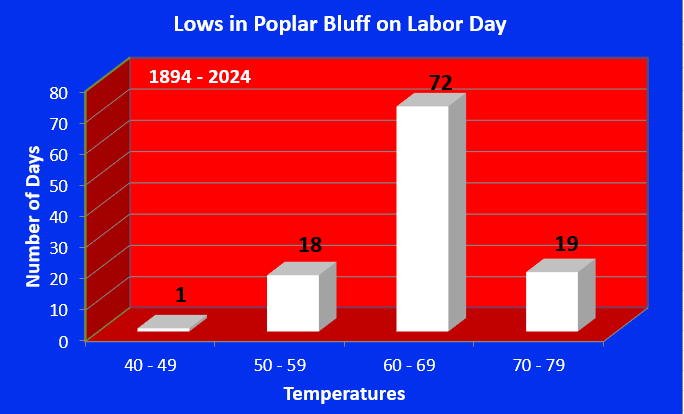
Low temperatures typically fall in the 60s, which accounts for 66% of the years on record. There are always exceptions, with Labor Day 1939 seeing lows only dipping to 76 degrees. On the cold side of the spectrum, the only time the low temperature dipped into the 40s was way back in 1896.
| Warmest Lows | Coldest Lows |
| 76 in 1939 | 49 in 1896 |
| 74 in 2003 | 50 in 1919 |
| 73 in 2014 | 51 in 1967 |
| 73 in 1973 | 51 in 1955 |
| 73 in 1971* | 51 in 1895 |
| Normal Low: | 63 |
Measurable precipitation has fallen 23% of the time, with over an inch of precipitation falling on 2 different occasions, most recently in 1933.
| Wettest |
| 1.38 in 1933 |
| 1.30 in 1895 |
| 0.79 in 1992 |
| 0.67 in 1948 |
| 0.55 in 1996* |
Here is a look at the observed weather for the past 15 years:
| Recent Weather for Labor Day | |||
| Year | High | Low | Precip |
| 2010 | 90 | 52 | 0 |
| 2011 | 77 | 60 | 0 |
| 2012 | 90 | 72 | 0 |
| 2013 | 87 | 66 | 0 |
| 2014 | 88 | 73 | 0.01 |
| 2015 | 90 | 67 | 0 |
| 2016 | 90 | 71 | 0.24 |
| 2017 | 91 | 67 | 0 |
| 2018 | 89 | 69 | 0.03 |
| 2019 | 89 | 68 | 0 |
| 2020 | 88 | 64 | 0 |
| 2021 | 86 | 58 | 0 |
| 2022 | 83 | 67 | 0.03 |
| 2023 | 93 | 70 | 0.36 |
| 2024 | 84 | 65 | 0 |
Climate Data has been recorded at Southern Illinois Airport, located 4 miles northwest of Carbondale, since August of 1998. Prior to that data was taken at the Carbondale Sewage Plant COOP station, located 3 miles east of Carbondale. Data for the COOP station dates back to November 1898.
Labor Day is a holiday celebrated on the first Monday in September. It is a celebration of the American Labor Movement. For climate purposes, the 1st Monday in September for all years on record are used meaning anytime from September 1st through the 7th.
Here is a look at high and low temperature frequencies and extremes as well as precipitation statistics for Labor Day in Carbondale.
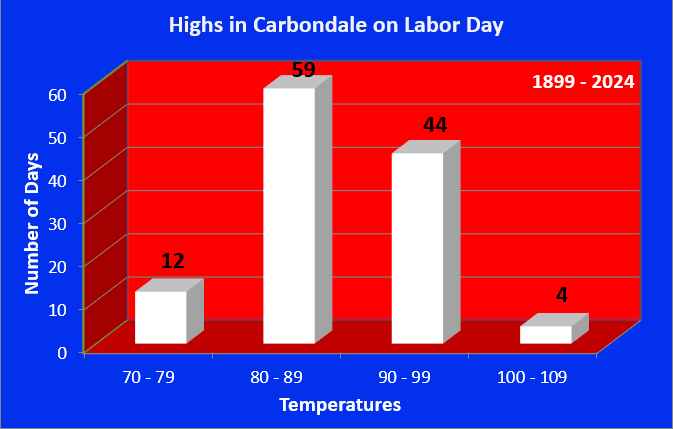
As seen by this graphic high temperatures are predominately in the 80s or 90s on Labor Day, encompassing 86% of all years on record.
| Warmest Highs | Coldest Highs |
| 106 in 1925 | 73 in 1972 |
| 101 in 1913 | 74 in 1988 |
| 101 in 1899 | 75 in 2011 |
| 100 in 1954 | 76 in 1974 |
| 99 in 1960 | 76 in 1933* |
| Normal High: | 84 |
Carbondale has seen high temperatures above 100 degrees four times on Labor Day, most recently back in 1954. Meanwhile there have been 12 years with highs stuck in the 70s, most recently in 2011.
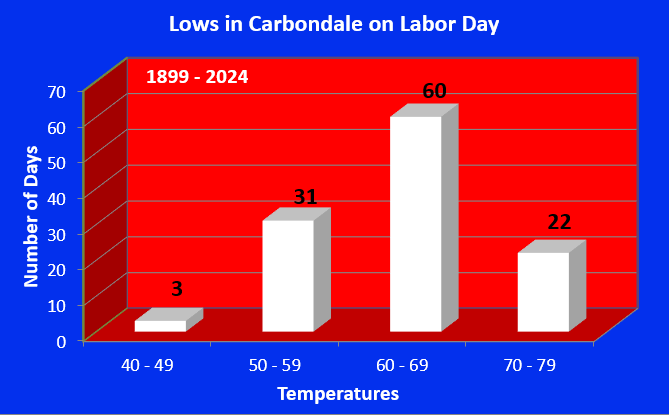
Low temperatures typically fall in the 60s, which accounts for 53% of the years on record. There are always exceptions, with Labor Day 1939 seeing lows only dipping to 77 degrees. Meanwhile, there have been three times where the low dipped into the 40s, most recently back in 1976
| Warmest Lows | Coldest Lows |
| 77 in 1939 | 44 in 1976 |
| 75 in 1941 | 45 in 1919 |
| 74 in 2014 | 49 in 1903 |
| 74 in 1971 | 50 in 1982 |
| 73 in 1970 | 50 in 1955* |
| Normal Low: | 60 |
*Denotes a tie in previous year(s)
Measurable precipitation has fallen 24% of the time, with over an inch occurring only once, way back in 1918.
| Wettest |
| 1.36 in 1918 |
| 0.97 in 1992 |
| 0.83 in 1921 |
| 0.69 in 2003 |
| 0.69 in 1994 |
Here is a look at the observed weather for the past 15 years:
| Recent Weather for Labor Day | |||
| Year | High | Low | Precip |
| 2010 | 89 | 52 | 0 |
| 2011 | 75 | 57 | 0 |
| 2012 | 83 | 70 | 0.03 |
| 2013 | 87 | 64 | 0 |
| 2014 | 83 | 74 | T |
| 2015 | 90 | 69 | 0 |
| 2016 | 88 | 69 | 0.02 |
| 2017 | 90 | 69 | 0.05 |
| 2018 | 90 | 69 | 0 |
| 2019 | 87 | 64 | 0 |
| 2020 | 88 | 68 | 0 |
| 2021 | 86 | 56 | 0 |
| 2022 | 85 | 68 | 0 |
| 2023 | 90 | 71 | M |
| 2024 | 82 | 56 | M |

