Summer 2025 Climate Summary:
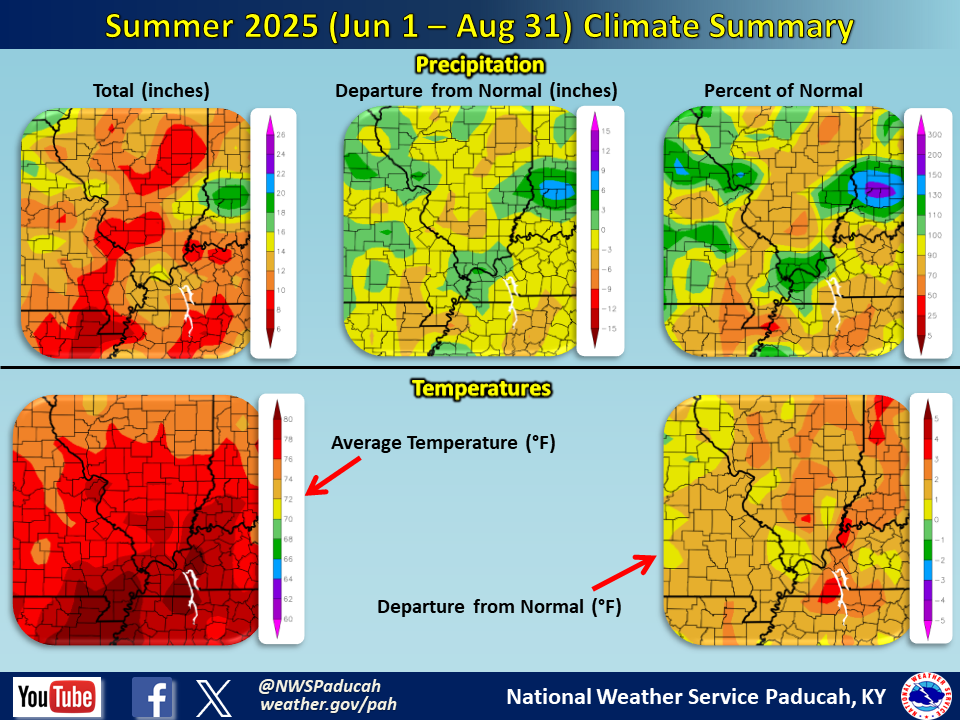
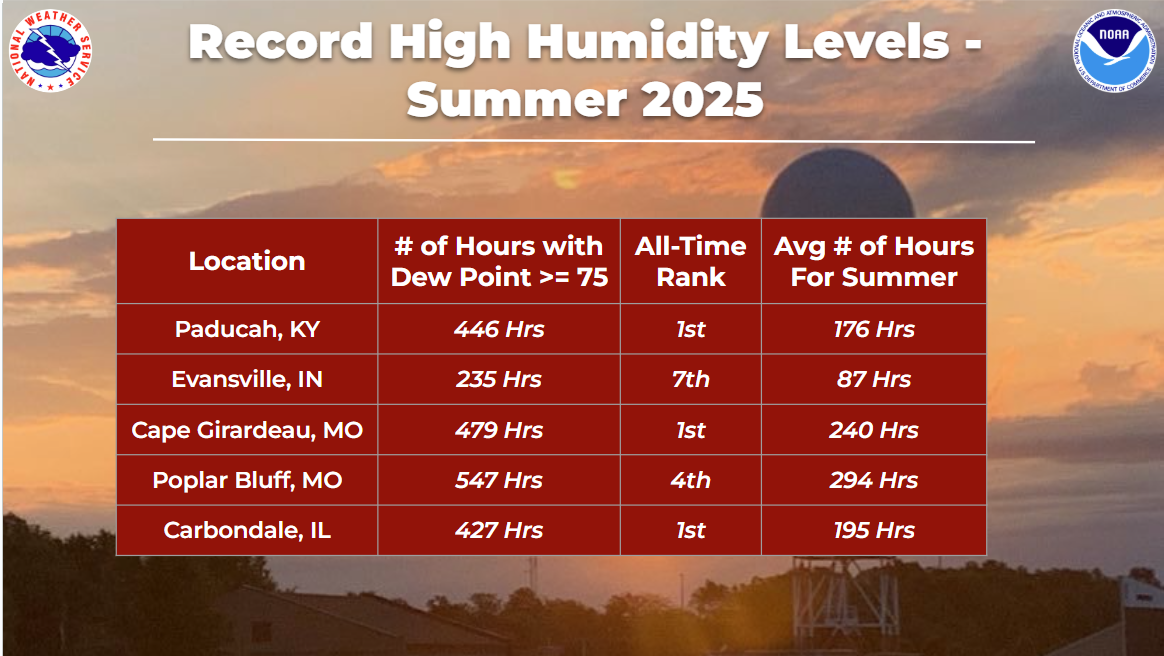
Temperatures averaged above normal by 0.5 to 1.5 degrees. Both June and July averaged warmer than normal, while August was cooler than normal. We waited longer than normal to get into the summer heat with many areas observing one of their latest first 90 degree dates on record (June 20th) including Paducah. However, once it hit we endured one heck of a brutal combination of heat and humidity from the latter part of June through mid August. We broke several records for the prolonged duration of the high humidity levels. Paducah observed our most humid summer on record in terms of the number of hours with dew points reaching both 70 and 75 degrees. As conditions dried out during late July through August, humidity levels finally lowered dramatically by the latter half of August. Temperatures also dipped below normal with some record lows even observed around August 25-27. This was a welcome change after how oppressive the humidity was much of the summer season. Paducah observed 8 consecutive days with lows falling below 60 degrees to end the summer, which broke the previous August record of 7 consecutive days set back in 2004 and 1989.
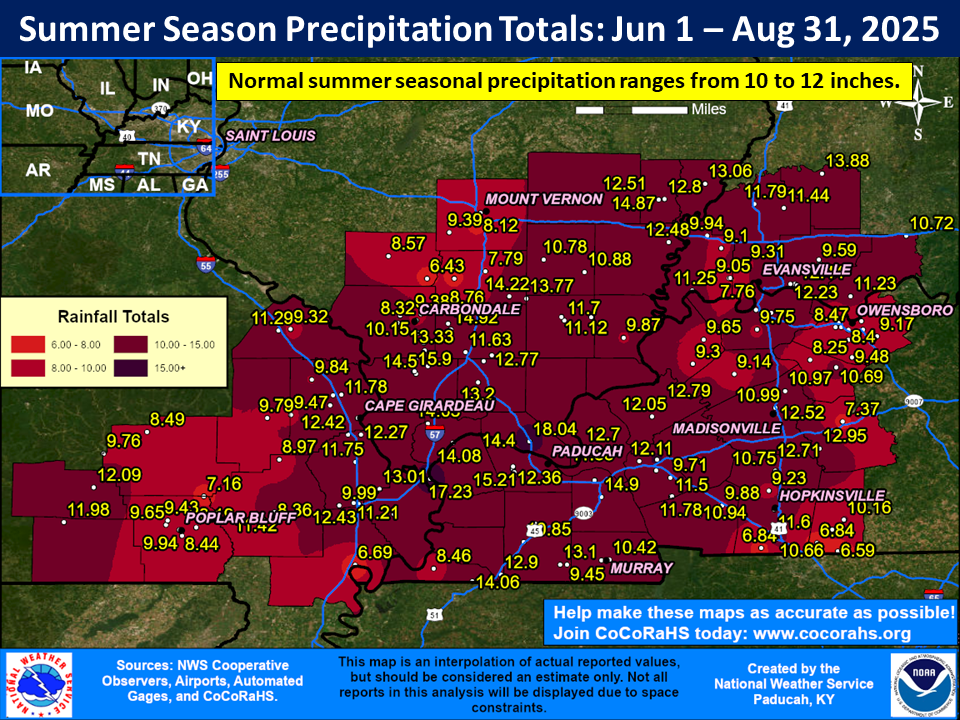
Precipitation varied, with amounts ranging from 1-4” wetter than normal in some areas to 1-4” drier than normal in others. The summer started off wet with June finishing wetter than normal, and a few locations even observed one of their top 10 wettest June’s including Paducah and Cape Girardeau. July remained wet across mainly the north half of the region, while those further south started to dry out. Then August hit and the entire region experienced a flash drought with many areas experiencing one of their top 5 driest August’s on record. The wetter areas tended to have amounts ranging from 12-15”, with localized higher totals, while the drier corridors registered 7-10” along with a few areas that received less than that. For the season, there was a corridor of wetter conditions from Sikeston/Charleston Missouri areas into a large part of southern Illinois and areas of west Kentucky, particularly those closer to the Ohio River. Much of southwest Indiana also experienced a wetter than normal summer. Meanwhile, the dry corridors were focused from the Missouri Ozark Foothills northeast into portions of southwest Illinois (Perry/Jefferson counties in particular). Another zone of drier conditions was in portions of west Kentucky closer to the Tennessee line along with a few smaller areas around Owensboro and small patches of southwest Indiana. The highest observed amount in our forecast area was 18.04” at a CoCoRaHS station in Massac County, IL (Metropolis 2.9 NNE).
The graphic below is an interpolated rainfall map using actual observations. Please note that there are likely discrepancies in between observations, since the values are estimated based on nearest reports.
|
Summer 2025 Review: Precipitation and Temperature Maps (Click on image to enlarge) |
 |
| Climate Maps are from the Northeast Regional Climate Center |

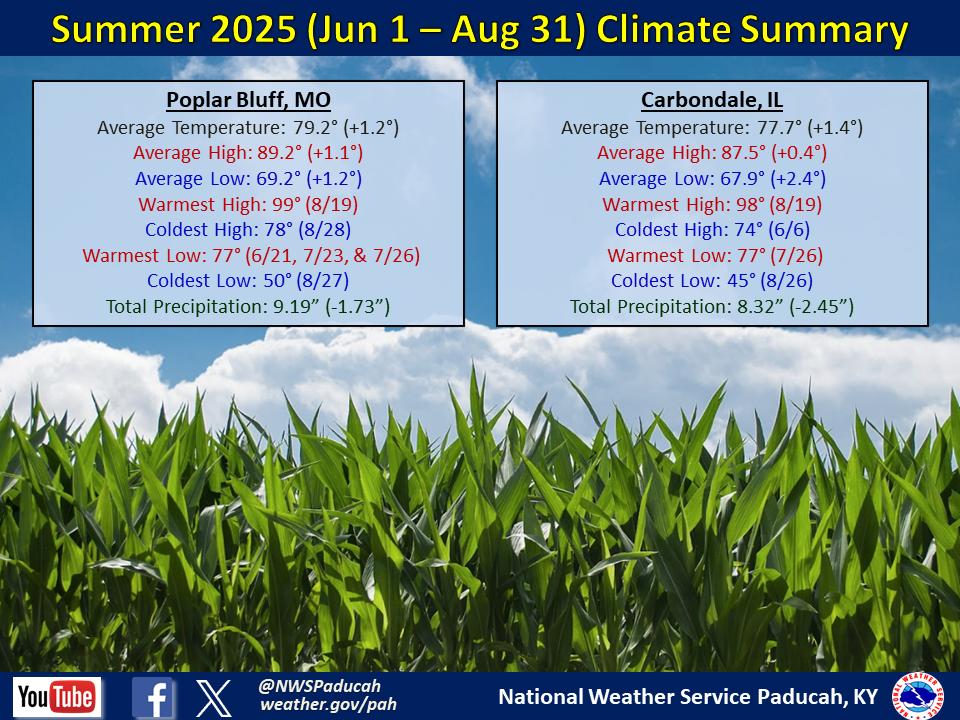
Seasonal Climate Report: Paducah | Evansville | Cape Girardeau | Poplar Bluff | Carbondale
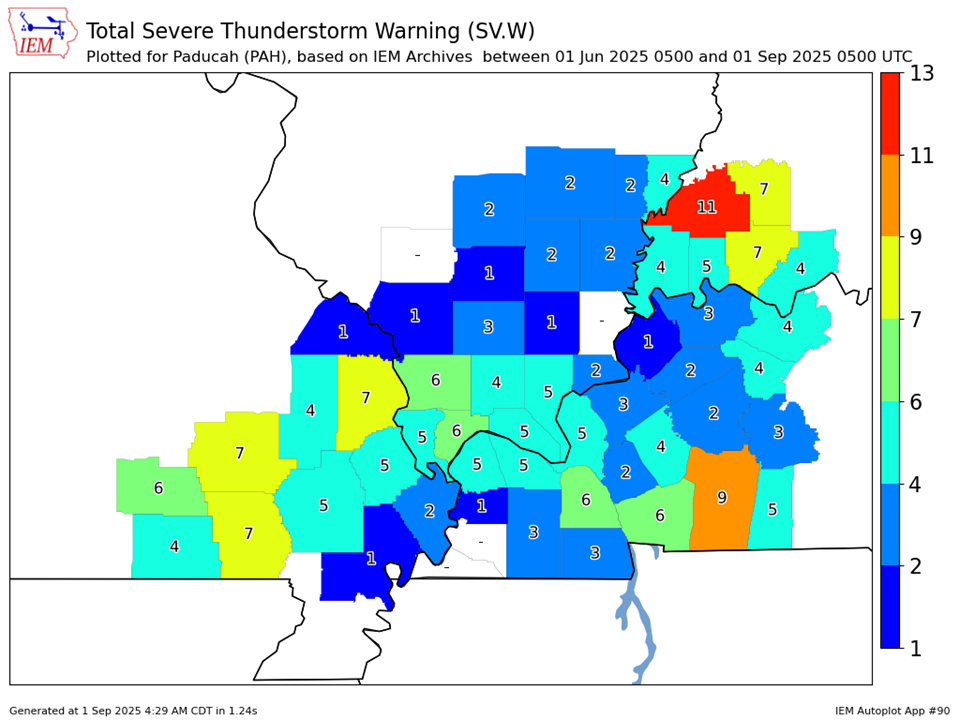
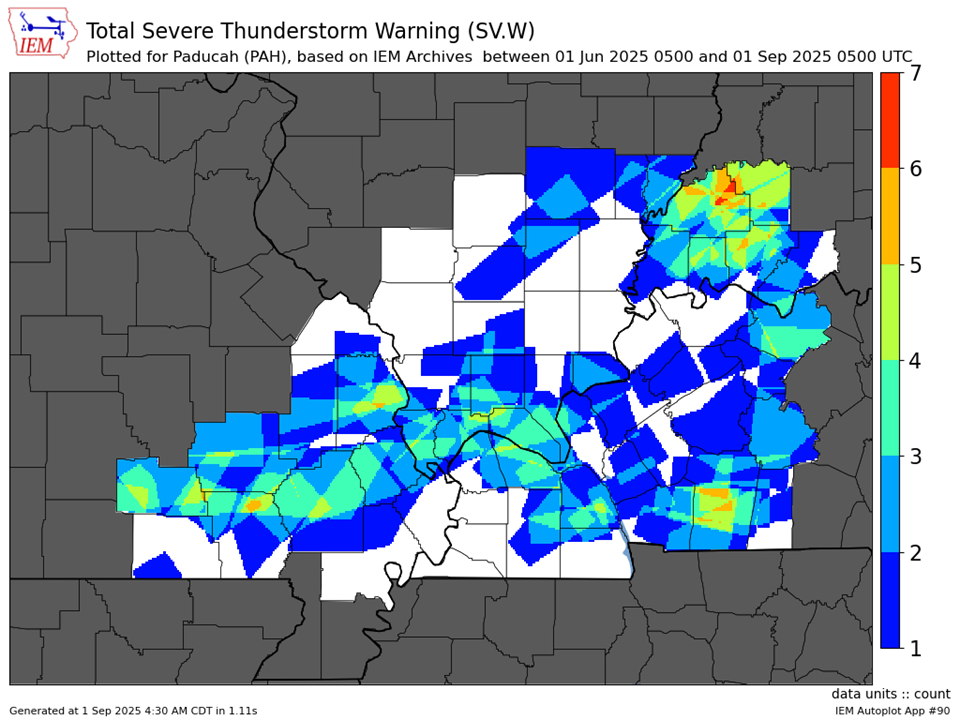
| Severe Thunderstorm Warnings - County Based | Severe Thunderstorm Warnings - Polygon Based |
 |
 |
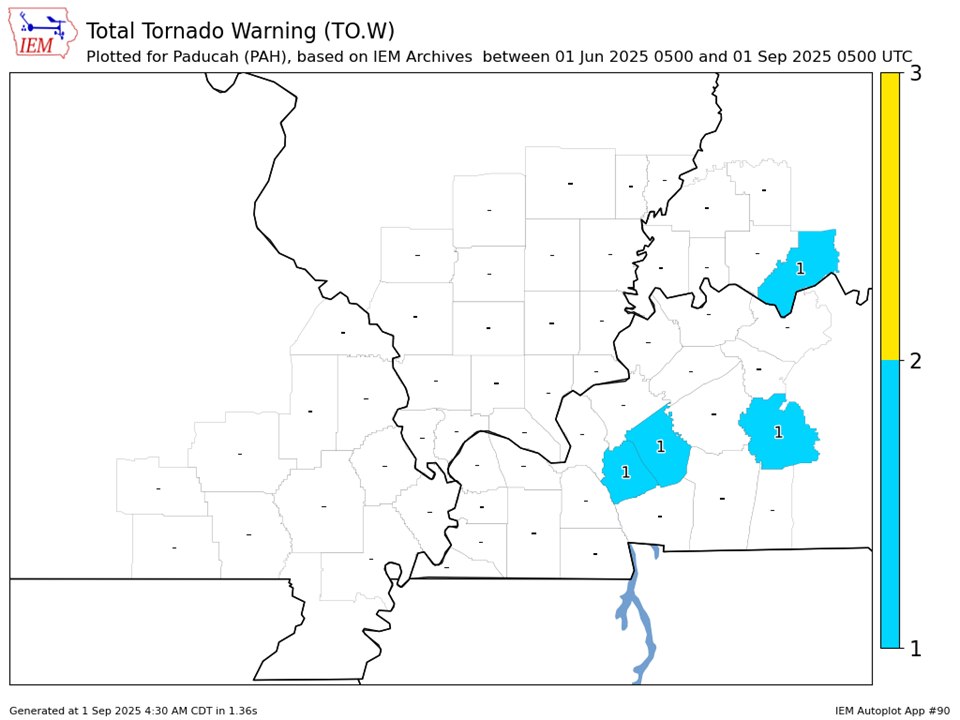
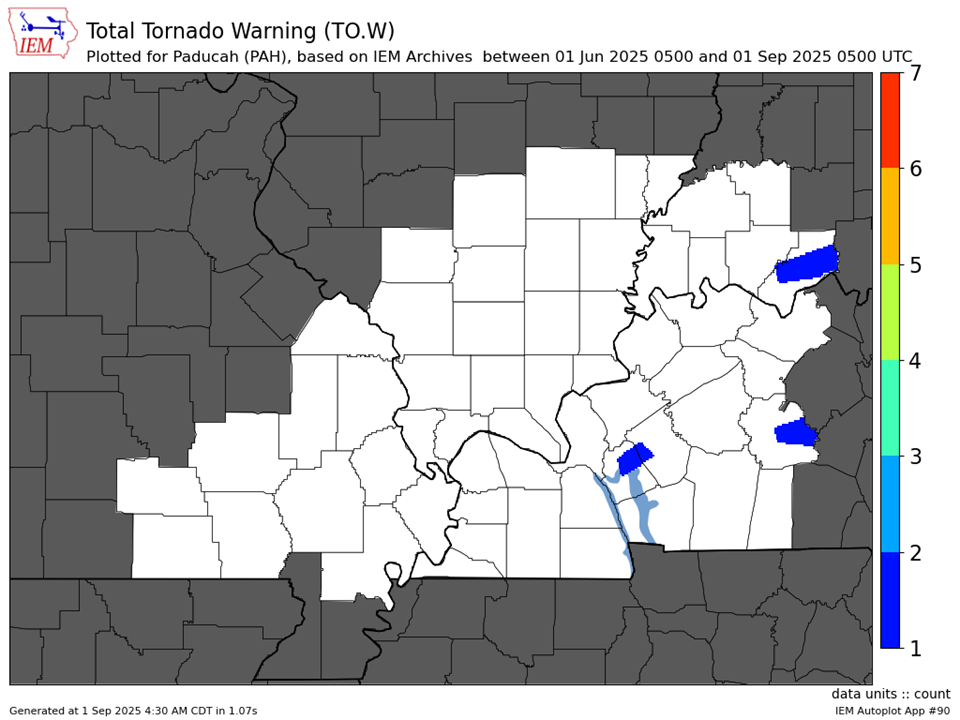
| Tornado Warnings - County Based | Tornado Warnings - Polygon Based |
|
|
|