*Climate Data has been recorded at Barkley Regional Airport in West Paducah since 1949 and prior to that was observed in downtown Paducah back to December of 1937.
Valentine's Day is celebrated on February 14th every year.
Here is a look at high and low temperature frequencies and extremes as well as precipitation statistics for Valentine's Day in Paducah.
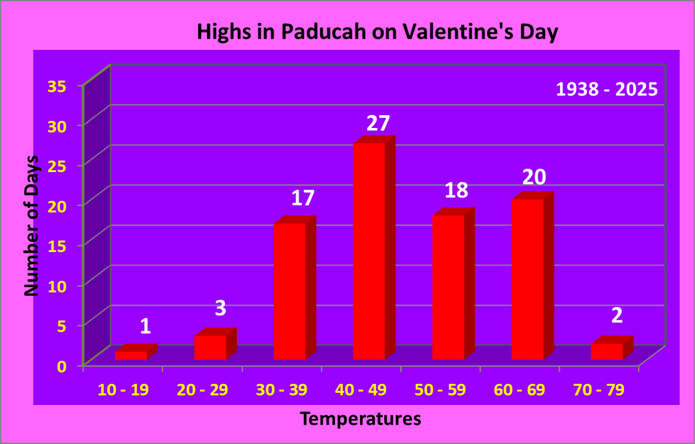
As seen by this graphic, high temperatures from the 30s all the way to the 60s are not uncommon on Valentine's Day.
| Warmest Highs | Coldest Highs |
| 72 in 1990 | 16 in 2021 |
| 72 in 1938 | 28 in 2007 |
| 67 in 1954 | 28 in 1943 |
| 65 in 2024 | 29 in 2020 |
| 65 in 1984* | 30 in 1968 |
| Normal High: | 49 |
*Denotes a tie in previous year(s)
Paducah has seen highs as warm as the 70s 2 times, back in 1990 and 1938. There have also been 6 years where the high temperature failed to reach 32 degrees. This last occurred in 2021 when the high only made it up to 16 degrees!
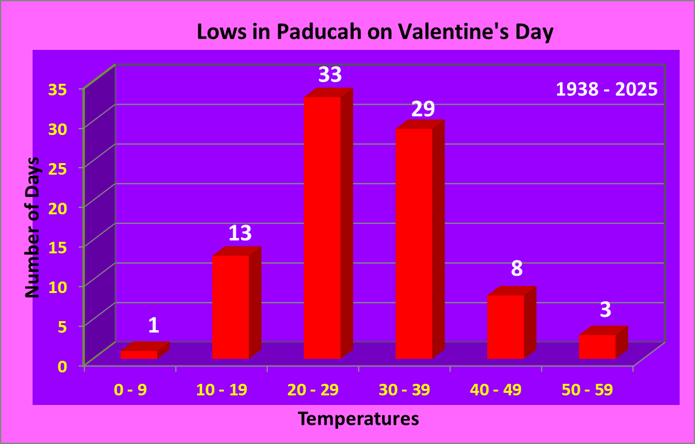
Low temperatures typically fall in the 20s or 30s, accounting for 74% of all years on record. There are always exceptions to the norm of course: in 2021 the low temperature dropped to a frigid 8 degrees, which is 1 of 13 years that lows have dropped below 20 degrees. There have been 3 years with lows in the 50s, in 2001, 1956, and 1954.
| Warmest Lows | Coldest Lows |
| 55 in 1954 | 8 in 2021 |
| 54 in 2001 | 10 in 1971 |
| 51 in 1956 | 11 in 1943 |
| 49 in 2005 | 13 in 2020 |
| 49 in 1990 | 14 in 1944 |
| Normal Low: | 29 |
Measurable precipitation has fallen 36% of the time, with over an inch of precipitation falling on 6 different occasions, the most recent being in 2003. Measurable snowfall has only occurred on 5 occasions (7% of all years on record), with the most recent in 2016. There have been 7 years (10% of all years on record) with a snow depth of 1 inch or greater. This last happened on Valentine's Day 2014 when there was 2 inches of snow on the ground.
| Wettest (inches) | Snowiest (inches) | Most Snow Depth |
| 3.48 in 1949 | 5.0 in 1944 | 3.0 in 1986 |
| 1.81 in 2003 | 4.2 in 1986 | 3.0 in 1985 |
| 1.51 in 1995 | 2.5 in 2016 | 3.0 in 1978 |
| 1.34 in 2001 | 1.8 in 1958 | 3.0 in 1971 |
| 1.15 in 1956 | 0.3 in 2021 | 3.0 in 1940 |
Here is a look at the observed weather for the past 15 years:
| Recent Weather for Valentine's Day | |||||
| Year | High | Low | Precip | Snowfall | Snow Depth |
| 2011 | 57 | 36 | 0 | 0 | 0 |
| 2012 | 41 | 32 | 0.06 | 0 | 0 |
| 2013 | 57 | 36 | 0 | 0 | 0 |
| 2014 | 40 | 24 | 0.4 | 0 | 2 |
| 2015 | 44 | 16 | 0 | T | 0 |
| 2016 | 31 | 23 | 0.45 | 2.5 | T |
| 2017 | 49 | 37 | 0.19 | T | 0 |
| 2018 | 63 | 48 | 0.22 | 0 | 0 |
| 2019 | 57 | 46 | 0 | 0 | 0 |
| 2020 | 29 | 13 | T | T | 0 |
| 2021 | 16 | 8 | 0.03 | 0.3 | T |
| 2022 | 49 | 21 | 0 | 0 | 0 |
| 2023 | 62 | 37 | 0.13 | 0 | 0 |
| 2024 | 65 | 36 | 0 | 0 | 0 |
| 2025 | 43 | 19 | 0 | 0 | 0 |
*Climate Data has been recorded at Evansville Regional Airport since January of 1897. Snowfall records began in January of 1948.
Valentine's Day is celebrated on February 14th every year.
Here is a look at high and low temperature frequencies and extremes as well as precipitation statistics for Valentine's Day in Evansville.
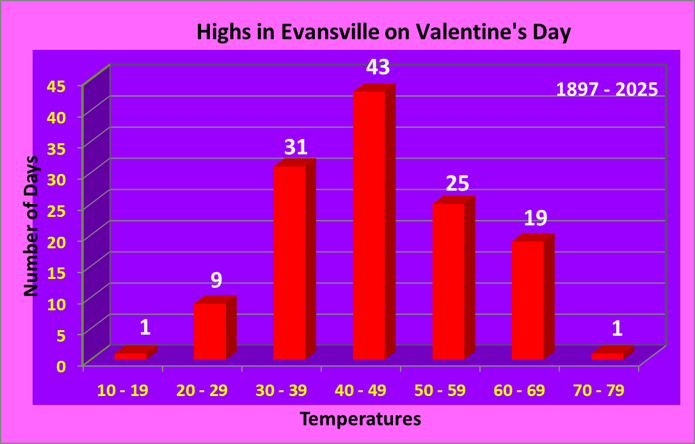
As seen by this graphic, high temperatures in the 40s are most common, accounting for 36% of all years on record. Highs in the 30s and 50s are rather common as well.
| Warmest Highs | Coldest Highs |
| 71 in 1921 | 19 in 1943 |
| 68 in 1949 | 21 in 2021 |
| 67 in 1954 | 25 in 2020 |
| 67 in 1918 | 25 in 1916 |
| 66 in 1934 | 25 in 1914 |
| Normal High: | 46 |
*Denotes a tie in previous year(s)
Evansville has seen highs as warm as the 70s once, back in 1921 when it soared to 71 degrees. There have also been 15 years where the high temperature failed to reach 32 degrees. This last occurred in 2021 when the high only made it up to 21 degrees.
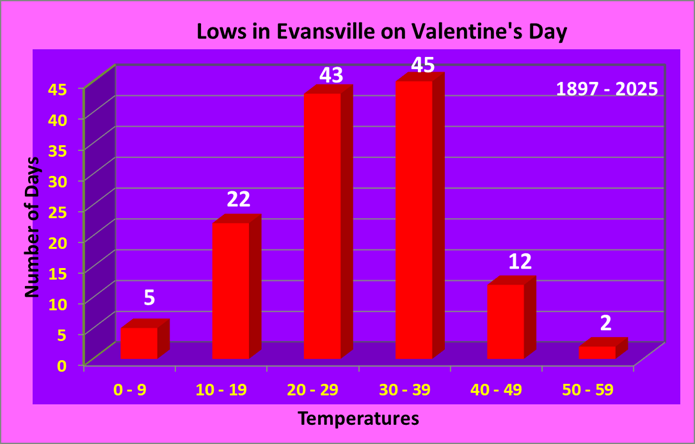
Low temperatures typically fall in the 20s or 30s, accounting for 70% of all years on record. There are always exceptions to the norm of course: in 1905 the low temperature dropped to a frigid 1 degrees, which is 1 of 5 years that lows have fallen into the single digits. There have been 2 years with lows in the 50s, back in 1954 and 1935.
| Warmest Lows | Coldest Lows |
| 53 in 1954 | 1 in 1905 |
| 50 in 1935 | 4 in 1971 |
| 49 in 2001 | 4 in 1943 |
| 48 in 1918 | 7 in 1899 |
| 48 in 1911 | 8 in 2021 |
| Normal Low: | 27 |
Measurable precipitation has fallen 39% of the time, with over an inch of precipitation falling on 4 different occasions, but this hasn't happened since 1956. Measurable snowfall has only occurred on 8 occasions (12% of all years on record), with the most recent in 2016. There have been 9 years (13% of all years on record) with a snow depth of 1 inch or greater. This last happened on Valentine's Day 2010 when there was 1 inch of snow on the ground.
| Wettest (inches) | Snowiest (inches) | Most Snow Depth |
| 2.07 in 1908 | 4.1 in 1970 | 6.0 in 1985 |
| 1.72 in 1909 | 3.4 in 1986 | 5.0 in 1971 |
| 1.35 in 1949 | 1.3 in 2010 | 4.0 in 1982 |
| 1.05 in 1956 | 1.1 in 2016 | 4.0 in 1978 |
| 0.72 in 1970 | 0.8 in 1948 | 4.0 in 1970 |
Here is a look at the observed weather for the past 15 years:
| Recent Weather for Valentine's Day | |||||
| Year | High | Low | Precip | Snowfall | Snow Depth |
| 2011 | 51 | 28 | 0 | 0 | 0 |
| 2012 | 40 | 32 | 0.08 | 0.2 | 0 |
| 2013 | 58 | 35 | 0 | 0 | 0 |
| 2014 | 37 | 19 | 0.19 | 0.1 | 0 |
| 2015 | 37 | 11 | T | T | 0 |
| 2016 | 29 | 23 | 0.13 | 1.1 | 0 |
| 2017 | 54 | 37 | 0.04 | T | 0 |
| 2018 | 60 | 38 | 0.67 | 0 | 0 |
| 2019 | 57 | 41 | 0 | 0 | 0 |
| 2020 | 25 | 11 | T | T | 0 |
| 2021 | 21 | 8 | 0.03 | 0.1 | T |
| 2022 | 38 | 17 | 0 | 0 | 0 |
| 2023 | 61 | 32 | 0.09 | 0 | 0 |
| 2024 | 62 | 34 | 0 | 0 | 0 |
| 2025 | 37 | 17 | 0 | 0 | 0 |
*Climate Data has been recorded at Cape Girardeau Regional Airport, located 5 miles southwest of Cape Girardeau, since June of 1960.
Valentine's Day is celebrated on February 14th every year.
Here is a look at high and low temperature frequencies and extremes as well as precipitation statistics for Valentine's Day in Cape Girardeau.
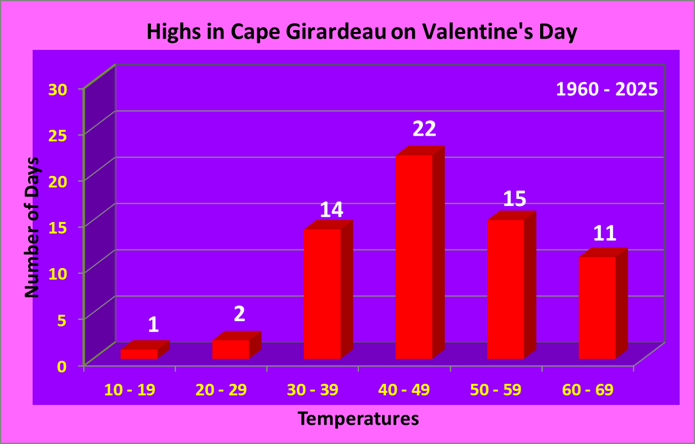
As seen by this graphic, high temperatures in the 40s are most common, accounting for 38% of all years on record. Highs in the 30s, 50s, and 60s are rather common as well.
| Warmest Highs | Coldest Highs |
| 67 in 2005 | 13 in 2021 |
| 64 in 1984 | 28 in 2020 |
| 64 in 1972 | 28 in 2007 |
| 64 in 1961 | 31 in 2016 |
| 63 in 2024* | 31 in 1970 |
| Normal High: | 47 |
*Denotes a tie in previous year(s)
Cape Girardeau's warmest Valentine's Day occurred back in 2005 with a reading of 67 degrees. There have been 5 years where the high temperature failed to reach 32 degrees. This last occurred in 2021 when the high only made it up to 13 degrees.
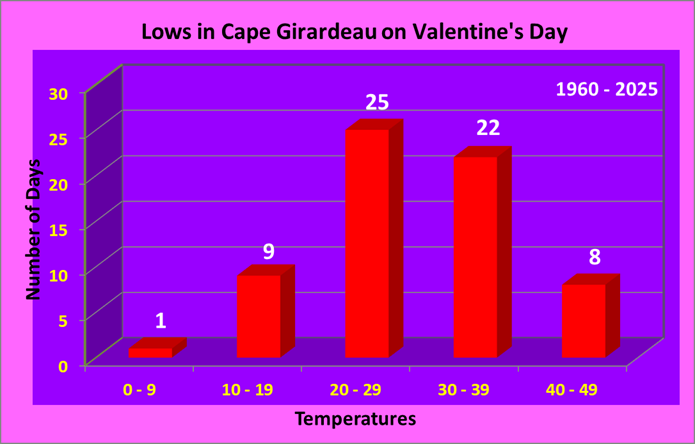
Low temperatures typically fall in the 20s or 30s, accounting for 77% of all years on record. There are always exceptions to the norm of course: in 2021 the low temperature dropped to a frigid 4 degrees, which is 1 of 10 years that lows have fallen below 20 degrees. There have been 8 years with lows in the 40s, most recently occurring in 2019.
| Warmest Lows | Coldest Lows |
| 48 in 2001 | 4 in 2021 |
| 47 in 2005 | 11 in 1971 |
| 44 in 2018 | 12 in 2020 |
| 43 in 2019 | 14 in 1986 |
| 43 in 1990 | 17 in 1968 |
| 43 in 1987 | 18 in 2015 |
| 18 in 1985 | |
| Normal Low: | 28 |
Measurable precipitation has fallen 33% of the time, with over an inch of precipitation falling on 2 different occasions, most recently in 2003.
| Wettest (inches) |
| 1.22 in 1995 |
| 1.05 in 2003 |
| 0.91 in 1992 |
| 0.63 in 1989 |
| 0.61 in 1970 |
Here is a look at the observed weather for the past 15 years:
| Recent Weather for Valentine's Day | |||
| Year | High | Low | Precip |
| 2011 | 57 | 32 | 0 |
| 2012 | 44 | 32 | 0.01 |
| 2013 | 62 | 35 | 0 |
| 2014 | 38 | 23 | 0.24 |
| 2015 | 46 | 18 | 0 |
| 2016 | 31 | 22 | 0.39 |
| 2017 | 50 | 37 | 0.07 |
| 2018 | 57 | 44 | 0.18 |
| 2019 | 54 | 43 | 0 |
| 2020 | 28 | 12 | 0 |
| 2021 | 13 | 4 | T |
| 2022 | 46 | 20 | 0 |
| 2023 | 58 | 38 | 0.13 |
| 2024 | 63 | 30 | 0 |
| 2025 | 38 | 19 | 0 |
Climate Data has been recorded at the Poplar Bluff Airport, located 4 miles east of Poplar Bluff, since December of 1997. Prior to that data was taken at the Poplar Bluff COOP station, located a half mile west of downtown. Data for the COOP station dates back to January 1893.
Valentine's Day is celebrated on February 14th every year.
Here is a look at high and low temperature frequencies and extremes as well as precipitation statistics for Valentine's Day in Poplar Bluff.
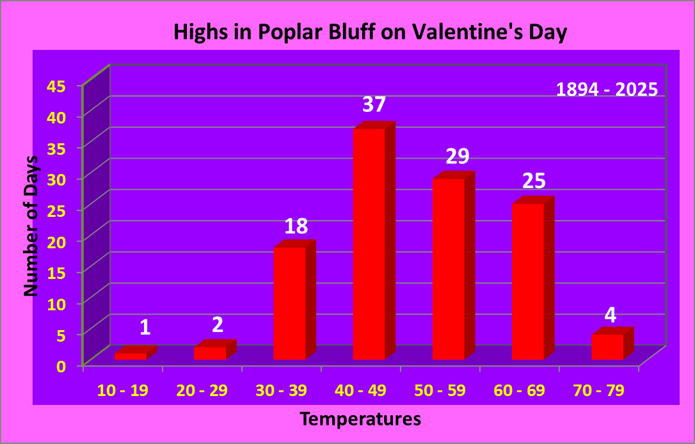
As seen by this graphic, high temperatures in the 40s are most common, accounting for 32% of all years on record. Highs in the 30s, 50s, and 60s are rather common as well.
| Warmest Highs | Coldest Highs |
| 76 in 1962 | 16 in 2021 |
| 76 in 1918 | 27 in 2020 |
| 70 in 1956 | 29 in 1916 |
| 70 in 1947 | 31 in 2016 |
| 69 in 2005* | 31 in 2007 |
| Normal High: | 49 |
*Denotes a tie in previous year(s)
Poplar Bluff has reached the 70s for high temperatures on 4 occasions, most recently back in 1962. Meanwhile, there have been 5 years where the high temperature failed to reach 32 degrees. This last occurred in 2021 when the high only made it up to 16!
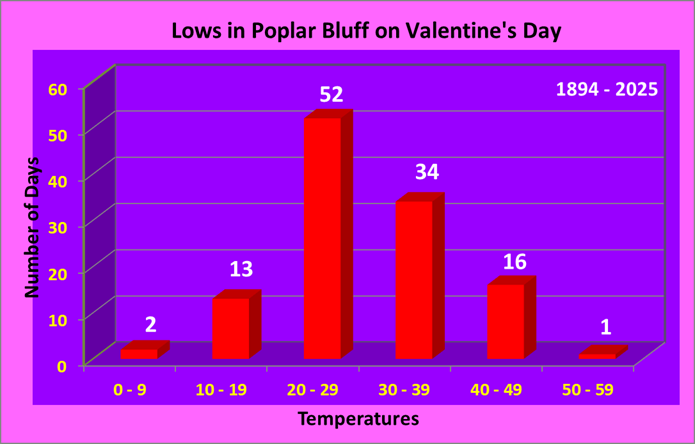
Low temperatures typically fall in the 20s or 30s, accounting for 73% of all years on record. There are always exceptions to the norm of course: in 1899 the low temperature dropped to a frigid 0 degrees, which is 1 of 2 years that lows have fallen below 10 degrees. Meanwhile, the warmest low was 54 degrees back in 1954, which is the only year with lows remaining above 50.
| Warmest Lows | Coldest Lows |
| 54 in 1954 | 0 in 1899 |
| 49 in 2001 | 7 in 2021 |
| 47 in 1935 | 10 in 1980 |
| 46 in 2005 | 10 in 1929 |
| 46 in 1990 | 10 in 1895 |
| Normal Low: | 31 |
Measurable precipitation has fallen 32% of the time, with over an inch of precipitation falling on 3 different occasions, most recently in 2003.
| Wettest (inches) |
| 3.61 in 1989 |
| 3.50 in 1949 |
| 1.28 in 2003 |
| 0.90 in 1893 |
| 0.88 in 1946 |
Here is a look at the observed weather for the past 15 years:
| Recent Weather for Valentine's Day | |||
| Year | High | Low | Precip |
| 2011 | 62 | 32 | 0 |
| 2012 | 46 | 33 | 0.04 |
| 2013 | 65 | 37 | 0 |
| 2014 | 44 | 27 | 0.31 |
| 2015 | 57 | 20 | 0 |
| 2016 | 31 | 25 | 0.24 |
| 2017 | 47 | 38 | 0.58 |
| 2018 | 58 | 43 | 0.09 |
| 2019 | 56 | 45 | 0 |
| 2020 | 27 | 13 | 0 |
| 2021 | 16 | 7 | 0.06 |
| 2022 | 47 | 22 | 0 |
| 2023 | 56 | 40 | 0.23 |
| 2024 | 62 | 33 | 0 |
| 2025 | 36 | 25 | 0.01 |
Climate Data has been recorded at Southern Illinois Airport, located 4 miles northwest of Carbondale, since August of 1998. Prior to that data was taken at the Carbondale Sewage Plant COOP station, located 3 miles east of Carbondale. Data for the COOP station dates back to November 1898.
Valentine's Day is celebrated on February 14th every year.
Here is a look at high and low temperature frequencies and extremes as well as precipitation statistics for Valentine's Day in Carbondale
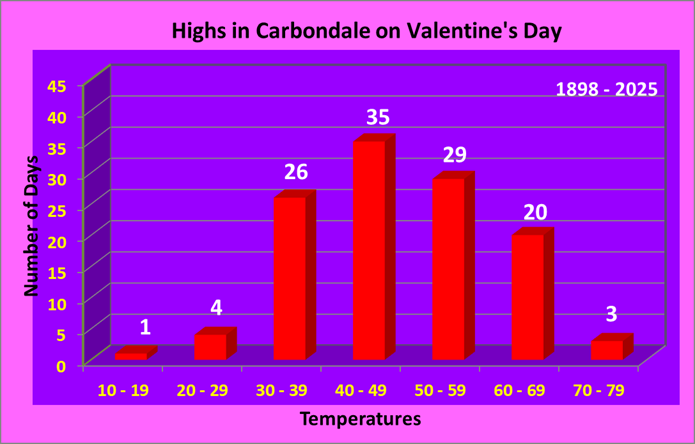
As seen by this graphic, high temperatures in the 40s are most common, accounting for 30% of all years on record. Highs in the 30s, 50s, and 60s are rather common as well.
| Warmest Highs | Coldest Highs |
| 77 in 1921 | 11 in 2021 |
| 74 in 1962 | 21 in 1943 |
| 74 in 1918 | 25 in 2007 |
| 69 in 1934 | 26 in 2020 |
| 68 in 1935* | 28 in 2016 |
| Normal High: | 47 |
*Denotes a tie in previous year(s)
Carbondale has observed highs in the 70s on 3 occasions, most recently in 1962. There have been 9 years where the high temperature failed to reach 32 degrees. This last occurred in 2021 when the high only made it up to 11 degrees.
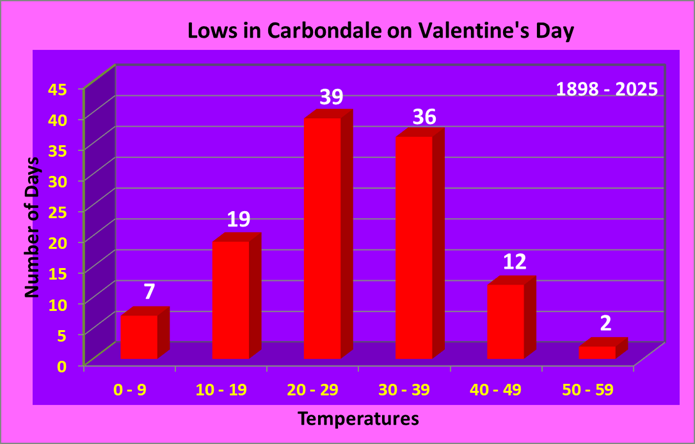
Low temperatures typically fall in the 20s or 30s, accounting for 65% of all years on record. There are always exceptions to the norm of course: in 2021 the low temperature dropped to a frigid 2 degrees, which is 1 of 7 years that lows have fallen into the single digits. Meanwhile, there have been 2 years with lows in the 50s, way back in 1918 and 1911.
| Warmest Lows | Coldest Lows |
| 53 in 1918 | 2 in 2021 |
| 52 in 1911 | 3 in 1899 |
| 49 in 2005 | 5 in 1982 |
| 49 in 1954 | 6 in 1943 |
| 49 in 1935 | 7 in 1980* |
| Normal Low: | 28 |
Measurable precipitation has fallen 31% of the time, with over an inch of precipitation falling on 2 different occasions, back in 1989 and 1949.
| Wettest (inches) |
| 1.48 in 1989 |
| 1.20 in 1949 |
| 0.86 in 1987 |
| 0.68 in 2003 |
| 0.48 in 1959 |
Here is a look at the observed weather for the past 15 years:
| Recent Weather for Valentine's Day | |||
| Year | High | Low | Precip |
| 2011 | 54 | 32 | 0 |
| 2012 | 43 | 32 | T |
| 2013 | 61 | 35 | 0 |
| 2014 | 39 | 20 | 0.16 |
| 2015 | 42 | 14 | 0 |
| 2016 | 28 | 21 | 0.13 |
| 2017 | 51 | 36 | T |
| 2018 | 57 | M | M |
| 2019 | 54 | 45 | 0 |
| 2020 | 26 | 9 | 0 |
| 2021 | 11 | 2 | T |
| 2022 | 46 | 17 | 0 |
| 2023 | 60 | 36 | 0.04 |
| 2024 | 64 | 36 | 0 |
| 2025 | 38 | 17 | 0 |

