July 2025 Climate Review:
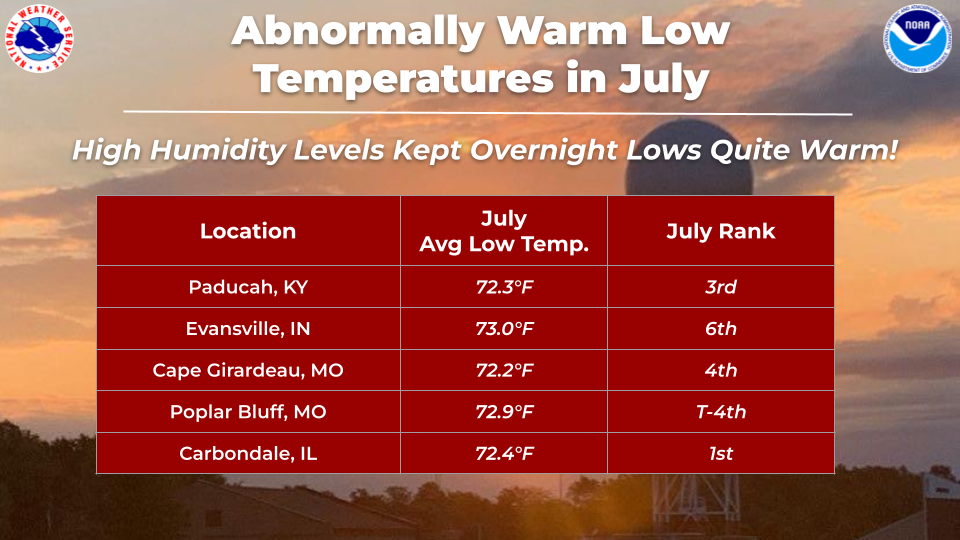
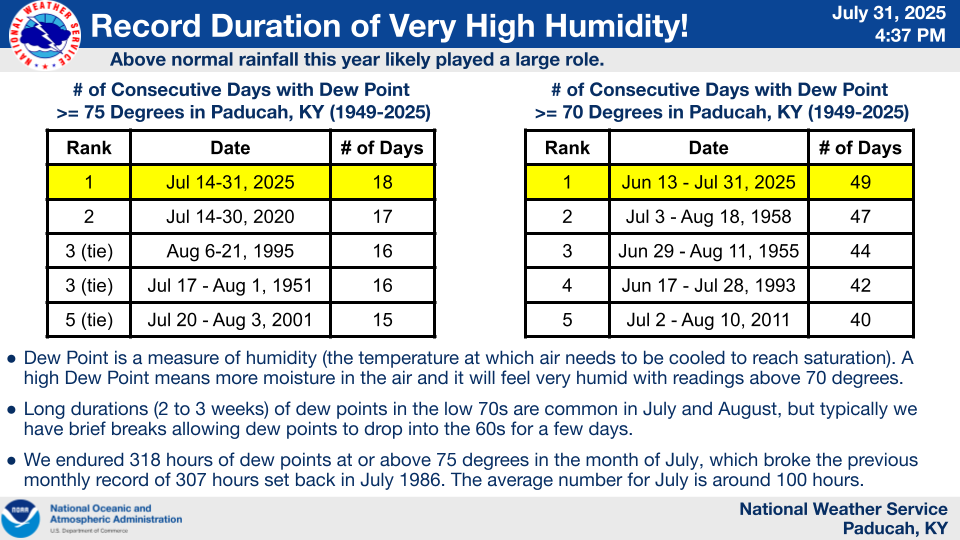
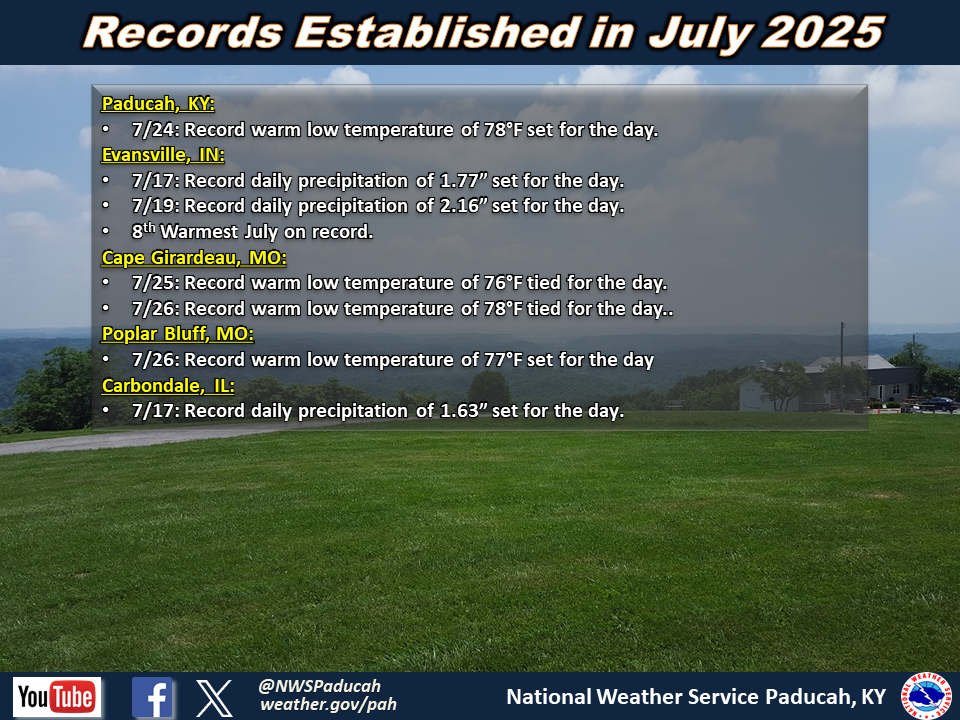
Temperatures averaged above normal by 1.5 to 3.5 degrees. The coolest low temperatures of the month occurred between the 2nd and 4th when readings dipped down into the mid to upper 60s. The coolest high temperatures were from the 7th through 9th when many areas only reached the low to mid 80s due to an abundance of clouds and precipitation around. The 2nd half of the month was brutal with dangerous heat and humidity. Highs were routinely above 90, and even into the mid 90s on several occasions. Humidity levels were very high with dewpoints ranging from the mid 70s to low 80s most of the last 15 days of the month. This resulted in daily heat index readings reaching between 100 and 115 degrees. The peak of the heat wave was on the 28th with widespread readings of 110 to 120. Evansville observed their 8th warmest July on record (warmest since 2012). Low temperatures were particularly elevated due to the high humidity levels. Evansville experienced their 3rd warmest average low temperatures for the month of July. 28 days experienced a low temperature above 70 degrees in Evansville, which was 1 shy of the all-time July record of 29 days set in 1921. The other 4 climate stations also finished in their top 6 warmest for low temperatures. Several sites observed their longest stretches of 100+ heat index in 25-30+ years, reaching this threshold for over 15 days in a row. Paducah reached 100+ on 16 straight days, their longest streak since 1993. Paducah established their longest streak of consecutive days with a 75 degree dew point on record, reaching that threshold on 18 straight days between the 14th and 31st (previous record was 17 days). We also broke the longest streak of consecutive days with a 70 degree dew point, registering 49 days between June 13th and July 31st (previous record was 47 days).
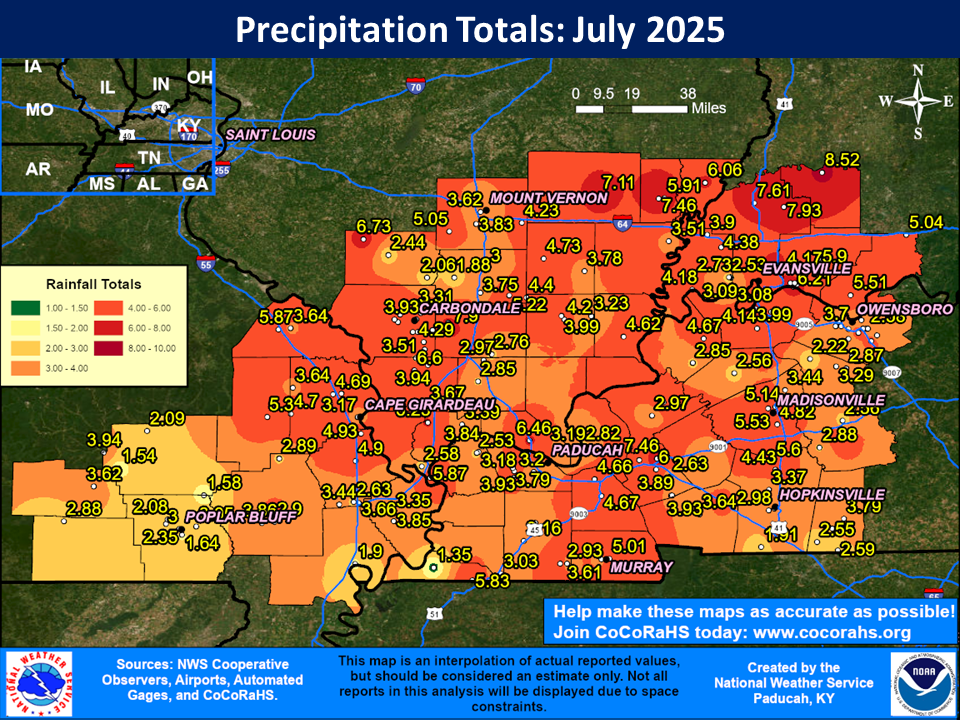
Precipitation was largely wetter than normal across the northern half of the region including much of southern Illinois, southwest Indiana, and northwest Kentucky. Meanwhile, much of the southern half of our region finished drier than normal which included much of southeast Missouri and areas of western Kentucky. Amounts ranged from 2 to 7” across much of our area. Rainfall was harder to come by during the last 1 to 2 weeks of the month, especially across the southern part of our region. The highest observed amount was 8.52” at a CoCoRaHS station 1.4 miles ENE of Petersburg, IN. Above normal soil moisture from a wet June/Spring likely was a key component in keeping our humidity levels elevated during the month, despite precipitation being varied across the region in July.
The graphic below is an interpolated monthly rainfall map using actual observations. Please note that there are likely discrepancies in between observations, since the values are estimated based on nearest reports.
| July 2025 Review: Precipitation and Temperature Maps (Click on image to enlarge) |
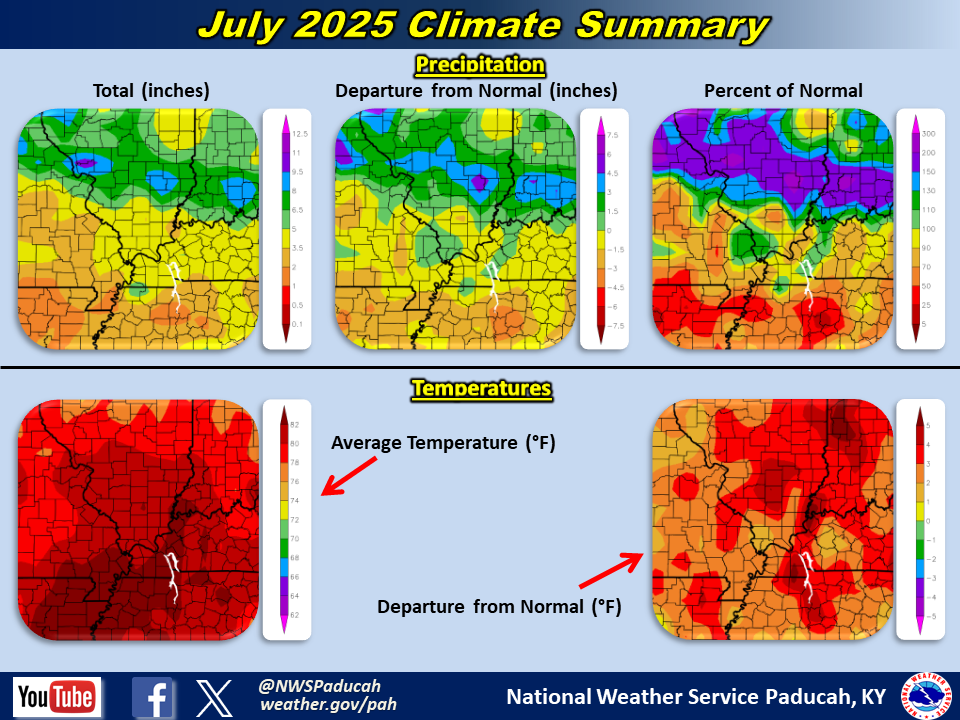 |
| Climate Maps are from the Northeast Regional Climate Center |
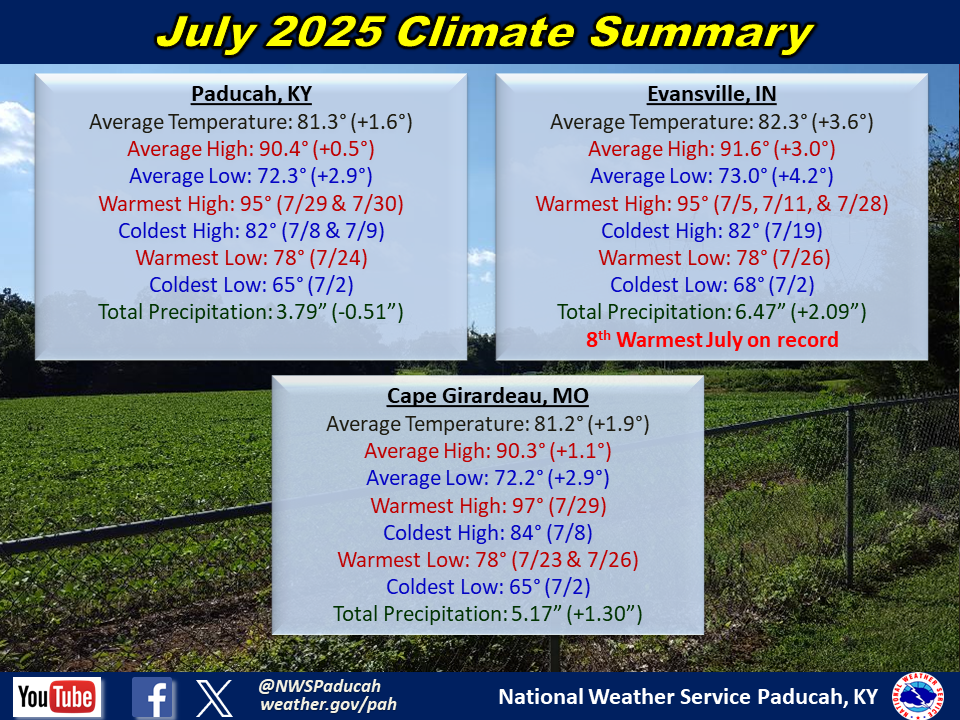
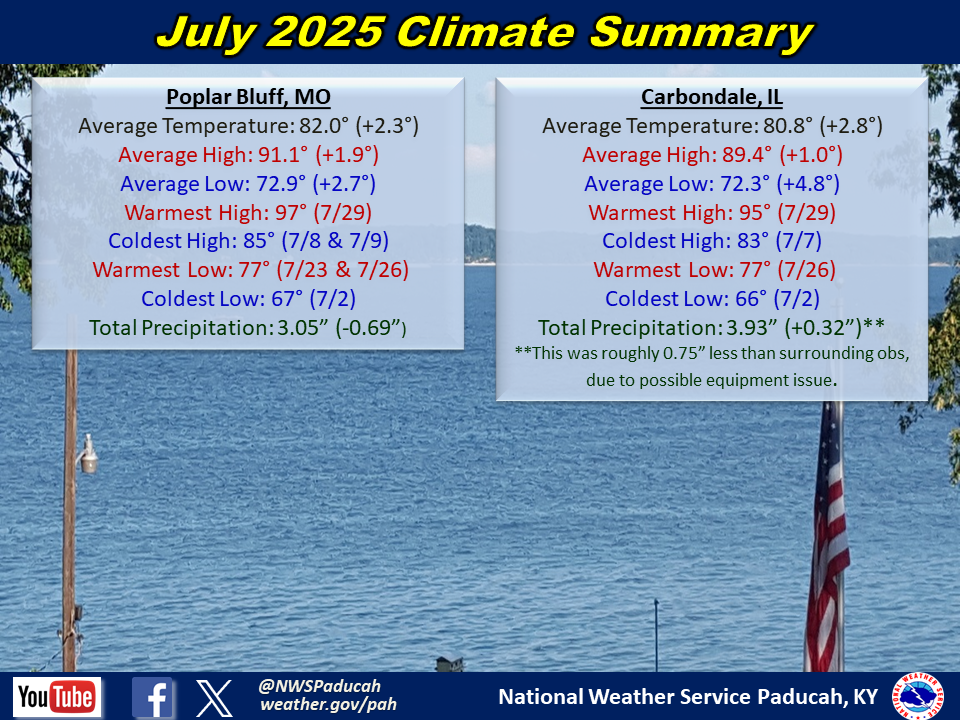
Monthly Climate Report: Paducah | Evansville | Cape Girardeau | Poplar Bluff | Carbondale