Monsoon 2019 Review for the Southwest U.S.
Compiled by NOAA/NWS Weather Forecast Offices (WFOs) Phoenix, AZ, Albuquerque, NM, El Paso, TX, Flagstaff, AZ,
Las Vegas, NV, and Tucson, AZ, CLIMAS, the Arizona State Climate Office, and the New Mexico Climate Center
Overview
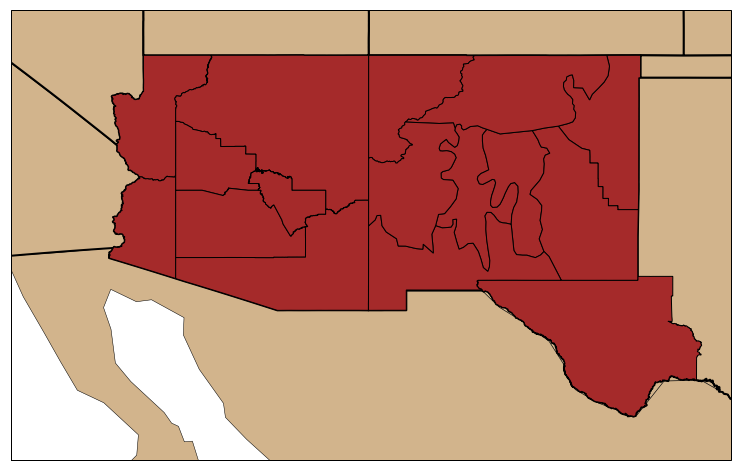
For the Southwest US (here defined as Arizona, New Mexico, and far west Texas, see Figure 1), Monsoon 2019 will go down as one of the hottest and driest on record. Based on monthly data (Jun-Sep) from the NOAA National Centers for Environmental Information (NCEI), this was the 9th driest (Figure 2) and 3rd hottest (Figure 3) Monsoon for the Southwest, with records dating back to 1895. Rankings for select individual locations can be found in Table 1. An unfavorable mid-level weather pattern (partially caused by the waning influences of El Niño), a decrease in tropical storm activity, and lack of northward moisture intrusions, all combined to make this one of the driest Monsoons on record.
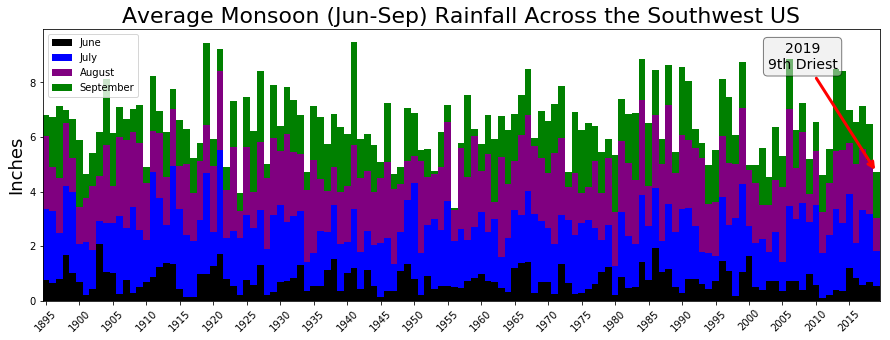
Fig. 2. Average Monsoon (Jun-Sep) rainfall across the Southwest, displayed by month.
his year ranked as the 9th driest on record (since 1895).
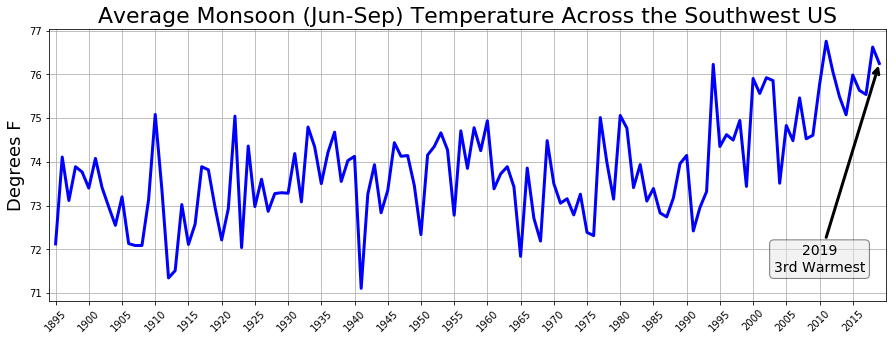
Fig. 3. Average Monsoon (Jun-Sep) temperature across the Southwest.
This year ranked as the 3rd warmest on record (since 1895).
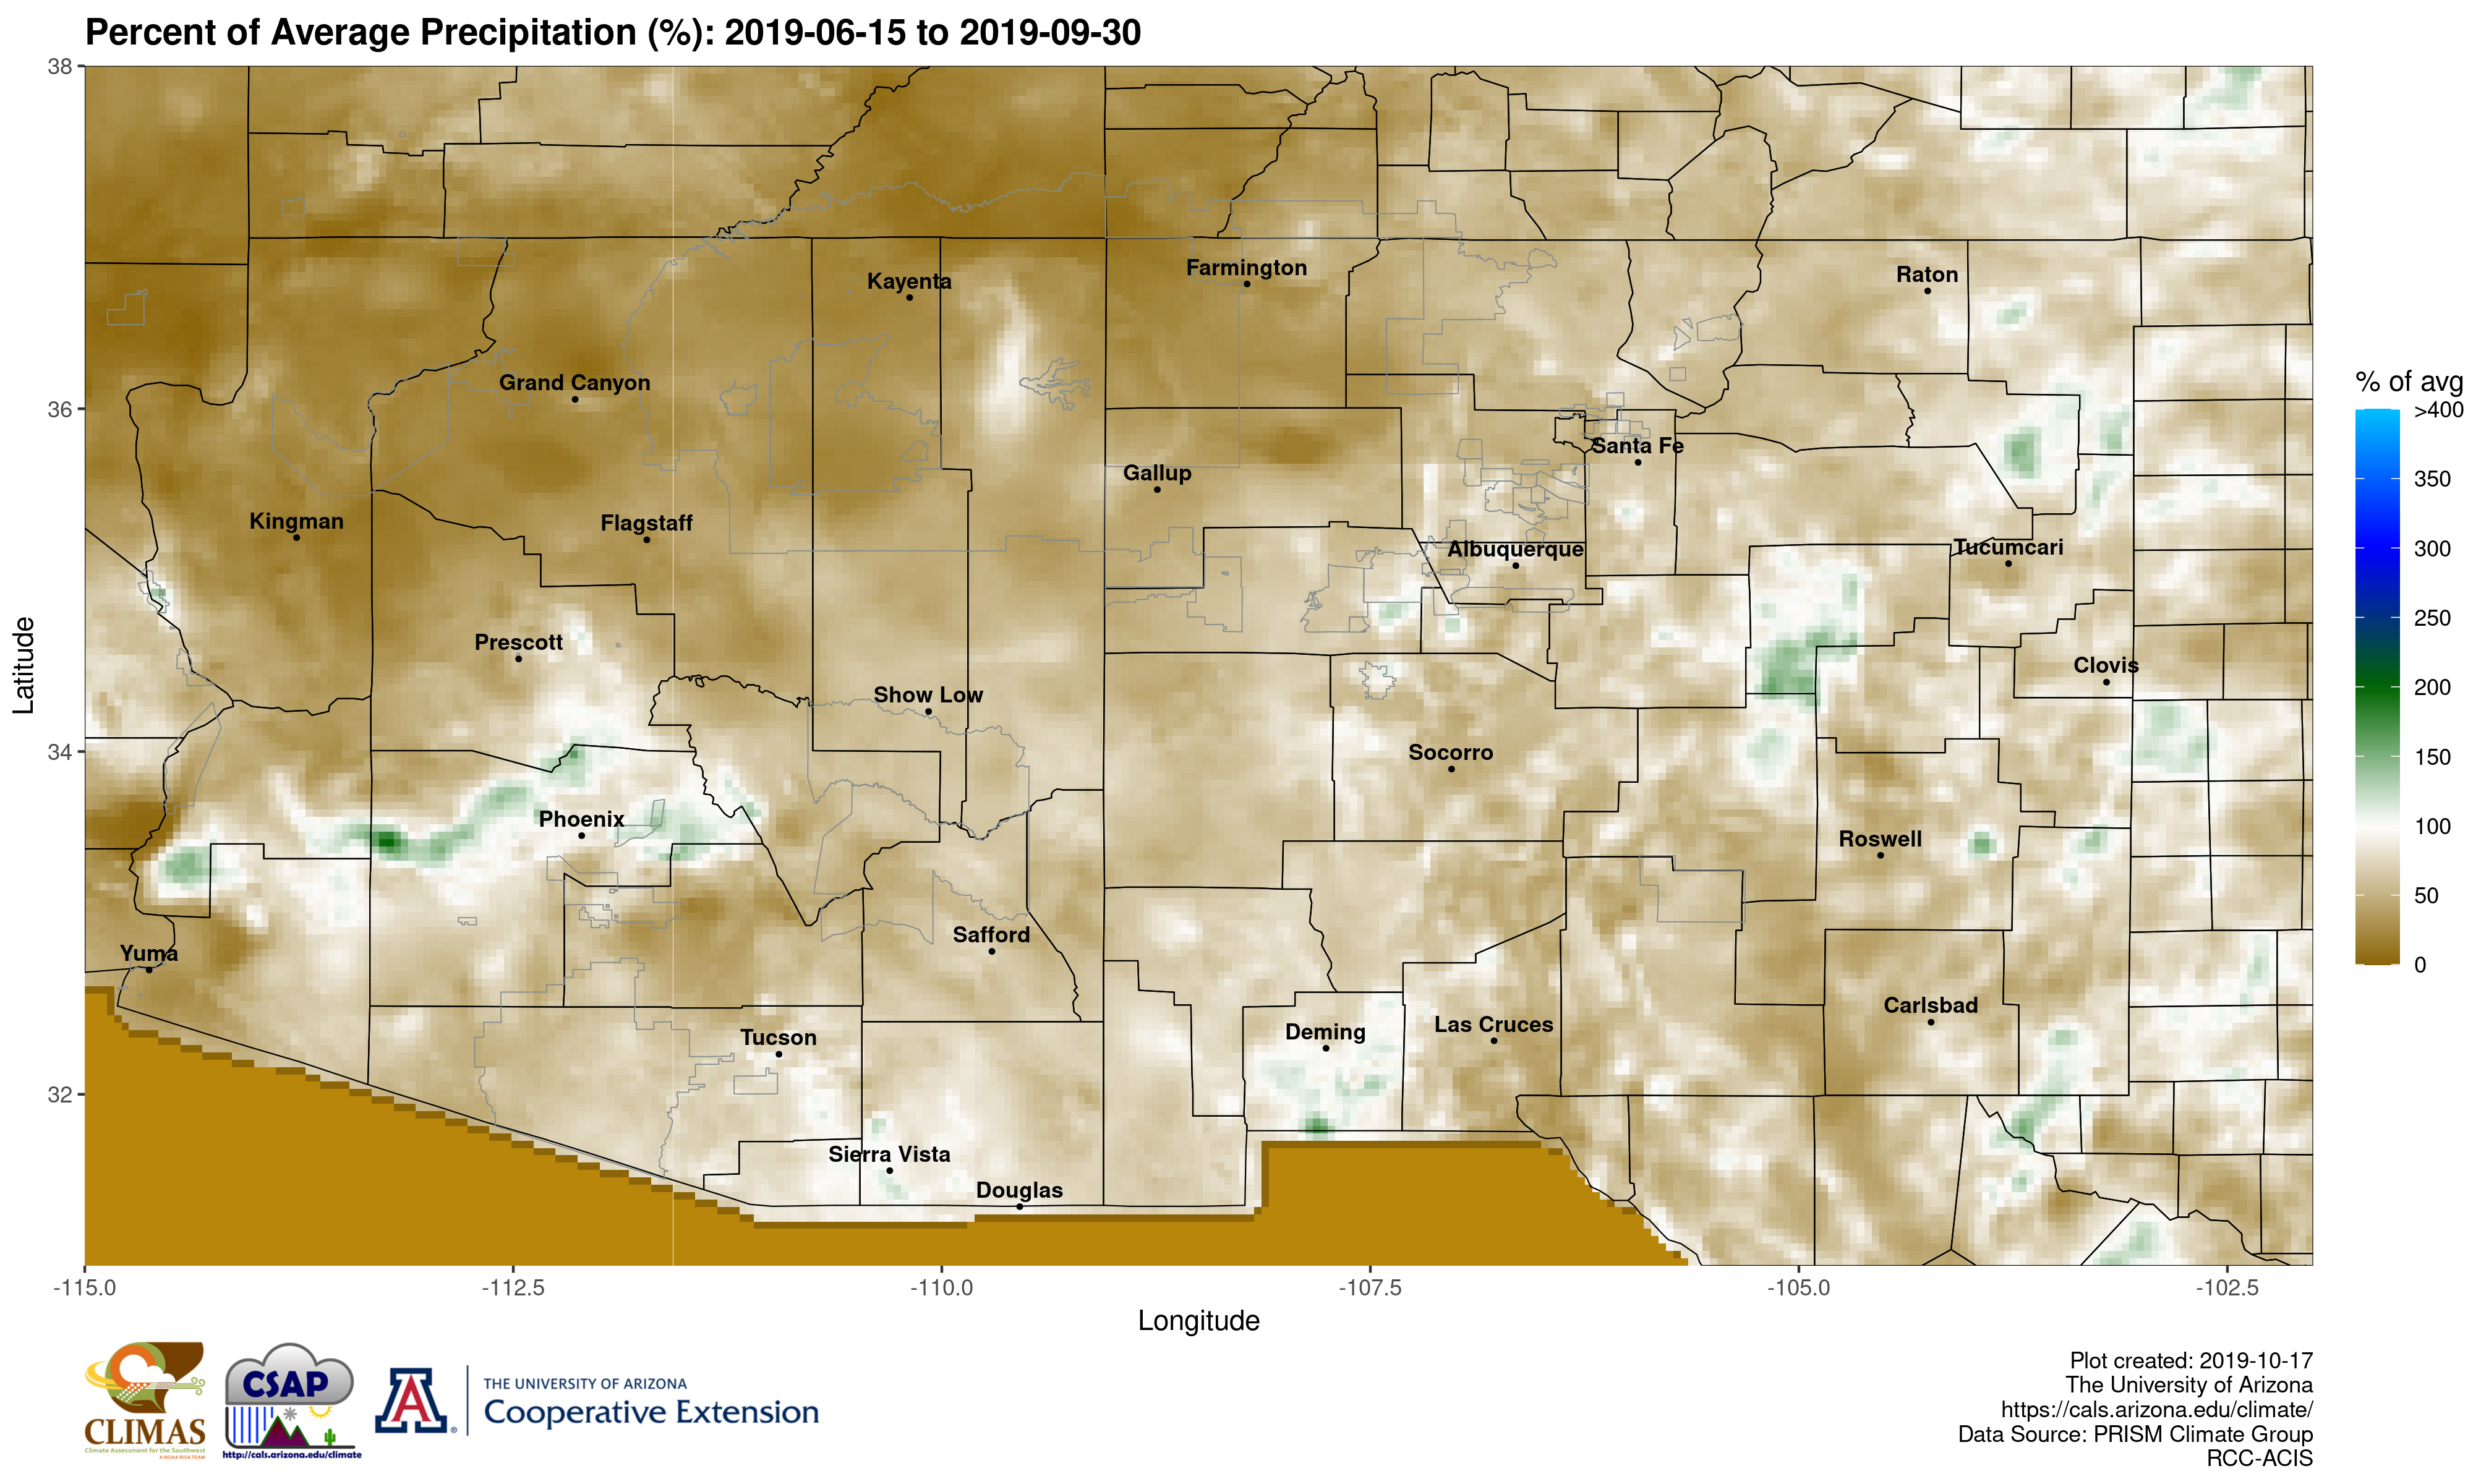
Fig. 4. Percent of average precipitation across the Southwest for Monsoon 2019 (Jun. 15 to Sep. 30
in this specific graphic). Only a few pockets of above average rain were observed across the region,
with the most anomalous just outside the Phoenix area and in New Mexico between Albuquerque and Roswell.
Causes for the Monsoon 2019 Weather Pattern
The overall lack of rainfall was due to several factors. Coming into the monsoon (May-Jun), the weather pattern featured an unusually persistent trough over the Western U.S. (Figure 5), likely due to waning influence from the previous El Niño episode, which caused winds to remain from the west in the middle parts of the atmosphere. This pattern typically means seasonable temperatures and very dry air. It also suppresses the typical monsoon ridge from developing northward from Mexico, which while beneficially keeping temperatures from reaching exceptionally high levels, also does not allow the large scale monsoon circulation to effectively develop. In turn, moisture from nearby sources such as the Gulf of California, the Gulf of Mexico, and evapotranspiration cycles from the Sierra Madre Occidental, does not flow northward into the Southwest.
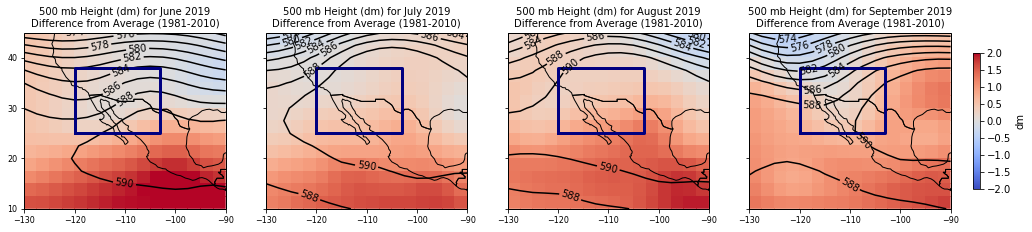
Fig. 5. Monthly average 500 mb height (contours, dm) and departure from average (shaded, standardized anomalies in dm based on 1981-2010) for June, July, August, and September 2019 broadly across the US/Mexico region.
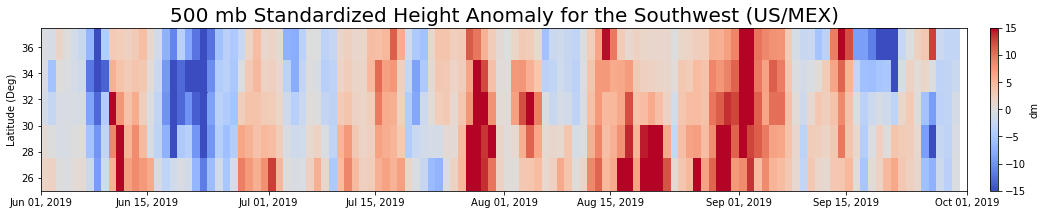
Fig. 6. Daily 500 mb standardized height anomaly for the Southwest (between 120° W and 103° W) averaged by latitude. Arizona and New Mexico are generally between 30° N and 38° N. Persistent troughing (blue shading) can be seen at higher latitudes, over AZ/NM, well into late July, with more persistent ridging (red shading) from late July into early September. Troughing returned by mid September.
The troughing over the Western U.S. began to subside by late July, with a more typical monsoon flow pattern developing (Figure 6). However, thunderstorm activity remained suppressed across northern Mexico, which is another key driver in forcing moisture across the international border. This was possibly partially due to a feedback loop induced by the earlier lack of rain, along with cooler than usual sea surface temperatures near the Gulf of California (Figure 7).
Fig. 7. Sea surface temperature anomalies along the equator, centered on the Americas, in mid July.
Note the area of cooler than usual water (blue shading) off the California and Baja California coast.
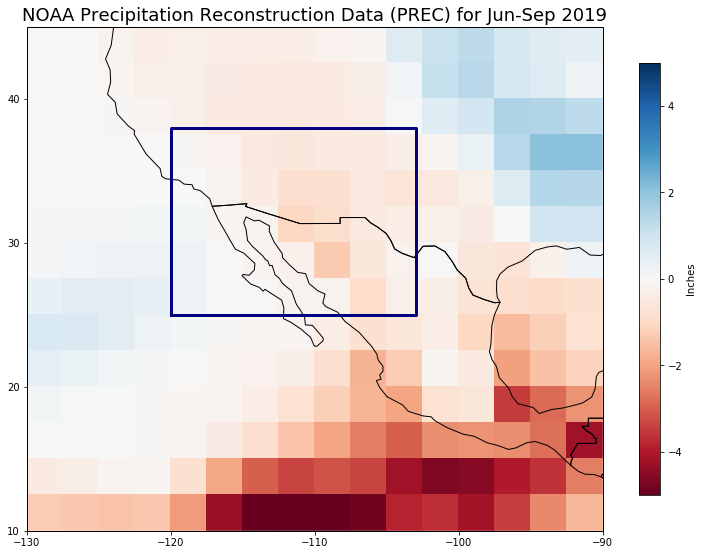
Fig.8. Precipitation anomalies for much of the southwestern U.S. and central/northern Mexico.
Significant negative (drier than usual, red shading) anomalies are seen at lower latitudes.
Despite the fact that the Southwest was impacted by the decaying remains of several tropical systems, overall tropical cyclone activity in the East Pacific was below normal in 2019. As of October 17, 2019, the accumulated cyclone energy (ACE), a measure of tropical cyclone activity in a given ocean basin, for the Northeast Pacific Ocean was 95.3. While the full tropical season is not over, this would be one of the lowest values in the past several years. This lack of tropical activity is reflected in precipitation anomalies across the southern portion of North America for Jun-Sep (Figure 9).
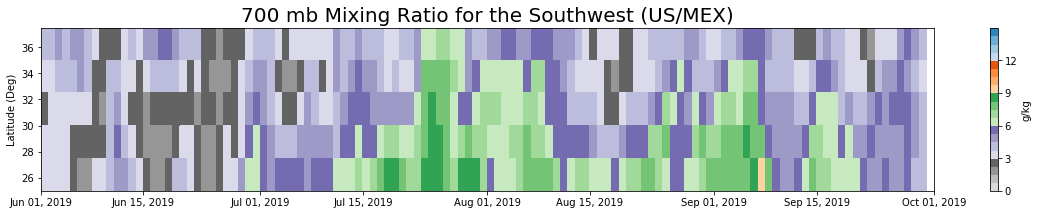
Fig. 9. Daily 700 mb mixing ratio for the Southwest (between 120° W and 103° W) averaged by latitude. Arizona and New Mexico are generally between 30° N and 38° N. Deep intrusions of moisture (green shading) did not extend north of 30° N until late July and then only persisted into early August. Three additional pushes are noted in late August and September, though none making into above 34° N.
This, combined with the unfavorable mid-level weather patterns, prohibited deep intrusions of moisture from pushing north from central Mexico and into the Southwest US (Figure 9). A time series of longitude-averaged plots of mixing ratio at 700 mb clearly shows a lack of significant moisture moving into northern latitudes of the Southwest. The deepest push came in late July and persisted through early August. This was coincident with the most widespread rainfall (Figure 10). Significant drying took place through mid August due to another push of troughing resulting in little rainfall (Figures 6, 9, and 10).
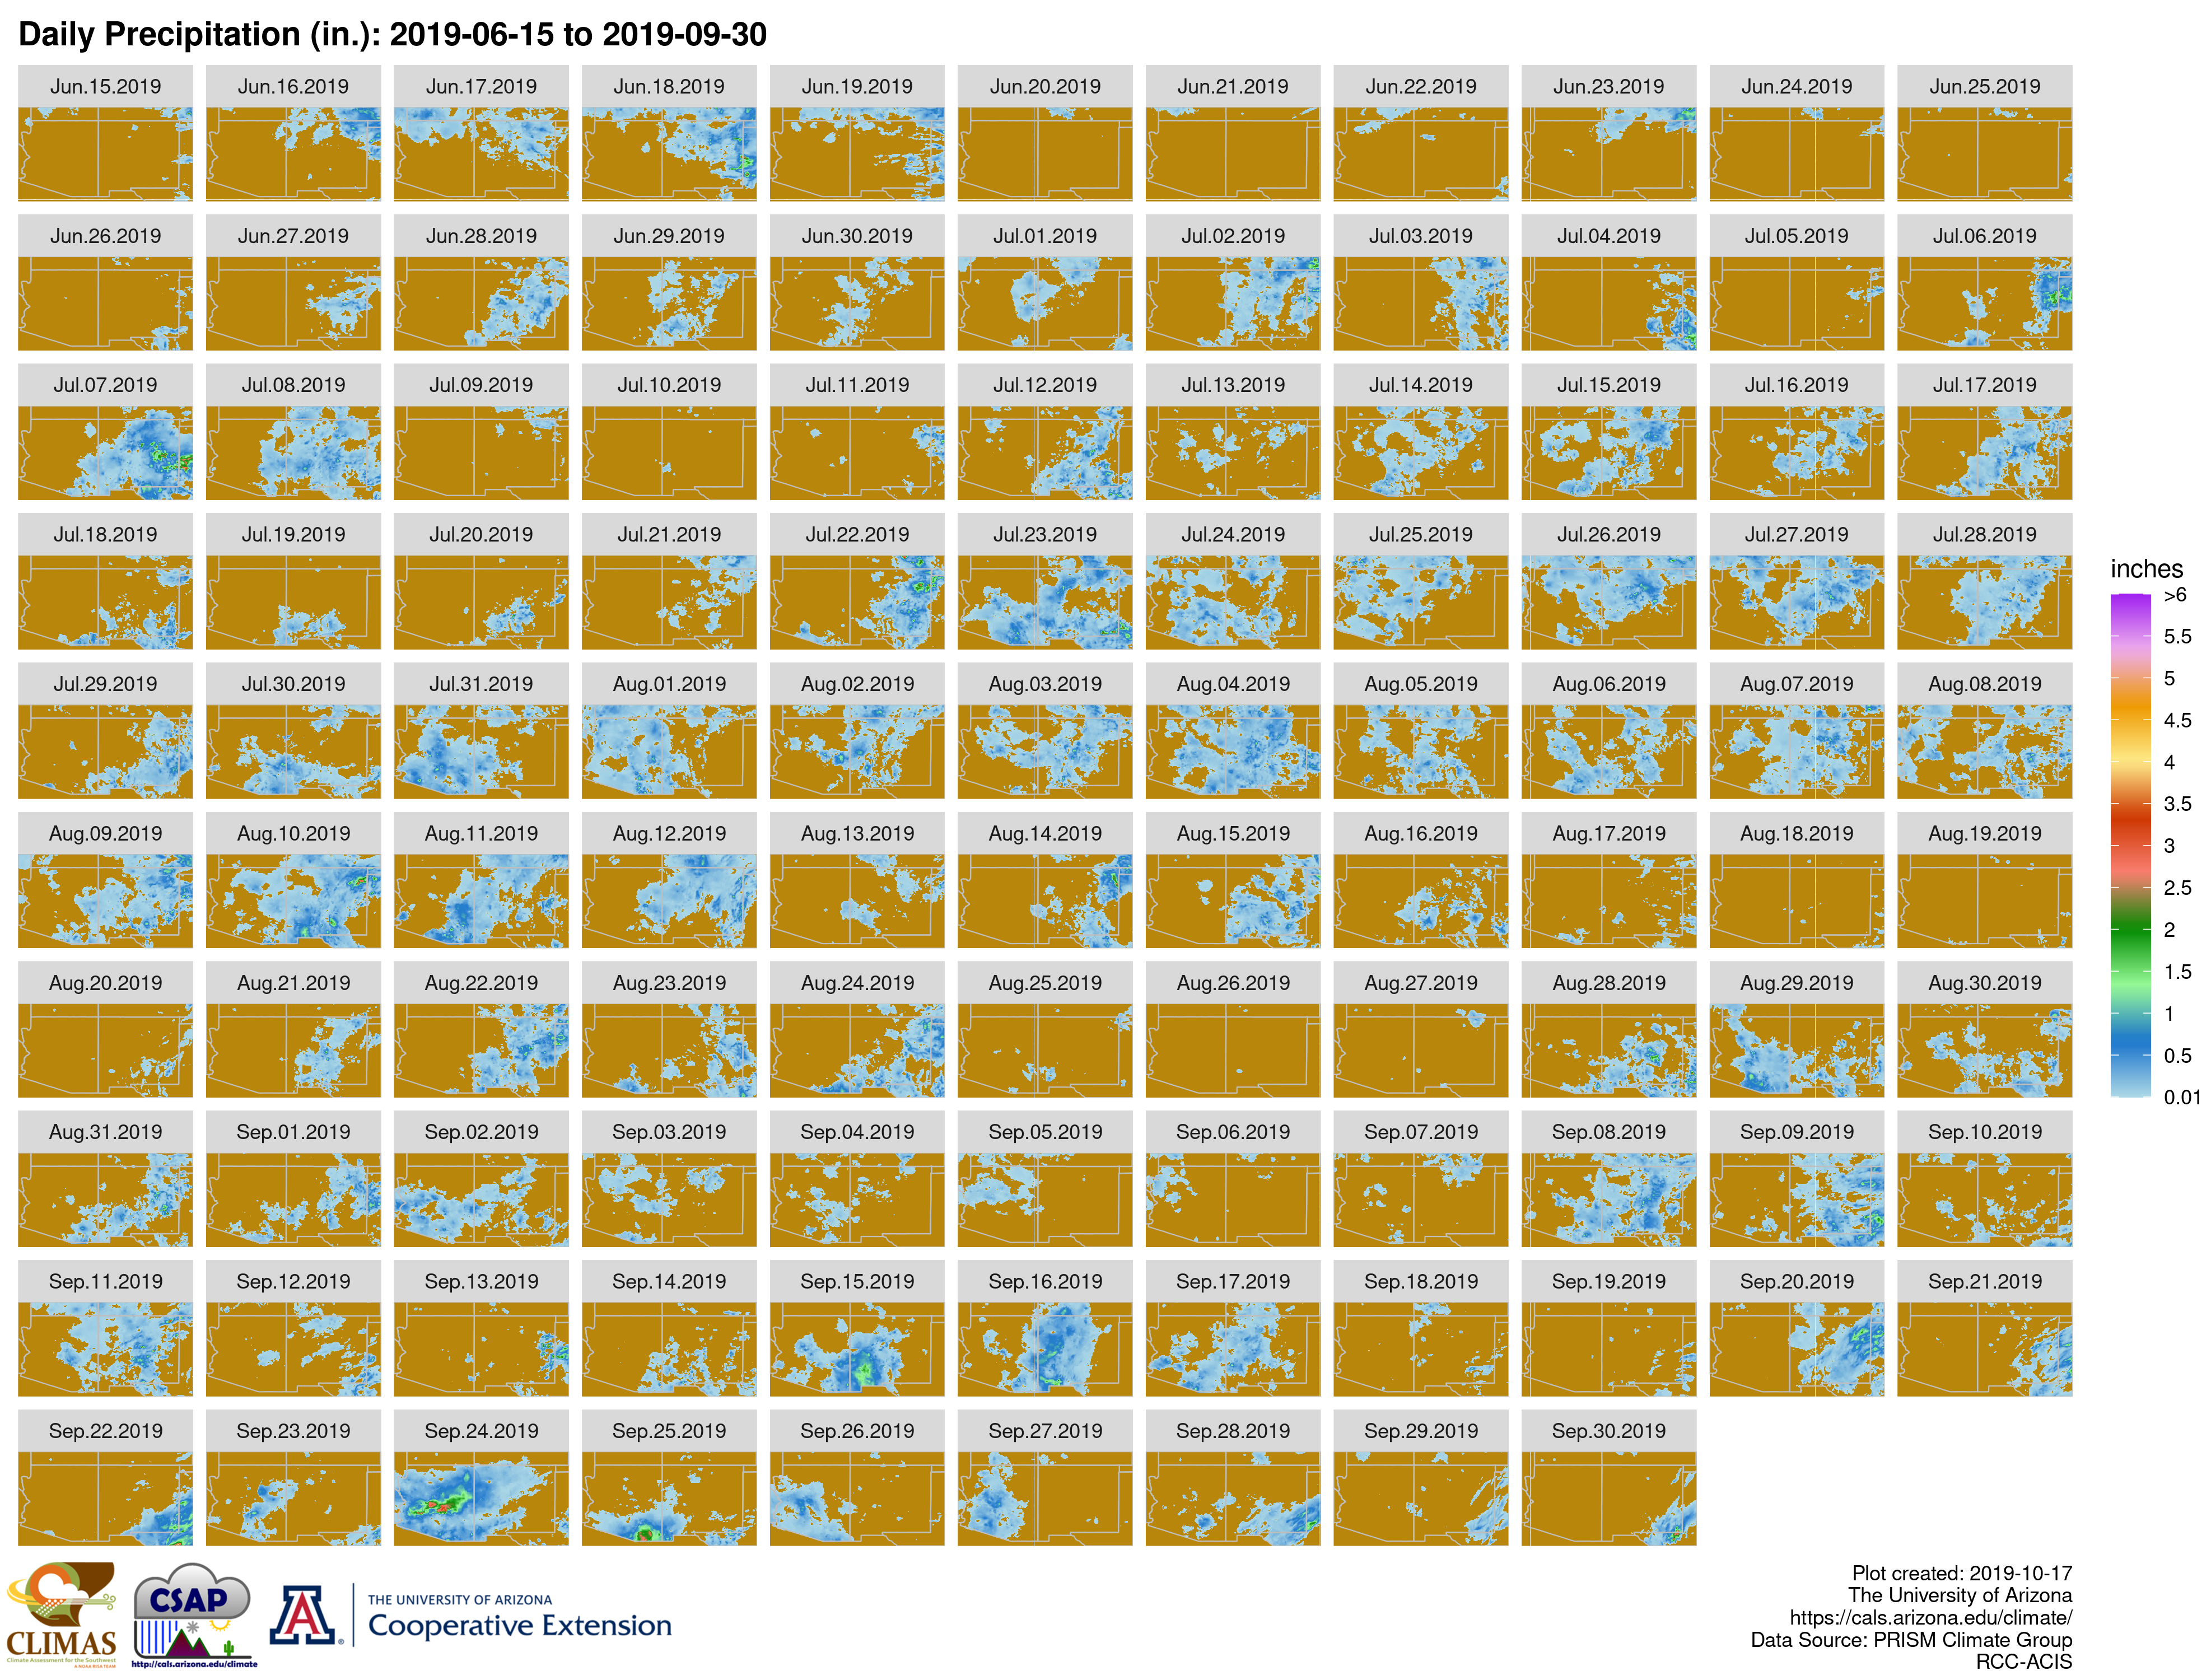
Fig. 10. Daily precipitation across the Southwest during Monsoon 2019.
 |
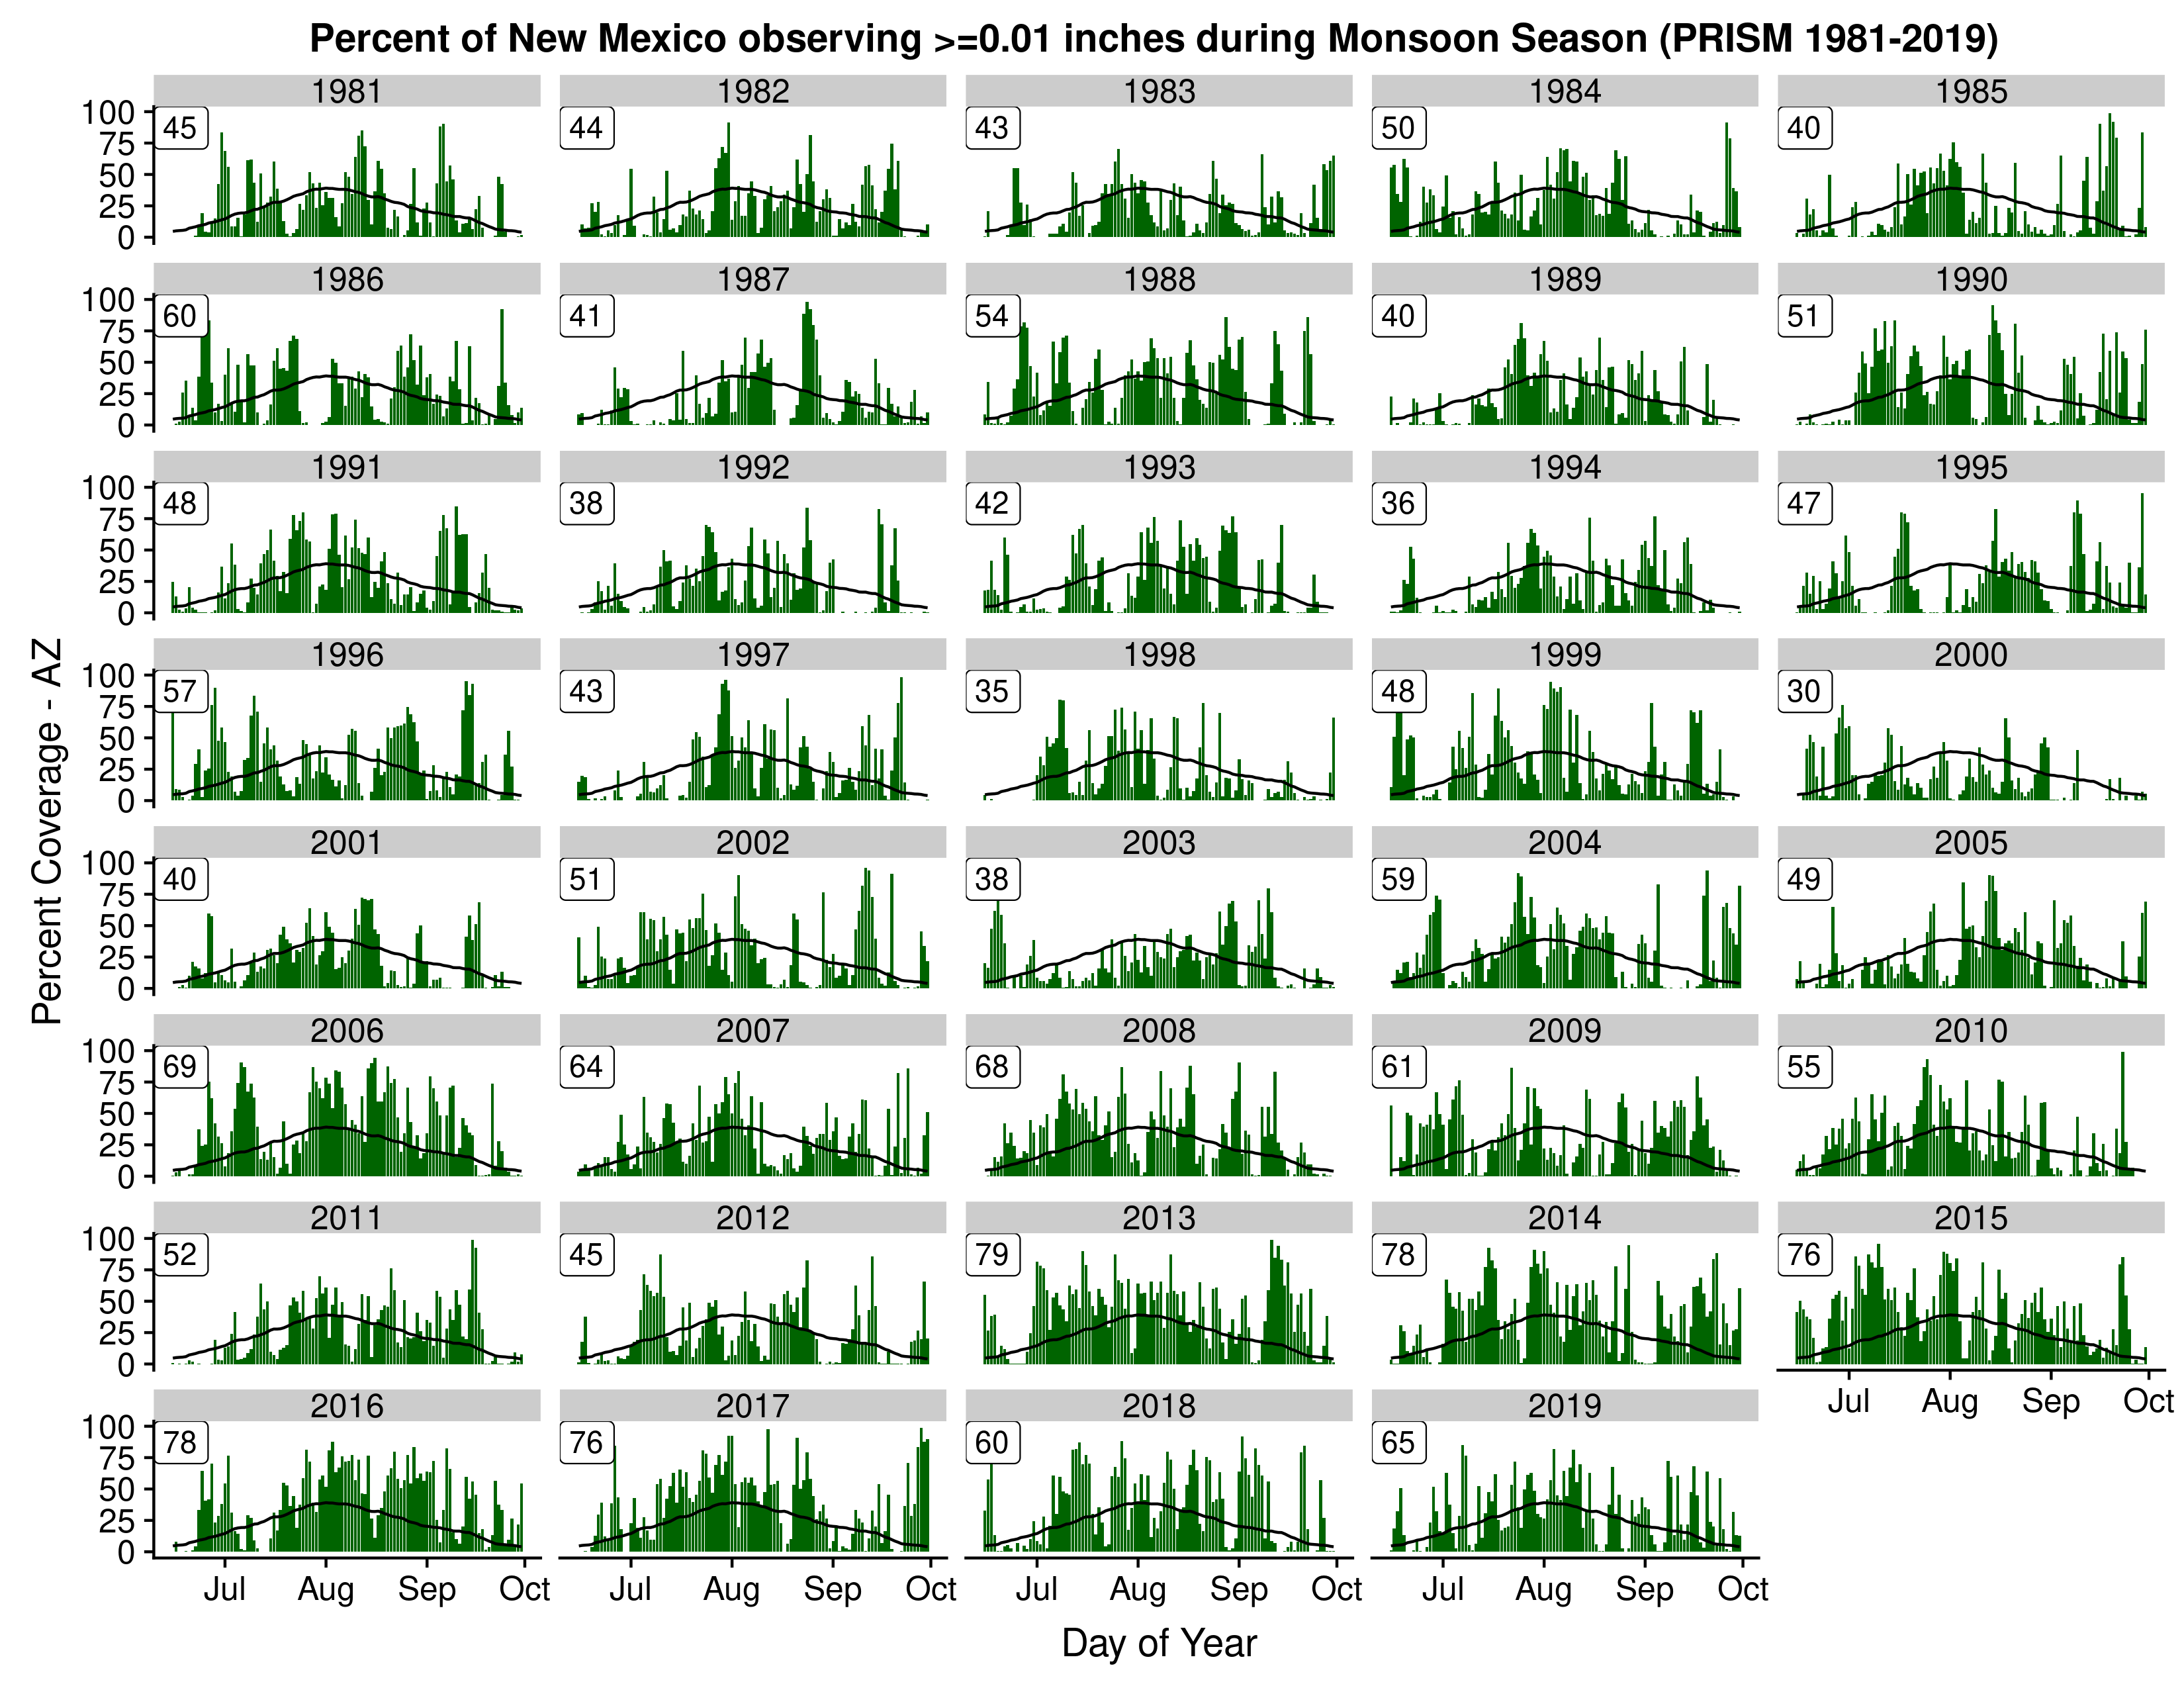 |
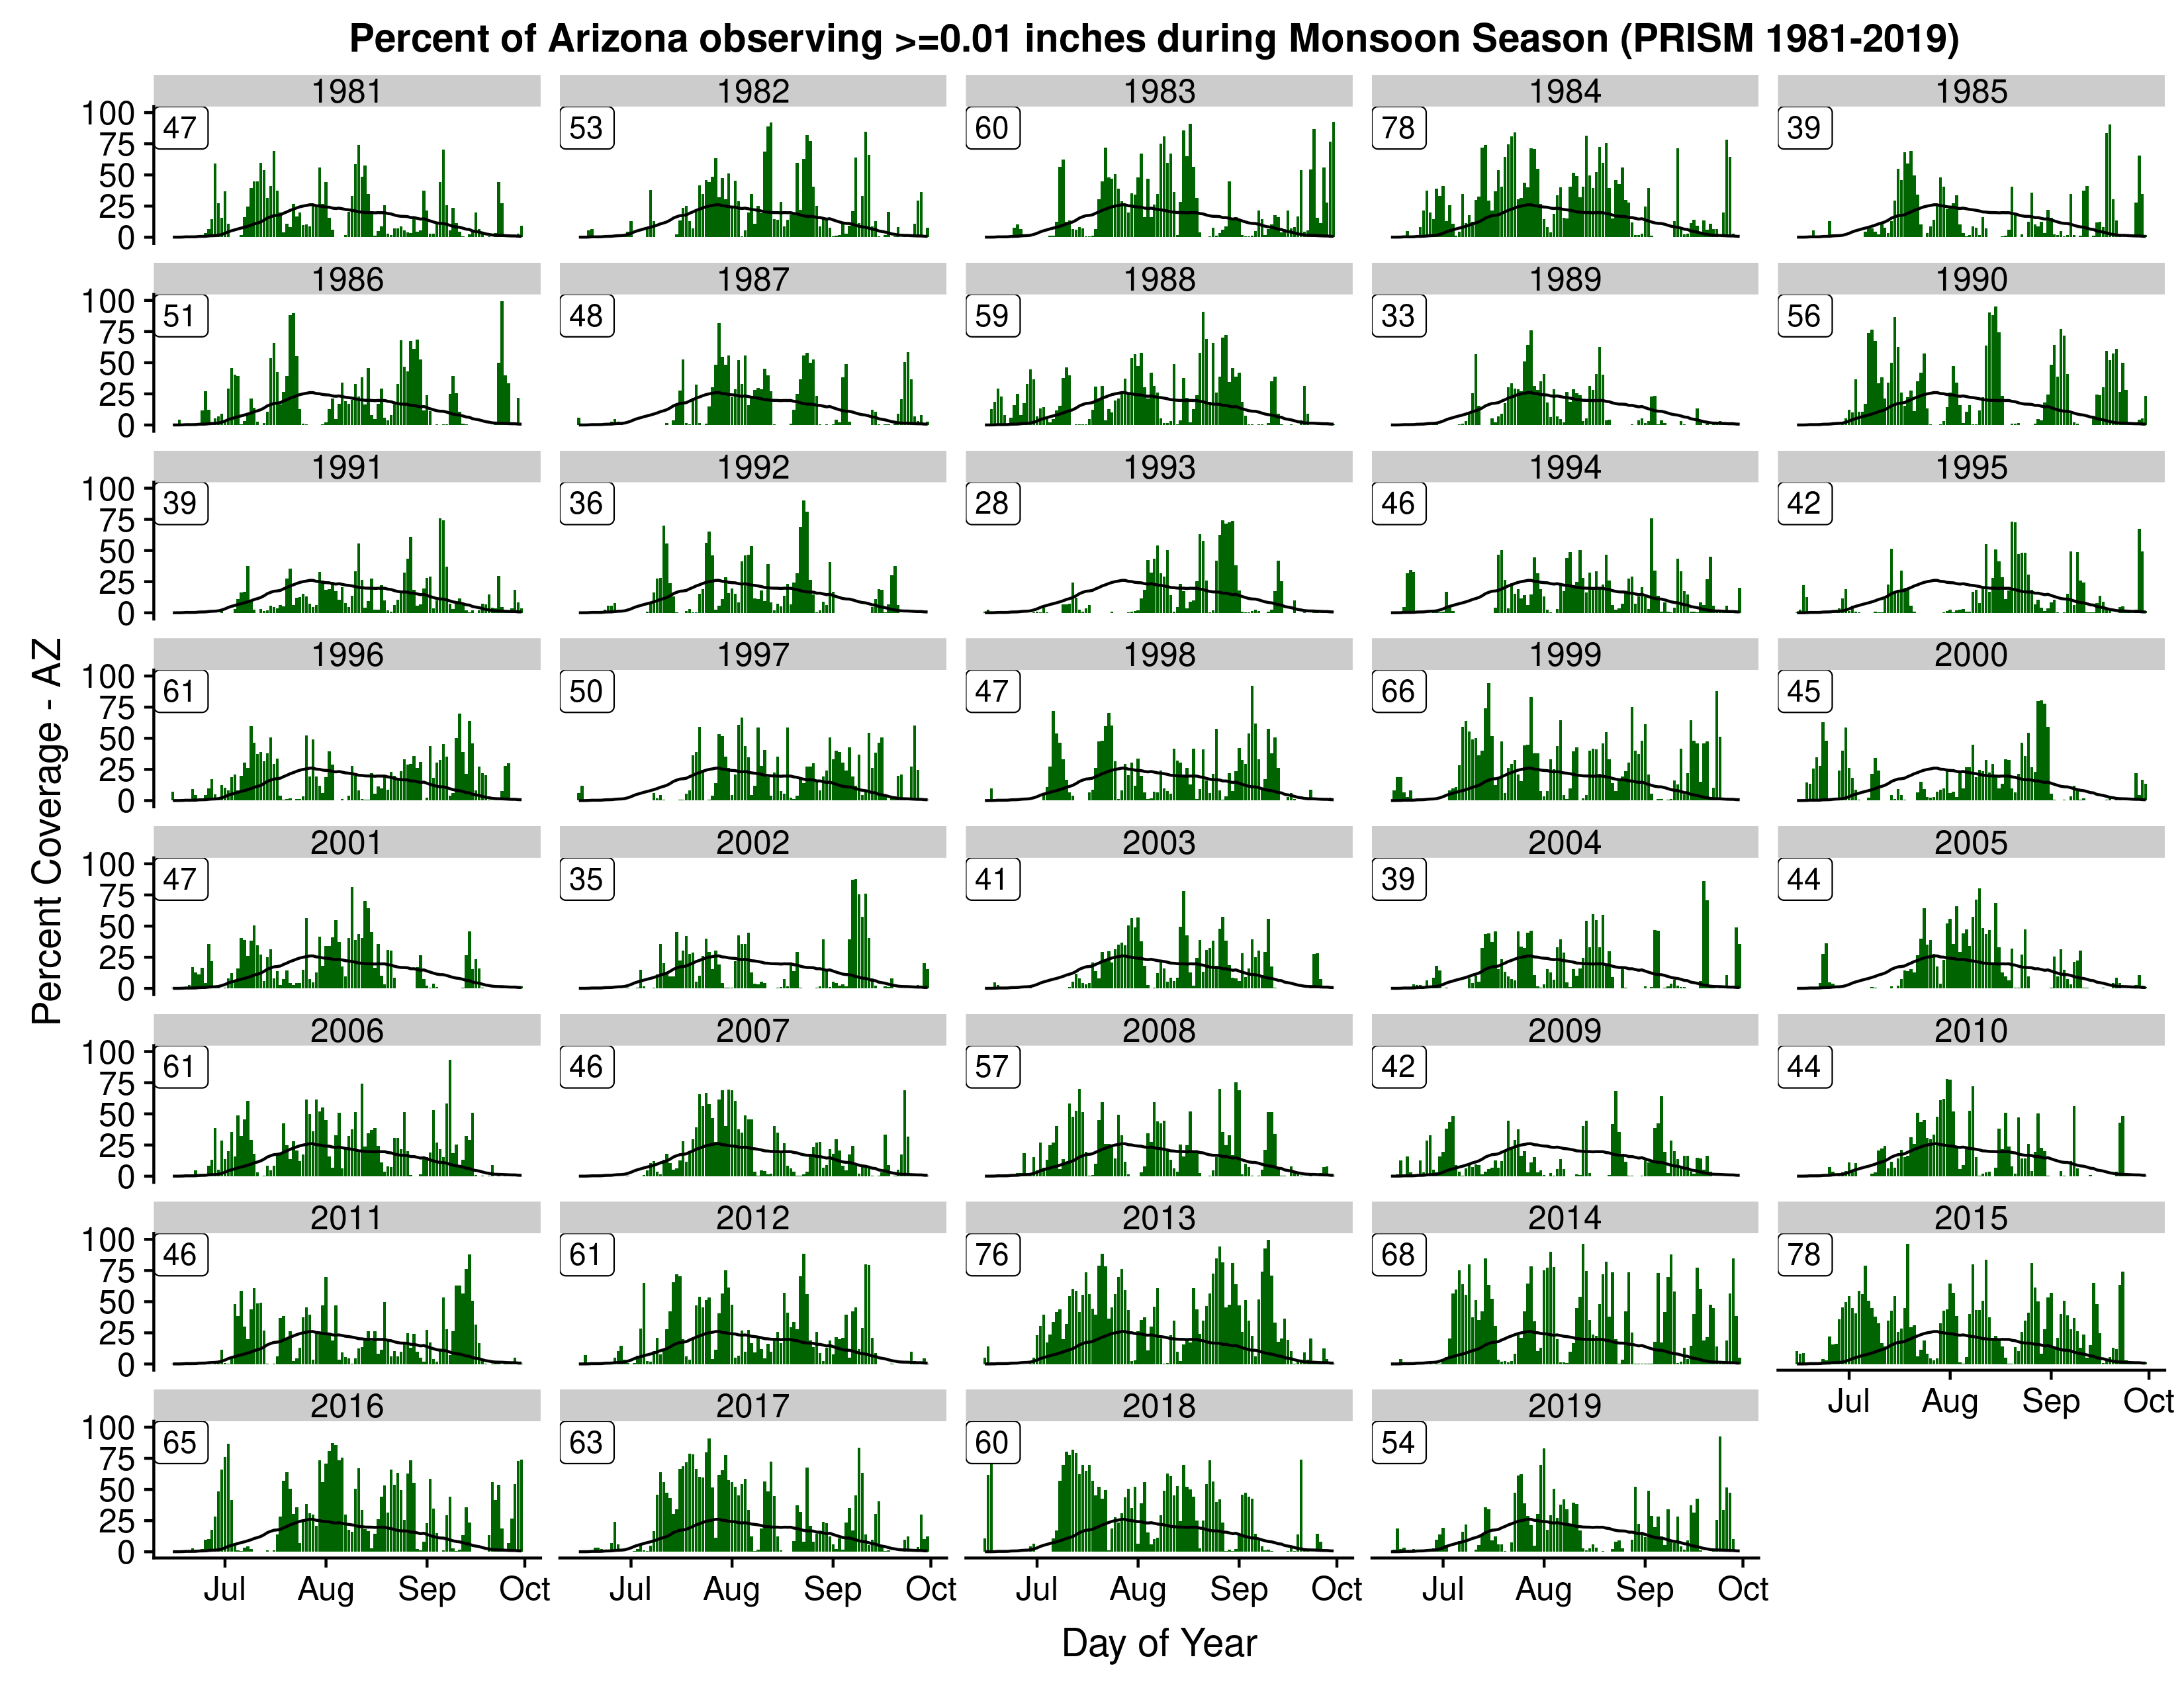
| Fig. 11. Daily values indicating percent of Arizona (left) and New Mexico (right) observing rainfall (green bars) compared to average (black line) for 1981 to 2019. The number in the top-left of the yearly plots represents the number of days each monsoon with above average coverage. The average (1981-2010) for Arizona is 52 days and for New Mexico 48 days. (Source: CLIMAS) | |
For Arizona, there were 54 days with above average rainfall coverage, which was the fewest since 2011 (Figure 11) but close to the typical 52 days (but much less than the past several years). In fact, the 2013-2017 period was the 2nd wettest stretch of five consecutive monsoon seasons on record (wettest being 1984-1988). New Mexico observed 65 days with above average rainfall coverage, a significant increase over the average of 48 days. Despite the higher level of activity, the intensity of rain was below average which yielded the widespread below average seasonal totals. Due to the dry and hot monsoon, drought conditions which had been ameliorated quite extensively during the relatively wet 2018-2019 winter returned to much of Arizona and western New Mexico (Figure 12).
Fig. 12. Depiction of drought conditions via the U.S. Drought Monitor prior to and after the monsoon.
|
Table 1. Temperature and rainfall data (values and |
||||||||||
|
Location Period of Record |
Average Temperature (°F) |
Total Rainfall (in) |
||||||||
|
Jun |
Jul |
Aug |
Sep |
Tot |
Jun |
Jul |
Aug |
Sep |
Tot |
|
|
Clayton, NM Since 1896 |
69.6 62nd |
76.8 14th |
75.6 13th |
72.6 2nd |
73.6 7th |
1.52 67th |
1.57 50th |
3.28 97th |
0.36 29th |
6.73 51st |
|
Roswell, NM Since 1893 |
79.3 32nd |
85.0 3rd |
86.5 1st |
79.0 1st |
82.4 1st |
1.15 70th |
0.73 32nd |
0.75 32nd |
1.26 65th |
3.89 22nd |
|
Albuquerque, NM Since 1892 |
73.8 63rd |
80.7 11th |
79.6 3rd |
73.2 6th |
76.8 9th |
0.07 24th |
1.95 91st |
0.43 13th |
0.45 37th |
2.90 20th |
|
Phoenix, AZ Since 1896 |
91.1 27th |
96.7 7th |
96.8 2nd |
89.1 20th |
93.4 8th |
0.00 1st |
0.17 18th |
0.24 23rd |
0.25 52nd |
0.66 4th |
|
Yuma, AZ Since 1876 |
87.8 47th |
94.1 40th |
95.8 10th |
87.9 52nd |
91.4 32nd |
0.00 1st |
T 11th |
T 8th |
0.53 114th |
0.53 61st |
|
Tucson, AZ Since 1895 |
85.2 33rd |
90.4 3rd |
89.3 3rd |
82.2 32nd |
86.8 6th |
T 16th |
1.07 25th |
1.57 45th |
2.42 106th |
5.06 44th |
|
Douglas, AZ Since 1949 |
75.5 40th |
80.3 20th |
79.6 11th |
74.3 20th |
77.4 21st |
0.00 1st |
2.40 37th |
1.93 35th |
3.93 70th |
8.26 45th |
|
Flagstaff, AZ Since 1899 |
58.9 71st |
67.0 38th |
67.3 2nd |
59.2 30th |
63.1 25th |
T 11th |
0.72 8th |
0.41 3rd |
0.95 42nd |
2.08 1st |
|
Prescott, AZ Since 1898 |
68.8 42nd |
75.3 26th |
75.6 5th |
67.5 29th |
71.8 20th |
0.05 49th |
1.12 20th |
1.07 15th |
2.33 90th |
4.57 16th |
|
Winslow, AZ Since 1915 |
73.4 34th |
80.2 17th |
80.5 1st |
71.8 4th |
76.5 3rd |
0.12 58th |
0.20 9th |
0.31 10th |
0.79 55th |
1.42 4th |
|
Kingman, AZ Since 1901 |
78.2 37th |
84.9 22nd |
85.4 2nd |
75.2 49th |
80.9 16th |
0.00 1st |
1.33 89th |
0.29 27th |
0.42 60th |
2.04 35th |
|
El Paso, TX Since 1879 |
83.1 29th |
87.3 3rd |
87.6 1st |
80.4 2nd |
84.6 3rd |
0.97 105th |
0.18 5th |
0.89 53rd |
1.54 94th |
3.58 37th |
Notable Events from Northern New Mexico (WFO Albuquerque)
Notable Events from Central and Southwest Arizona (WFO Phoenix)
Several waves of strong to severe thunderstorms moved from east-to-west across southern Arizona and into southeast California during the day of Sunday, September 1, 2019 and into the early morning hours of Monday, September 2, 2019. Numerous alerts were issued as the storms progressed through the region, including 11 Severe Thunderstorm Warnings and 7 Flash Flood Warnings. The most intense storms occurred near Gila Bend and across La Paz county, impacting the communities of Bouse and Parker.
Very heavy rain fell across portions of central Arizona, causing flash flooding from Apache Junction toward Lake Roosevelt and from Quartzsite toward Anthem. Supercell thunderstorms produced hail in the Phoenix area and a brief EF0 tornado in New River.
The Phoenix area experienced 25 days of Excessive Heat Warnings, the most since 2010.
Notable Events from Northwest Arizona (WFO Las Vegas)
Notable Events from Southeast Arizona (WFO Tucson)


 Follow us on YouTube