
|
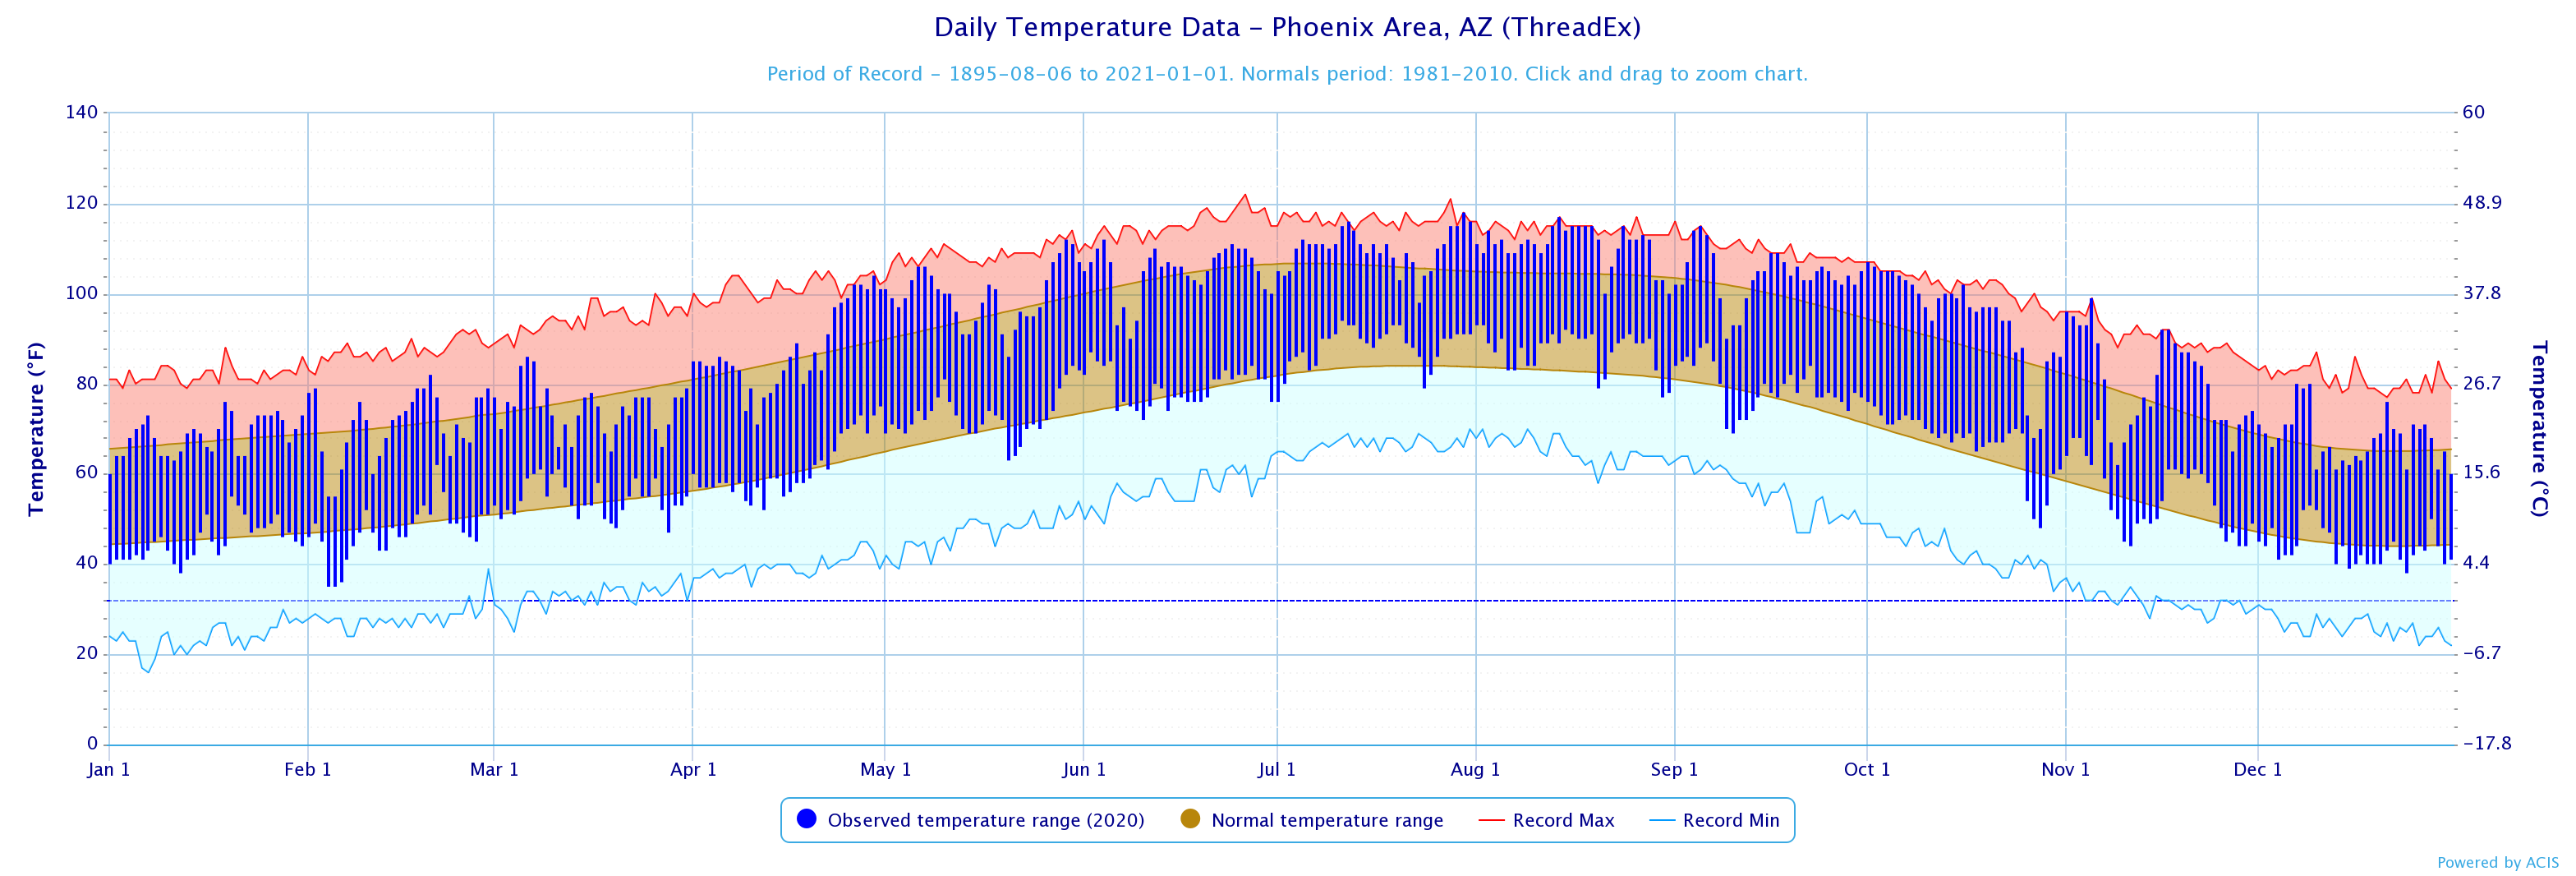
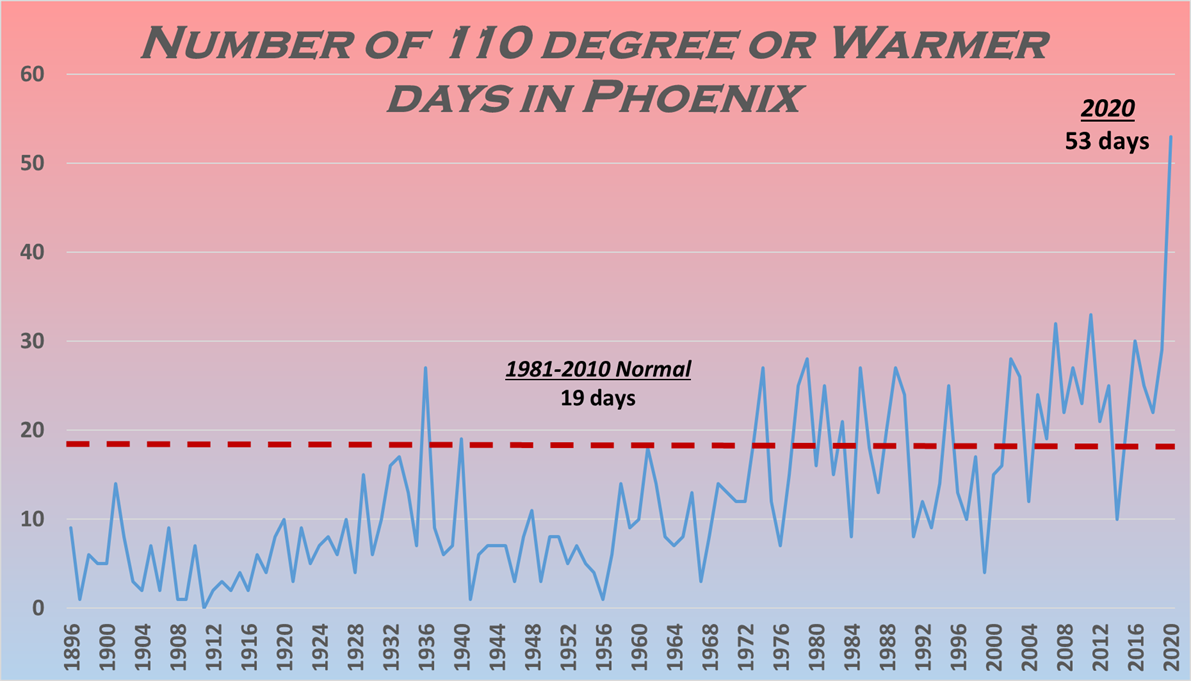
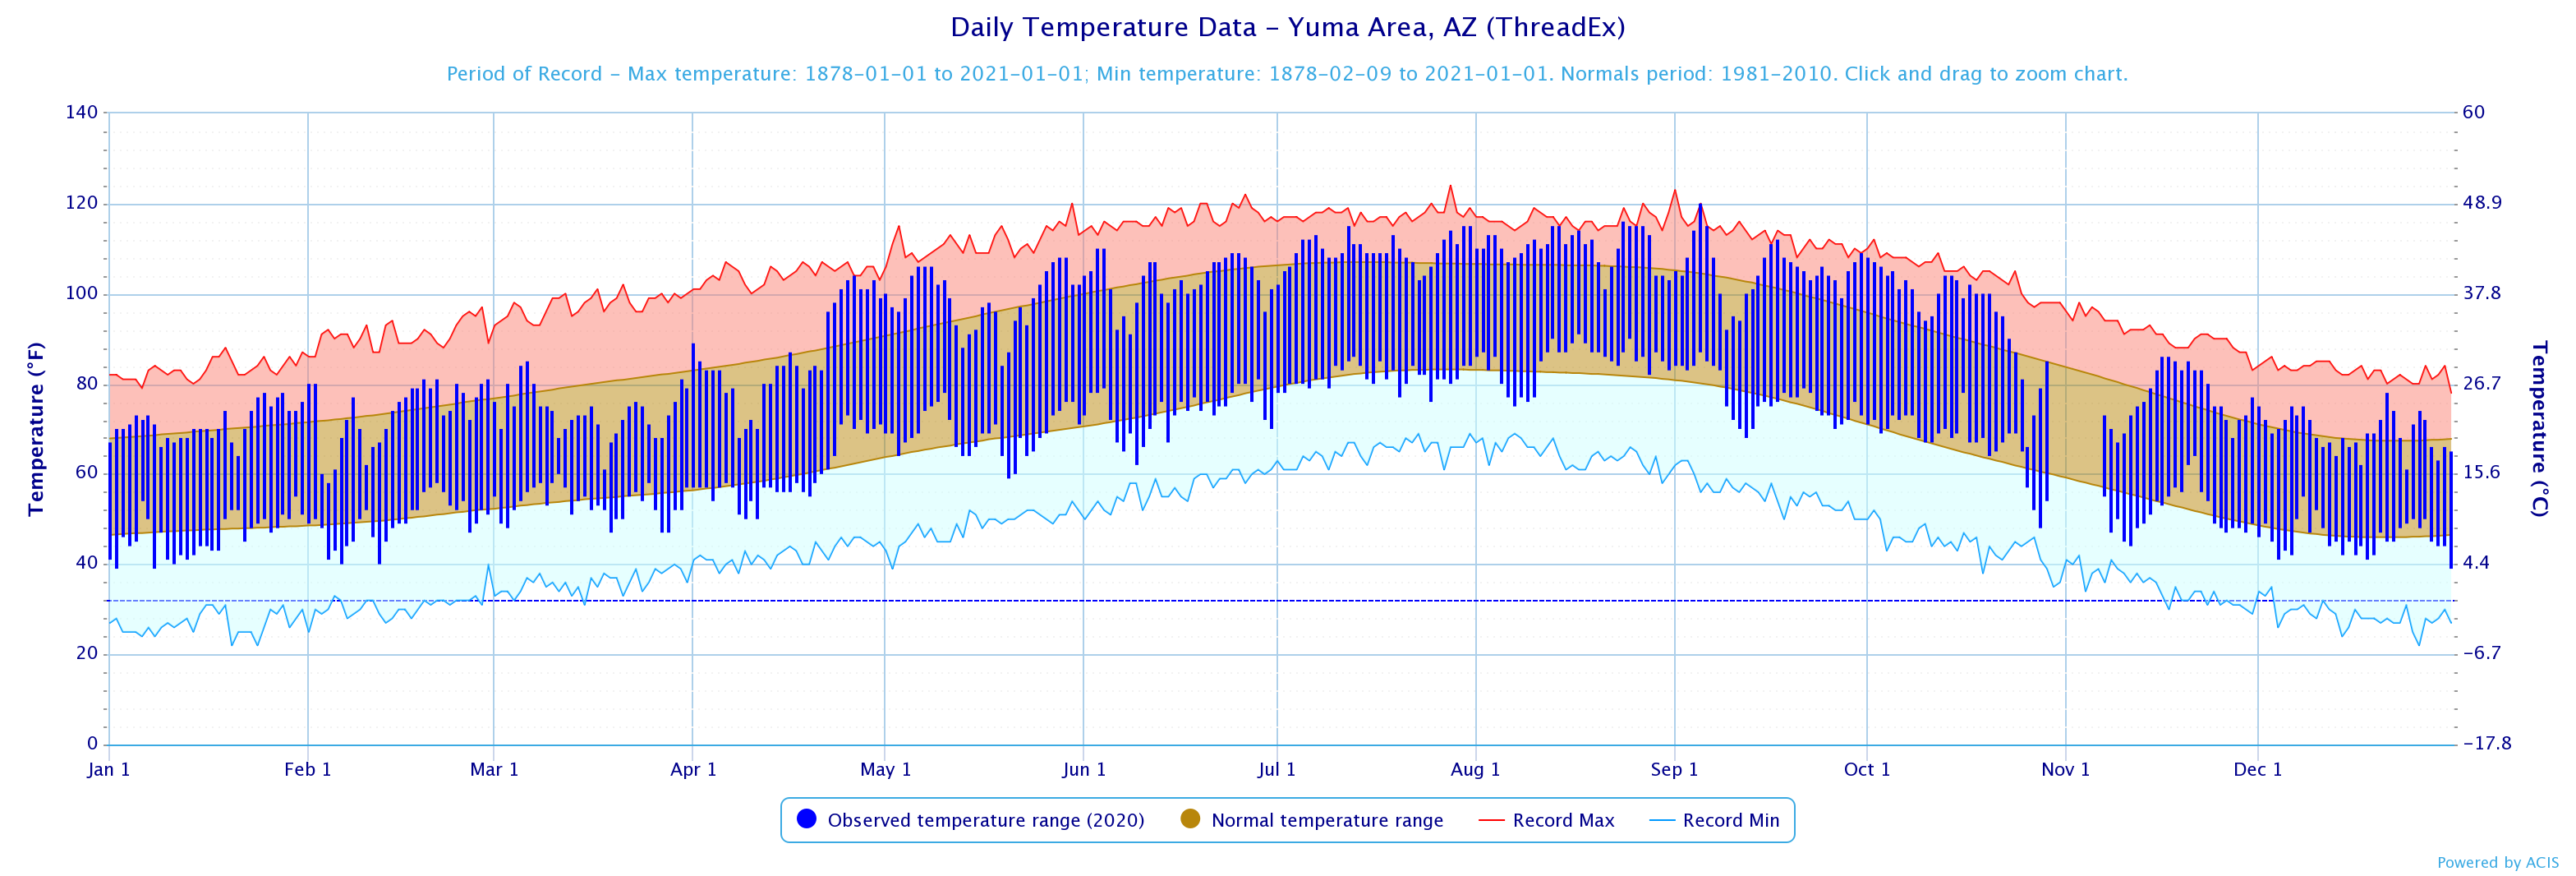
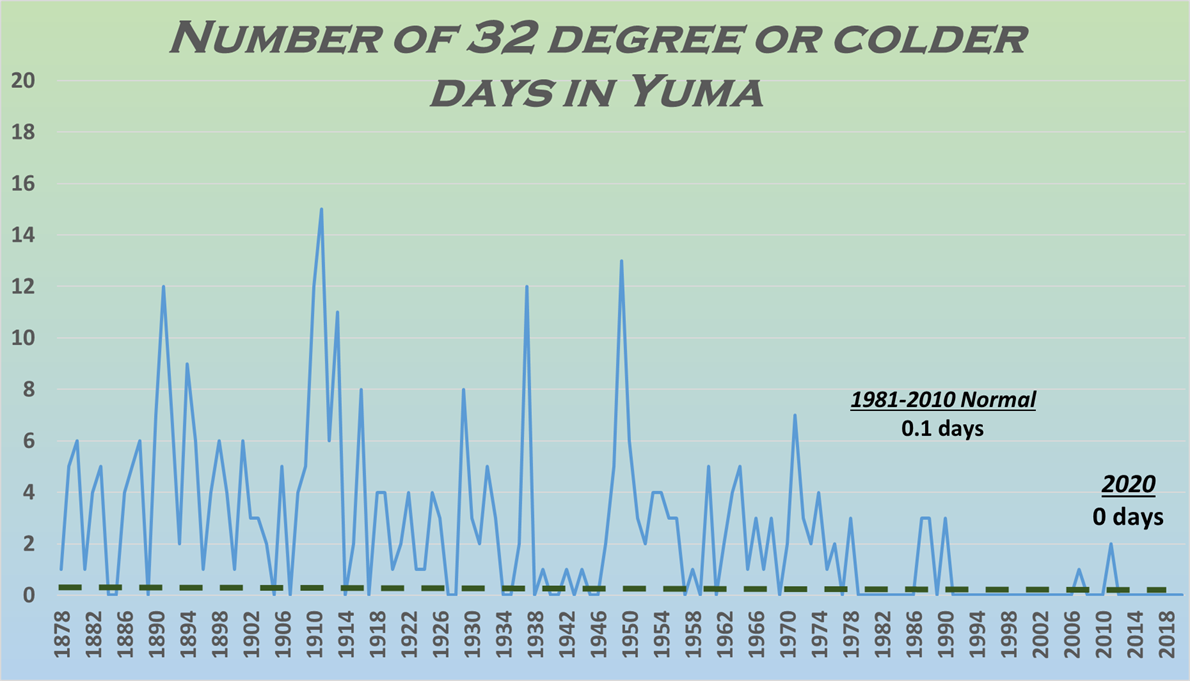
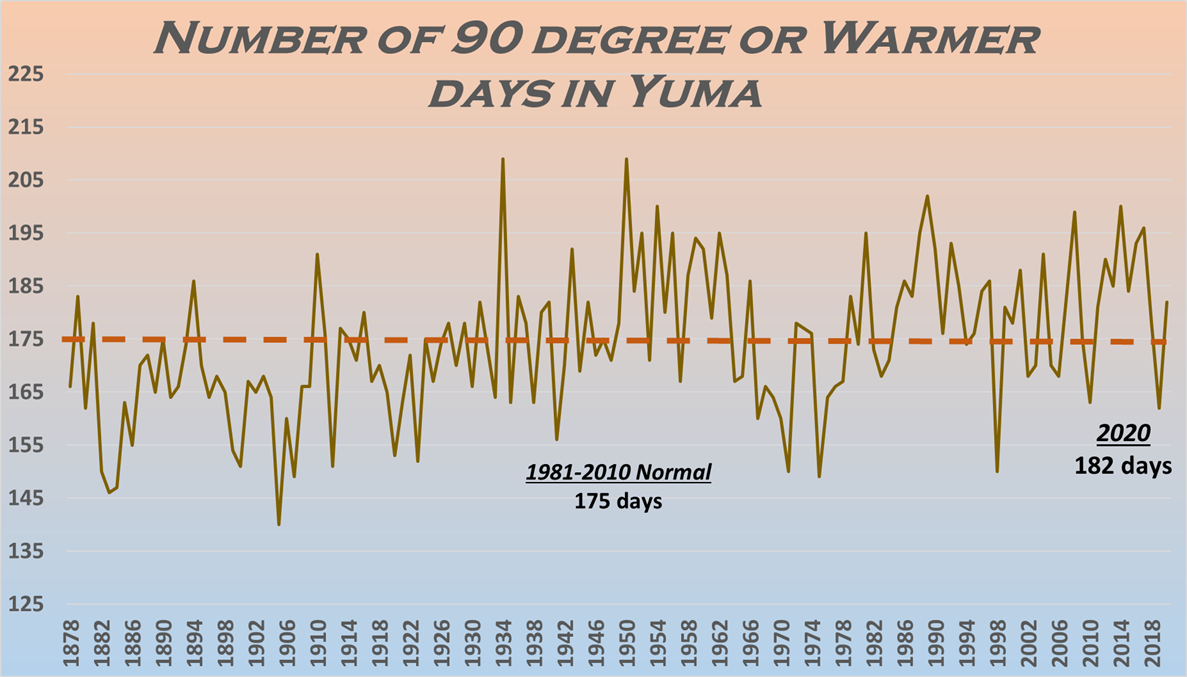
The year 2020 ended up being the 2nd warmest year recorded in the history of Phoenix, Arizona and 6th warmest at El Centro, CA. Unfortunately, prolonged equipment outages at Yuma, Arizona preclude an accurate ranking versus historical records. Records for Phoenix began in 1896, first taken in downtown and since moved to Sky Harbor airport in the 1950s. Records in Yuma began in 1878 and 1932 in El Centro. 2019 started with a very weak El Nino transitioning into a neutral condition. The resulting weather pattern was fairly typical for January and February, albeit drier than normal across the region. That changed quite abruptly in March and April as a series of storm systems swept through the Southwest. As it ended up, these spring precipitation events were very welcome with generous mountain snowfall eventually helping nearly fill local reservoirs. However, the soaking rains across lower elevations had a not-so-welcome consequence of forcing a surge in growth of grasses and small bushes (and lawn weeds for local residents). Once the hotter, drier spring season settled into full effect, these grasses and bushes dried into abundant, dense fuels ready to burn. With two successive "wet" winters, the amount of fine fuels at lower elevations was more than had been seen in over a decade. And not surprisingly, wildfire became a serious and dangerous issue for Arizona. By the end of summer, nearly 1 million acres had burned in Arizona - more than the past 2 years combined. The 2020 summer monsoon started slowly and never really was able to pull substantial moisture into the region. High pressure became locked directly over southern Arizona trapping better moisture into central Mexico and producing day after day of excessive heat. In Phoenix, July 2020 set a record for the hottest month ever recorded in the city (since records began in 1896). Not to be outdone, August 2020 broke the July 2020 record such that these 2 summer months now stand as the hottest two on record for Phoenix. The heat wasn't reserved just for Phoenix, as the entire Southwest region experienced its hottest and driest monsoon on record. With very little thunderstorm activity in the summer, the hot and dry conditions persisted nearly seamlessly into the autumn. In fact in addition to the summer, autumn 2020 was also the warmest on record for the region. Given the heat and prolonged dryness, drought rapidly emerged through the middle of the year with the rarest category of Exceptional Drought setting an unprecedented amount of coverage in Arizona through the fall season. While the hot weather finally relaxed late in the fall and early winter, precipitation still has been lacking allowing drought to take a solid hold on the area. |
***Please note all climatic data are considered preliminary until validated by the National Centers for Environmental Information*** |
Phoenix Annual Temperature Rankings (Warmest Years)
|
|
|
|---|
|
|
Avg Max Temp |
Highest
Temp |
Avg Min Temp
|
Lowest Temp
|
Avg Temp
|
Rank (1=Warmest, 125=Coldest)
|
|---|---|---|---|---|---|---|
| Jan |
68.6
|
76 on the 19th
|
45.1
|
38 on the 12th
|
56.8 /+0.4
|
Tied 16th
|
| Feb |
70.9
|
82 on the 20th
|
47.0
|
35 on the 4th & 5th
|
58.9 /-0.8
|
Tied 44th
|
| Mar |
74.5
|
86 on the 6th
|
54.3
|
47 on the 28th
|
64.4 /-0.8
|
39th
|
| Apr |
87.4
|
104 on the 29th
|
61.1
|
52 on the 12th
|
74.2 /+1.5
|
Tied 18th
|
| May |
99.7
|
112 on the 29th
|
72.7
|
63 on the 20th
|
86.2 /+4.1
|
4th
|
| Jun |
105.0
|
112 on the 4th
|
79.1
|
72 on the 10th
|
92.0 /+1.2
|
Tied 21st
|
| Jul |
109.8
|
118 on the 30th
|
88.0
|
76 on the 1st
|
98.9 /+4.1
|
1st
|
| Aug |
110.7
|
117 on the 14th
|
87.4
|
77 on the 30th
|
99.1 /+5.5
|
1st
|
| Sep |
104.1
|
115 on the 5th
|
79.0
|
69 on the 10th
|
91.5 /+3.1
|
Tied 3rd
|
| Oct |
95.0
|
107 on the 1st
|
66.8
|
48 on the 28th
|
80.9 /+4.2
|
Tied 4th
|
| Nov |
80.5
|
99 on the 5th
|
55.0
|
44 on the 28th & 29th
|
67.8 /+3.8
|
6th
|
| Dec |
67.9
|
80 on the 7th & 9th
|
43.7
|
38 on the 24th
|
55.8 /+0.4
|
Tied 33rd
|
(*** click on month for more comprehensive monthly summary ***)
| Record Highs Set in 2020 |
|---|
| Date | Record | Previous Record |
|---|---|---|
| Apr 26 |
102
|
101 in 1992
|
| May 6 |
106 - tied record
|
106 in 2018
|
| May 29 |
112 - tied record
|
112 in 1910
|
| Jul 12 |
116
|
115 in 2009
|
| Jul 13 |
114 - tied record
|
110 in 2005
|
| Jul 29 |
115 - tied record
|
115 in 1995
|
| Jul 30 | 118 | 115 in 1934 |
| Jul 31 | 116 | 115 in 1996 |
| Aug 3 | 114 - tied record | 114 in 2019 |
| Aug 13 | 115 - tied record | 115 in 2012 |
| Aug 14 | 117 - tied record | 117 in 2015 |
| Aug 16 | 115 | 113 in 2013 |
| Aug 17 | 115 | 114 in 2013 |
| Aug 18 | 115 | 112 in 2011 |
| Aug 19 | 115 | 113 in 1986 |
| Aug 24 | 115 - tied record | 115 in 1985 |
| Aug 27 | 113 - tied record | 113 in 2009 |
| Sep 4 | 114 | 112 in 2019 |
| Sep 5 | 115 | 113 in 1945 |
| Sep 6 | 113 | 111 in 2013 |
| Sep 16 | 109 - tied record | 109 in 1928 |
| Sep 17 | 109 - tied record | 109 in 1962 |
| Oct 1 | 107 - tied record | 107 in 1980 |
| Oct 3 | 105 - tied record | 105 in 1988 |
| Oct 4 | 105 | 103 in 1993 |
| Oct 5 | 105 | 104 in 1987 |
| Oct 14 | 100 - tied record | 100 in 2015 |
| Oct 16 | 102 | 101 in 1991 |
| Nov 1 | 96 - tied record | 96 in 1924 |
| Nov 5 | 99 | 93 in 2007 |
| Nov 16 | 92 | 89 in 1999 |
| Nov 17 | 92 | 87 in 2008 |
| Nov 18 | 89 | 88 in 2008 |
| No Record Lows were set in 2020 |
|---|
Yuma Annual Temperature Rankings (Warmest Years)
|
|
|
|---|
|
|
Avg Max Temp |
Highest
Temp |
Avg Min Temp
|
Lowest Temp
|
Avg Temp
|
Rank (1=Warmest, 143=Coldest)
|
|---|---|---|---|---|---|---|
| Jan |
71.3
|
78 on the 25th & 28th
|
46.2
|
39 on the 2nd & 8th
|
58.8 /+0.2
|
Tied 28th
|
| Feb |
73.5
|
81 on the 21st & 29th
|
49.2
|
40 on the 6th & 12th
|
61.4 /-0.5
|
45th
|
| Mar |
73.8
|
85 on the 6th
|
53.3
|
47 on the 27th & 28th
|
63.5 /-3.7
|
96th
|
| Apr |
86.5
|
104 on the 26th
|
59.7
|
50 on the 9th & 11th
|
73.1 / +0.1
|
Tied 42nd
|
| May |
98.7
|
108 on the 28th & 29th
|
68.9
|
59 on the 20th
|
83.8 /+2.5
|
7th
|
| Jun |
102.9
|
110 on the 3rd & 4th
|
73.5
|
62 on the 9th
|
88.2 /-0.8
|
Tied 41st
|
| Jul |
109.5
|
115 on the 30th & 31st
|
81.3
|
76 on the 25th
|
95.4 /+0.9
|
16th
|
| Aug |
110.5
|
116 on the 24th
|
84.6
|
75 on the 7th
|
97.5 /+3.2
|
2nd
|
| Sep |
105.2
|
120 on the 5th
|
76.7
|
68 on the 12th
|
91.0 /+2.0
|
10th
|
| Oct |
96.0
|
108 on the 1st
|
66.5
|
48 on the 28th
|
81.3 /+3.8
|
7th
|
| Nov |
Missing
|
Missing
|
53.7
|
44 on the 11th
|
M /M
|
Missing
|
| Dec |
69.3
|
78 on the 21st
|
45.7
|
41 on the 4th & 18th
|
57.5 /+0.1
|
Tied 47th
|
(*** click on month for more comprehensive monthly summary ***)
| Record Highs Set in 2020 |
|---|
| Date | Record | Previous Record |
|---|---|---|
| Apr 26 |
104 - tied record
|
104 in 2004
|
| Aug 17 |
114 - tied record
|
114 in 1992
|
| Aug 26 |
115
|
113 in 2017
|
| Sep 5 | 120 | 115 in 1945 |
| Sep 6 | 115 | 113 in 1986 |
| Sep 16 | 111 - tied record | 111 in 2013 |
| No Record Lows were set in 2020 |
|---|
El Centro Annual Temperature Rankings (Warmest Years)
|
|
|
|---|
|
|
Avg Max Temp |
Highest
Temp |
Avg Min Temp
|
Lowest Temp
|
Avg Temp
|
Rank (1=Warmest, 95=Coldest)
|
|---|---|---|---|---|---|---|
| Jan |
71.7
|
78 on the 27th & 28th
|
42.2
|
35 on the 11th
|
57.0 /+1.7
|
21st
|
| Feb |
75.1
|
84 on the 29th
|
46.2
|
32 on the 5th
|
60.7 /+1.7
|
27th
|
| Mar |
73.5
|
86 on the 6th
|
50.9
|
44 on the 3rd
|
62.2 /-2.3
|
64th
|
| Apr |
86.7
|
105 on the 26th
|
57.5
|
46 on the 9th
|
72.1 / +2.0
|
Tied 32nd
|
| May |
98.5
|
108 on the 27th & 28th
|
66.7
|
55 on the 20th
|
82.6 /+4.0
|
Tied 4th
|
| Jun |
102.3
|
111 on the 4th
|
70.2
|
56 on the 9th
|
86.3 /+0.0
|
41st
|
| Jul |
110.2
|
119 on the 31st
|
77.7
|
71 on the 2nd
|
94.0 /+1.8
|
Tied 16th
|
| Aug |
111.1
|
117 on the 14th
|
82.2
|
70 on the 7th & 10th
|
96.6 /+4.1
|
2nd
|
| Sep |
105.8
|
121 on the 5th
|
72.1
|
60 on the 10th
|
89.0 /+2.9
|
Tied 11th
|
| Oct |
95.7
|
108 on the 1st & 2nd
|
62.8
|
44 on the 28th
|
79.2 /+4.9
|
7th
|
| Nov |
79.9
|
95 on the 5th
|
49.2
|
38 on the 28th
|
64.6 /+1.9
|
Tied 25th
|
| Dec |
70.3
|
78 on the 1st
|
39.8
|
34 on the 5th
|
55.0 /+0.5
|
Tied 50th
|
(*** click on month for more comprehensive monthly summary ***)
| Record Highs Set in 2020 |
|---|
| Date | Record | Previous Record |
|---|---|---|
| Apr 26 |
105
|
103 in 1996
|
| Apr 27 |
102
|
101 in 1992
|
| May 6 |
106 - tied record
|
106 in 2018
|
| May 7 | 106 - tied record | 106 in 1963 |
| Jul 31 | 119 | 118 in 1934 |
| Aug 13 | 116 - tied record | 116 in 2012 |
| Aug 14 | 117 | 116 in 2015 |
| Aug 17 | 115 - tied record | 115 in 2015 |
| Aug 18 | 115 - tied record | 115 in 2015 |
| Aug 19 | 115 | 114 in 2010 |
| Sep 5 | 121 | 114 in 1945 |
| Sep 6 | 118 | 114 in 1934 |
| Sep 7 | 113 | 112 in 2019 |
| Sep 16 | 110 - tied record | 110 in 2013 |
| Sep 30 | 108 - tied record | 108 in 2015 |
| Oct 2 | 108 - tied record | 108 in 2012 |
| Oct 5 | 106 - tied record | 106 in 1987 |
| Oct 14 | 104 | 103 in 1991 |
| Nov 4 | 94 | 93 in 2010 |
| Nov 5 | 95 | 93 in 2012 |
| Record Lows Set in 2020 |
|---|
| Date | Record | Previous Record |
|---|---|---|
| Jun 9 |
56 - tied record
|
56 in 1998
|
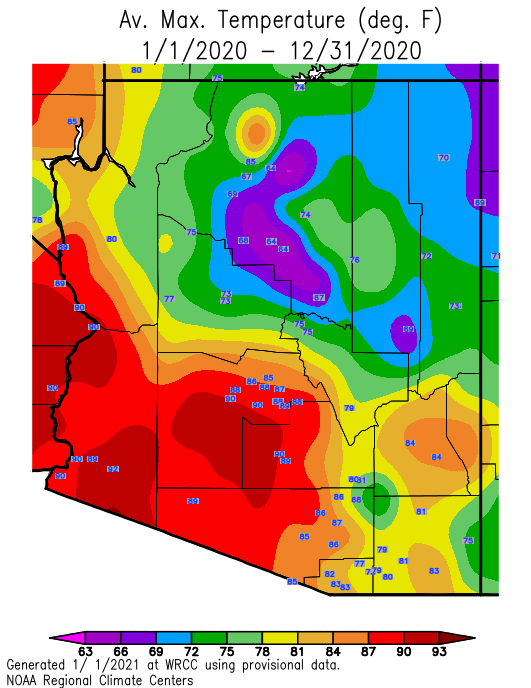
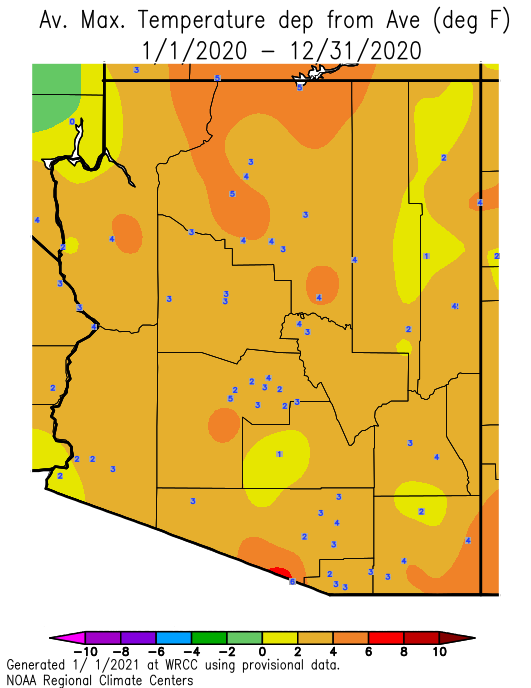
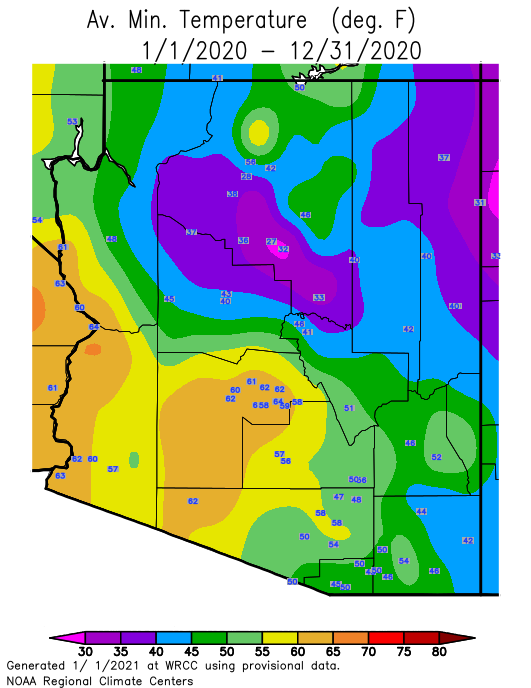
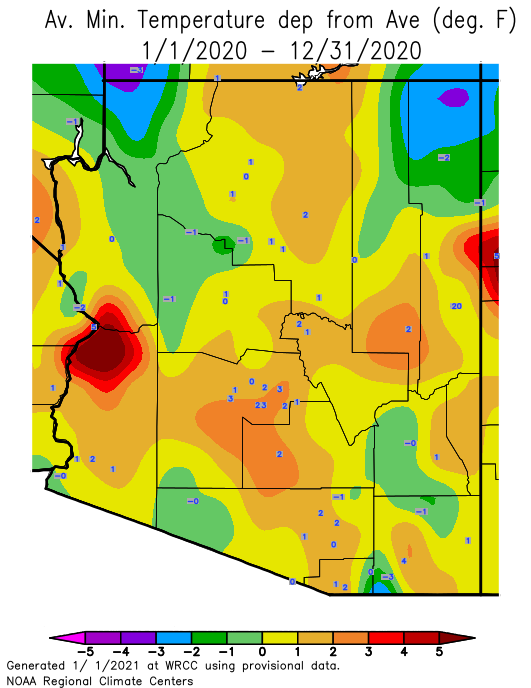
| Arizona Statewide Temperature Maps (Data courtesy of Western Region Climate Center) |
|---|
|
Arizona 2020 Average
Maximum Temperature
 |
Arizona 2020 Maximum Temp Departure from normal
 |
|
Arizona 2020 Average
Minimum Temperature
 |
Arizona 2020 Minimum Temp
Departure from normal
 |
|
Arizona 2020 Average Temperature
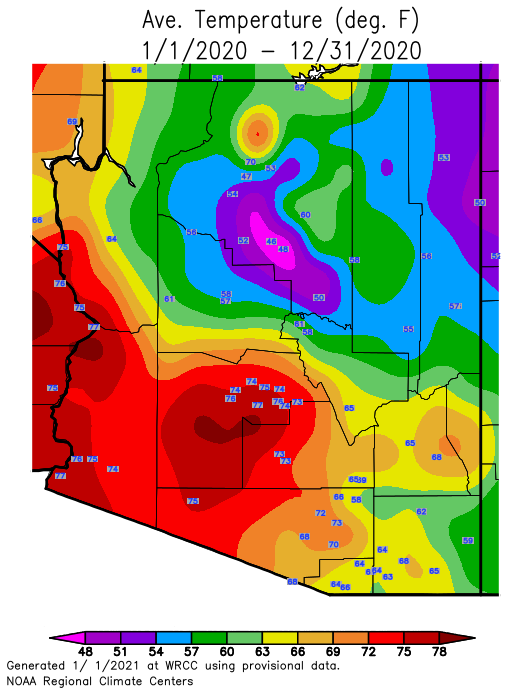 |
Arizona 2020 Average Temp
Departure from normal
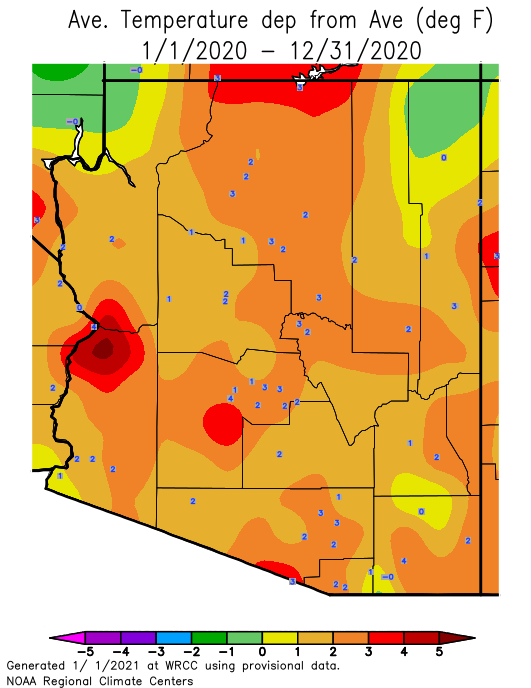 |
| California Statewide Temperature Maps (Data courtesy of Western Region Climate Center) |
|---|
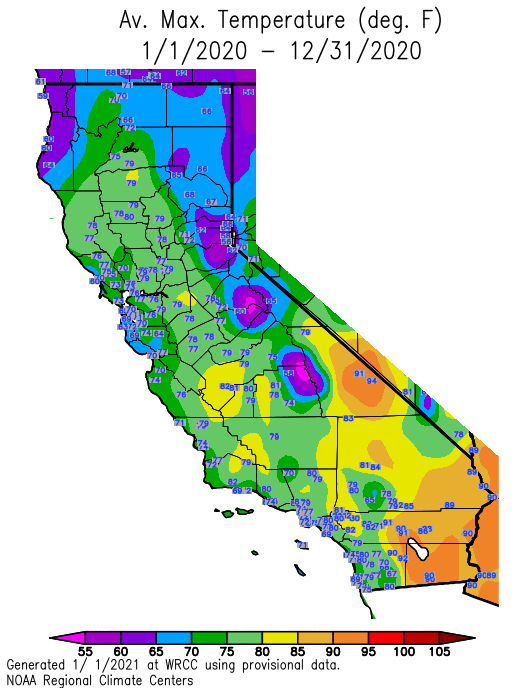
|
California 2020 Average
Maximum Temperature
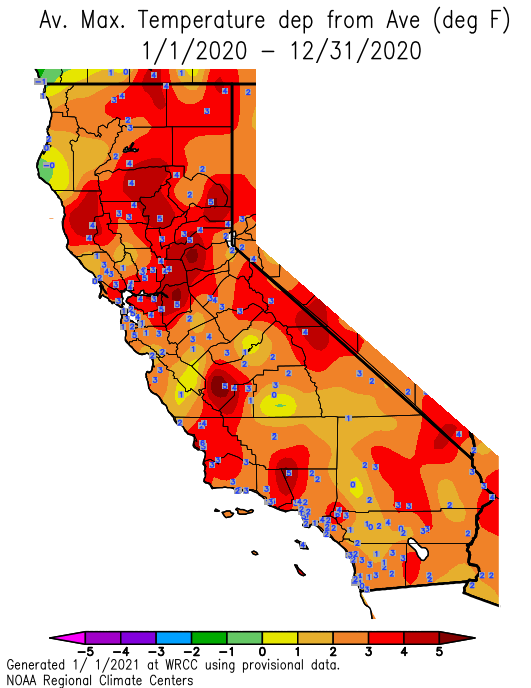
 |
California 2020 Maximum Temp Departure from normal
 |
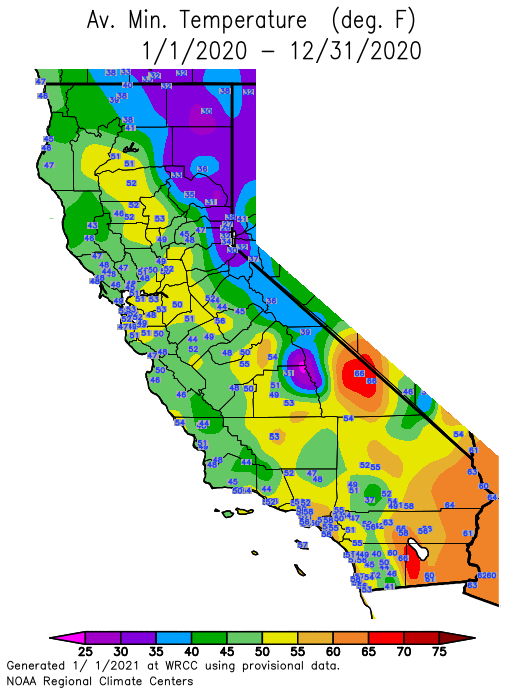
|
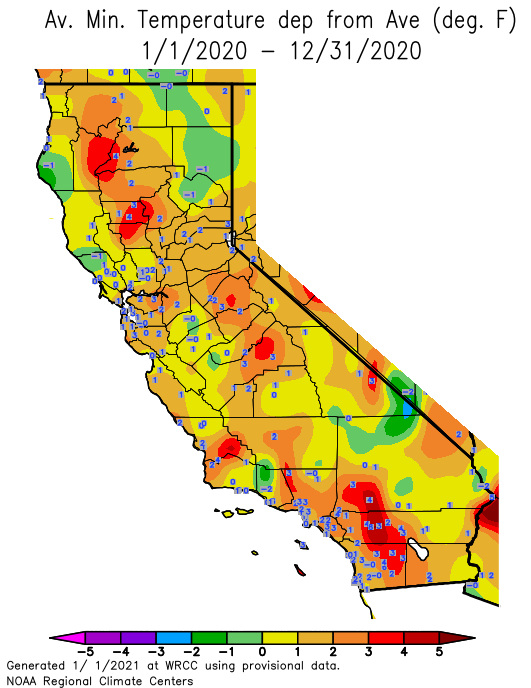
California 2020 Average
Minimum Temperature
 |
California 2020 Minimum Temp
Departure from normal
 |
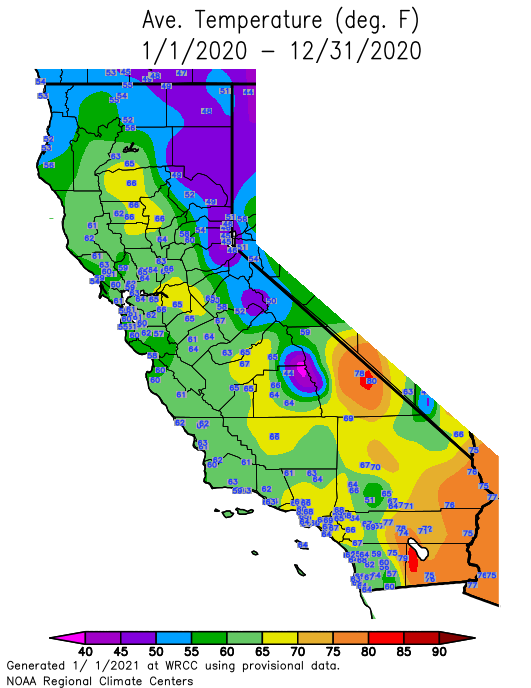
|
California 2020 Average Temperature
 |
California 2020 Average Temp
Departure from normal
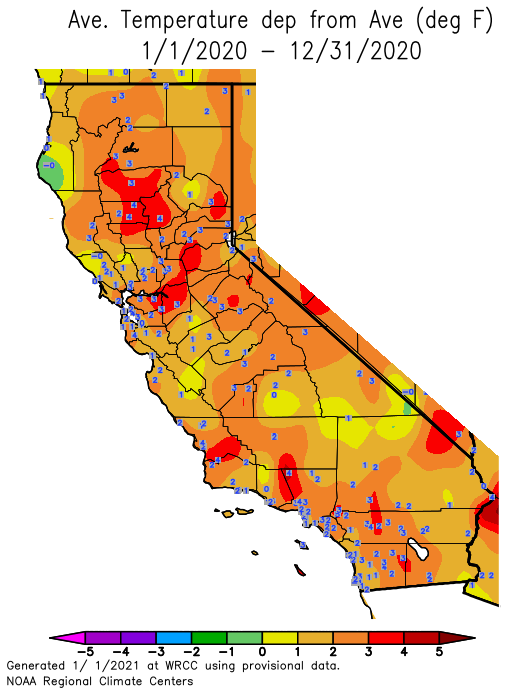 |
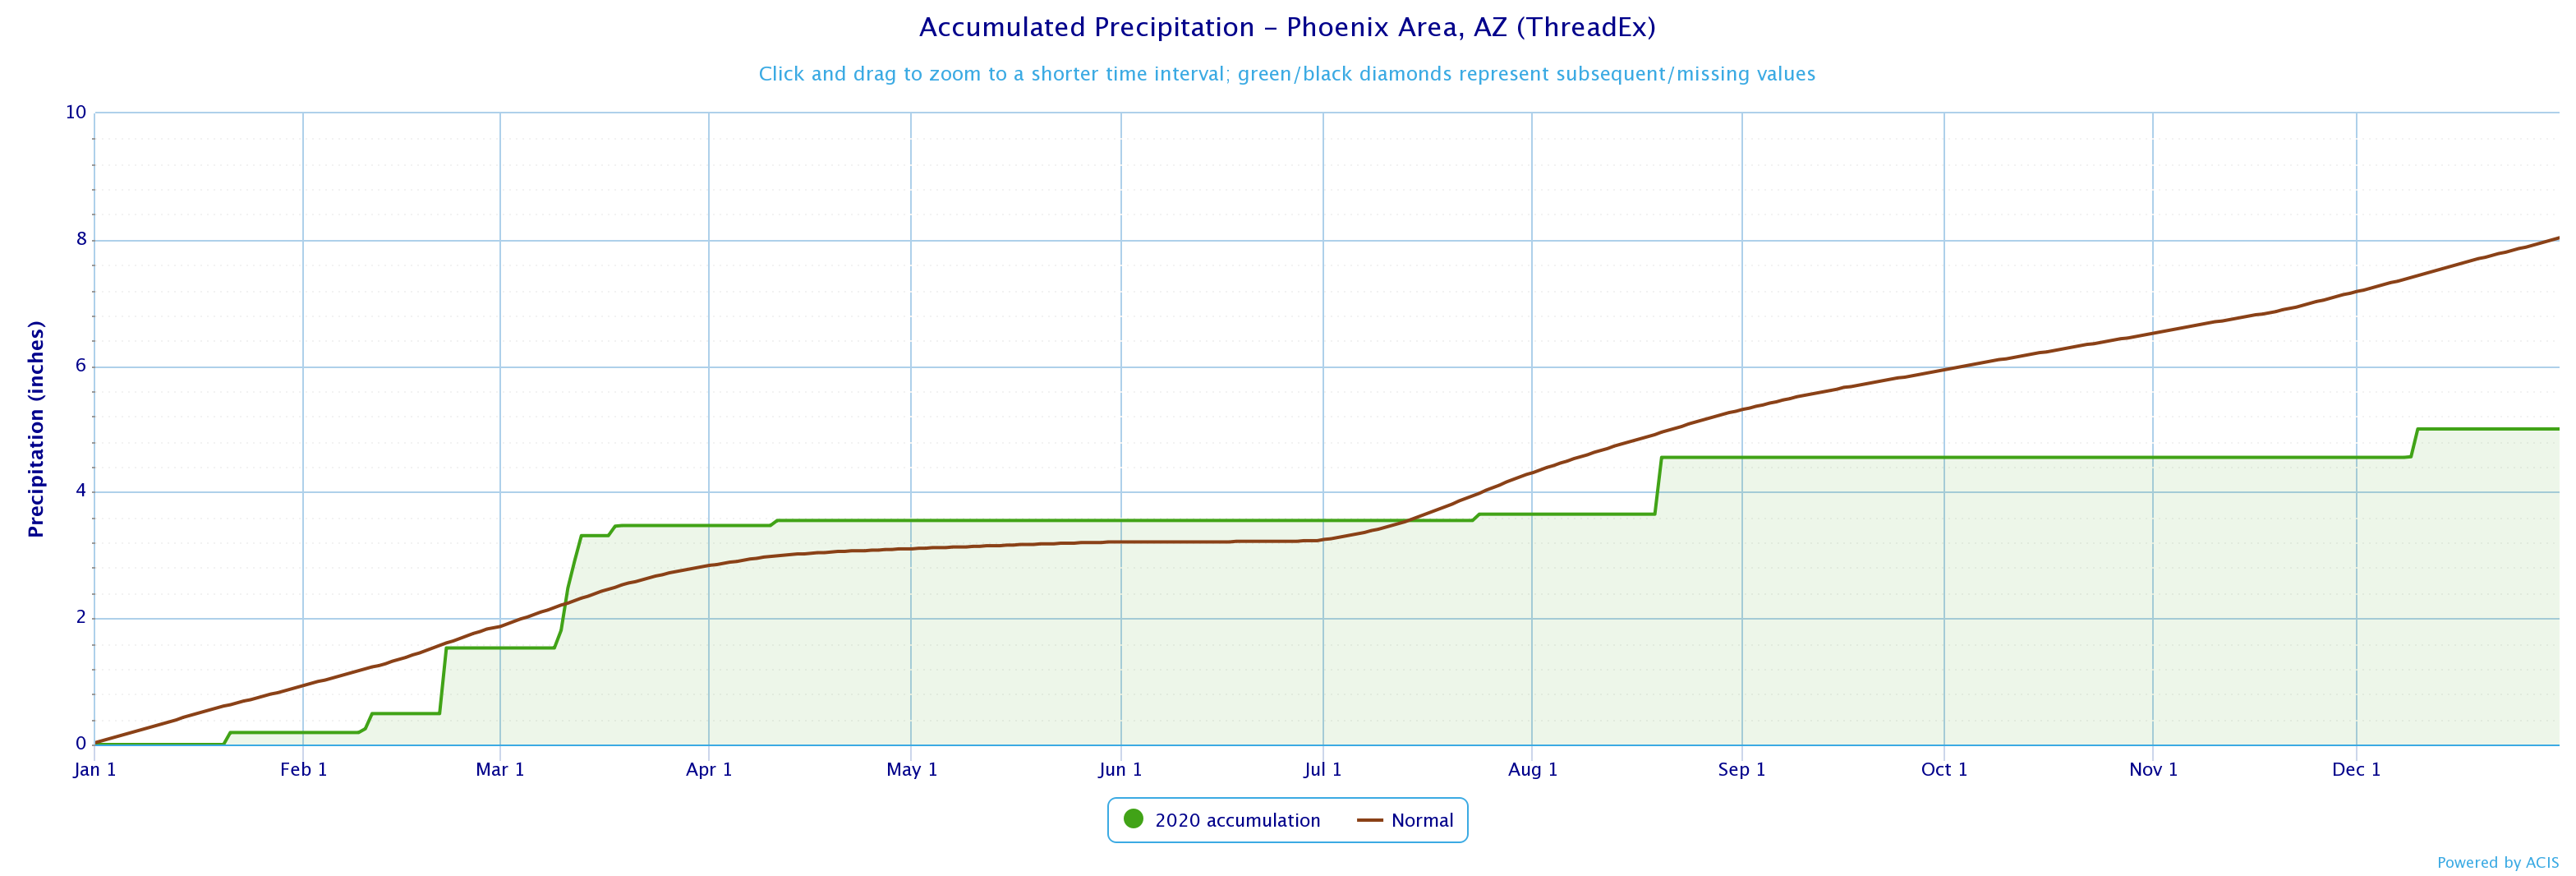
| 2020 Phoenix Precipitation Statistics |
|---|
| Precip Total | Departure | Rank (1=Wettest, 125=Driest) | |
|---|---|---|---|
| Jan |
0.19
|
-0.72
|
92nd
|
| Feb |
1.34
|
+0.42
|
22nd
|
| Mar |
1.94
|
+0.95
|
Tied 10th
|
| Apr |
0.08
|
-0.20
|
70th
|
| May |
Trace
|
-0.10
|
Tied 125th
|
| Jun |
Trace
|
-0.02
|
Tied 125th
|
| Jul |
0.10
|
-0.95
|
116th
|
| Aug |
0.90
|
-0.10
|
57th
|
| Sep |
Trace
|
-0.64
|
Tied 125th
|
| Oct |
0.00
|
-0.58
|
Tied 125th
|
| Nov |
Trace
|
-0.65
|
Tied 125th
|
| Dec |
0.45
|
-0.43
|
Tied 56th
|
(*** click on month for more comprehensive monthly summary ***)
| Phoenix Record Daily Rainfall for 2020 |
|---|
| Date | Record | Previous Record |
|---|---|---|
| Feb 22 |
1.04
|
0.45 in 1913
|
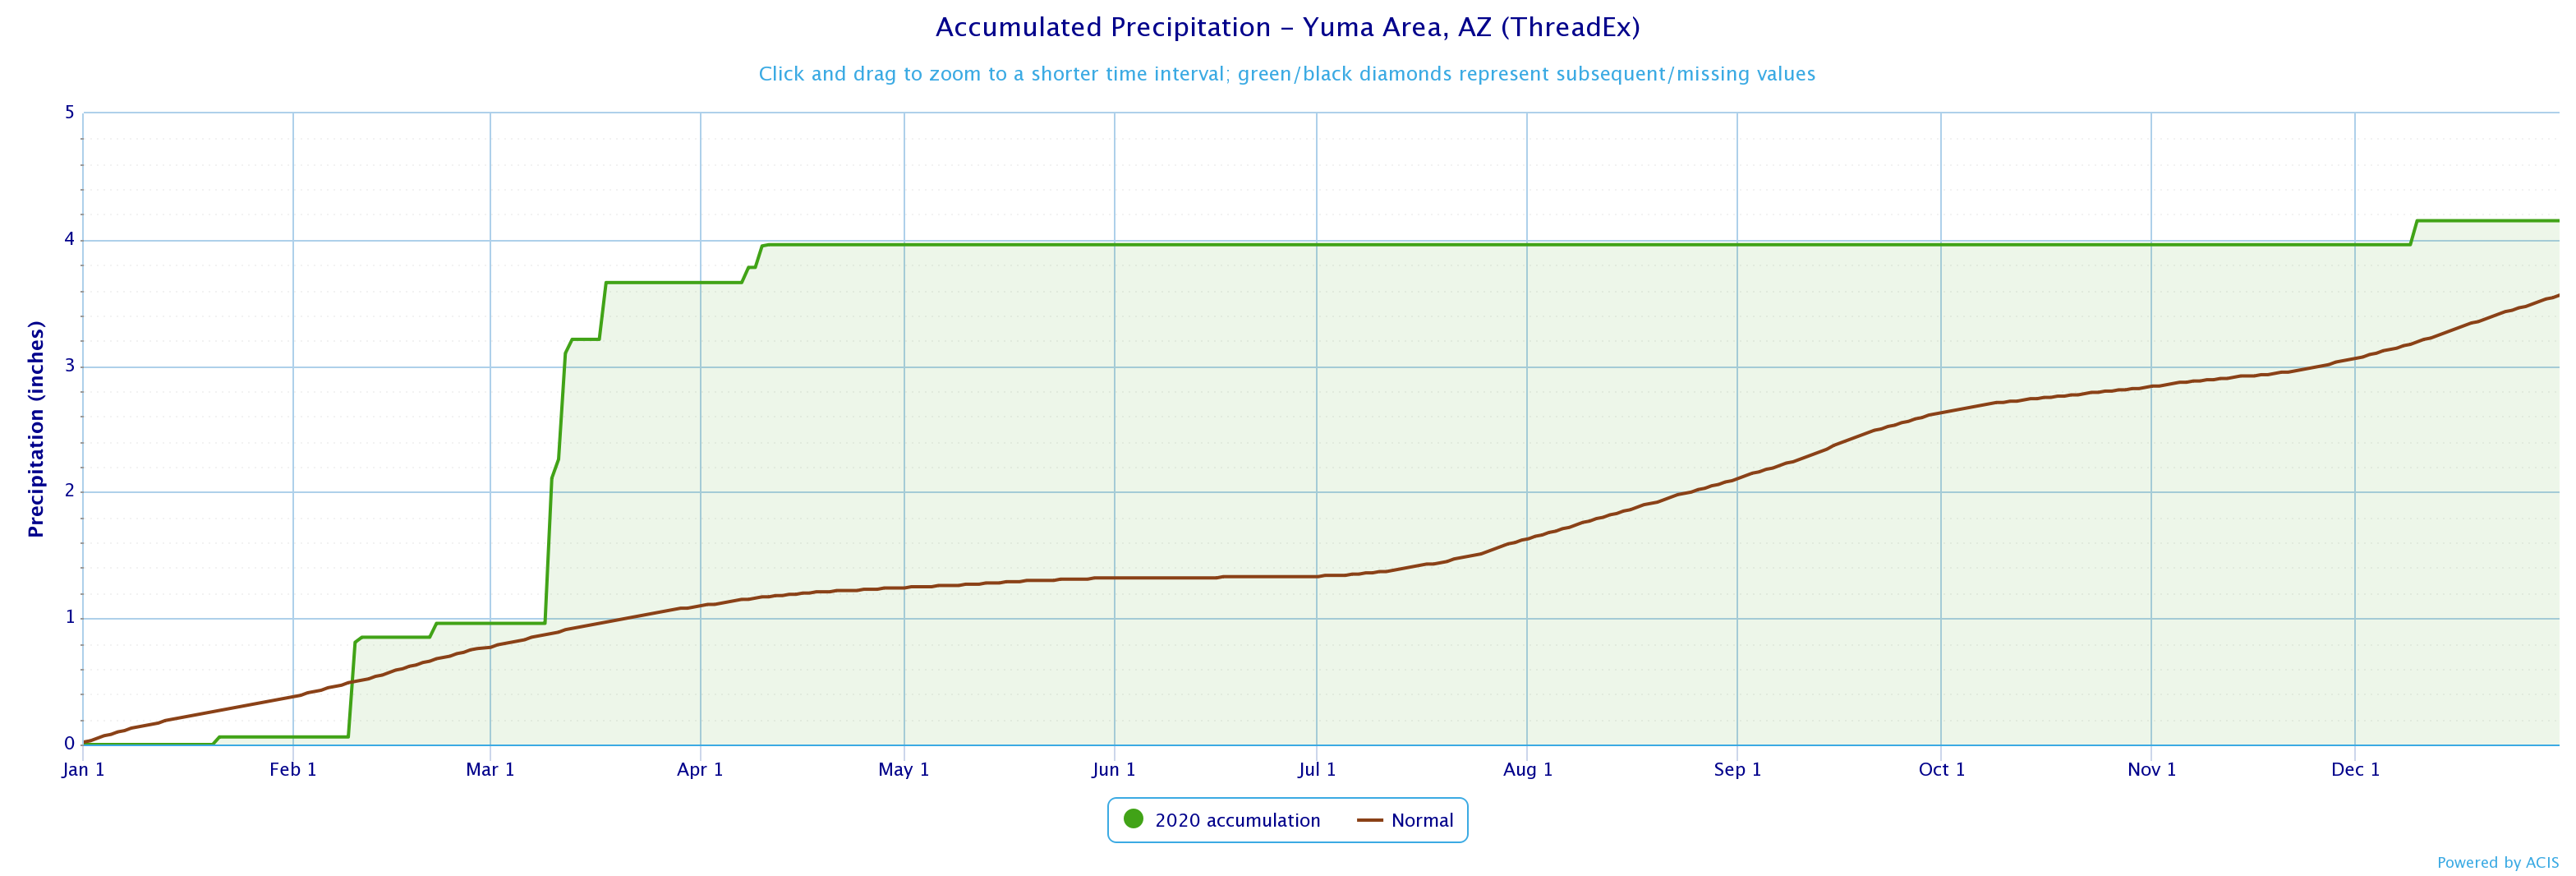
| 2020 Yuma Precipitation Statistics |
|---|
| Precip Total | Departure | Rank (1=Wettest, 143=Driest) | |
|---|---|---|---|
| Jan |
0.06
|
-0.31
|
87th
|
| Feb |
0.90
|
+0.51
|
19th
|
| Mar |
2.70
|
+2.37
|
2nd
|
| Apr |
0.30
|
+0.15
|
19th
|
| May |
0.00
|
-0.08
|
Tied 143rd
|
| Jun |
0.00
|
-0.01
|
Tied 143rd
|
| Jul |
0.00
|
-0.29
|
Tied 143rd
|
| Aug |
0.00
|
-0.47
|
Tied 143rd
|
| Sep |
0.00 |
-0.53 |
Tied 143rd |
| Oct |
0.00
|
-0.21
|
Tied 143rd
|
| Nov |
Trace
|
-0.22
|
Tied 143rd
|
| Dec |
0.19
|
-0.32
|
Tied 69th
|
(*** click on month for more comprehensive monthly summary ***)
| Yuma Record Daily Rainfall for 2020 |
|---|
| Date | Record | Previous Record |
|---|---|---|
| Mar 10 |
1.15
|
0.13 in 1986
|
| Mar 12 |
0.84
|
0.33 in 2019
|
| Mar 18 | 0.45 | 0.17 in 1982 |
| Apr 10 | 0.17 | 0.16 in 2016 |
| 2020 El Centro Precipitation Statistics |
|---|
| Precip Total | Departure | Rank (1=Wettest, 95=Driest) | |
|---|---|---|---|
| Jan |
Trace
|
-0.48
|
Tied 95th
|
| Feb |
0.42
|
-0.03
|
32nd
|
| Mar |
1.51
|
+1.15
|
3rd
|
| Apr |
0.58
|
+0.51
|
7th
|
| May |
0.00
|
-0.07
|
Tied 95th
|
| Jun |
0.00
|
-0.03
|
Tied 95th
|
| Jul |
0.00
|
-0.19
|
Tied 95th
|
| Aug |
Trace
|
-0.41
|
Tied 95th
|
| Sep |
0.00 |
-0.31 |
Tied 95th |
| Oct |
0.00
|
-0.33
|
Tied 95th
|
| Nov |
Trace
|
-0.20
|
Tied 95th
|
| Dec |
Trace
|
-0.54
|
Tied 95th
|
(*** click on month for more comprehensive monthly summary ***)
| El Centro Record Daily Rainfall for 2020 |
|---|
| Date | Record | Previous Record |
|---|---|---|
| Mar 9 |
0.14
|
0.13 in 1974
|
| Mar 10 | 0.95 | 0.39 in 1980 |
| Mar 12 |
0.31
|
0.05 in 1982
|
| Mar 18 | 0.08 - tied record | 0.08 in 1930 |
| Apr 10 | 0.50 | 0.05 in 2016 |
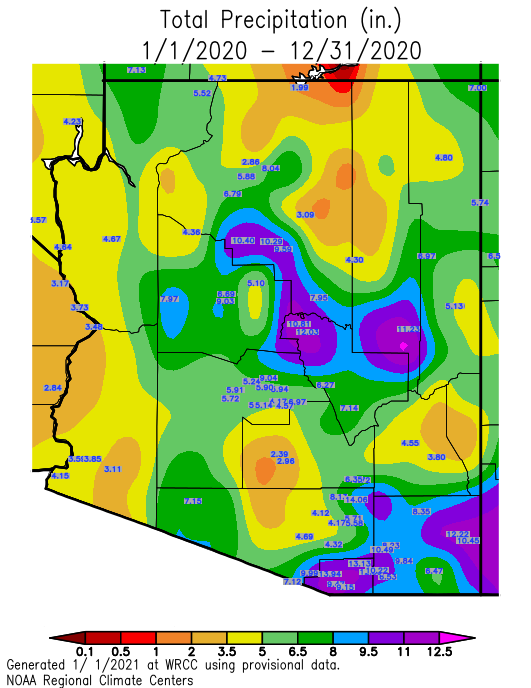
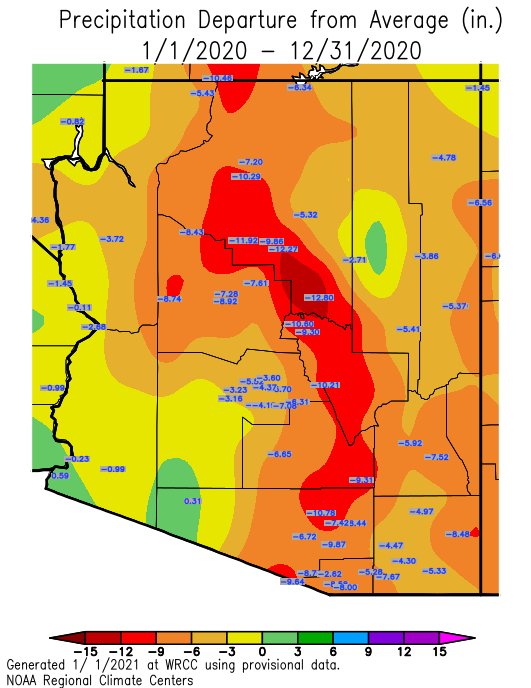
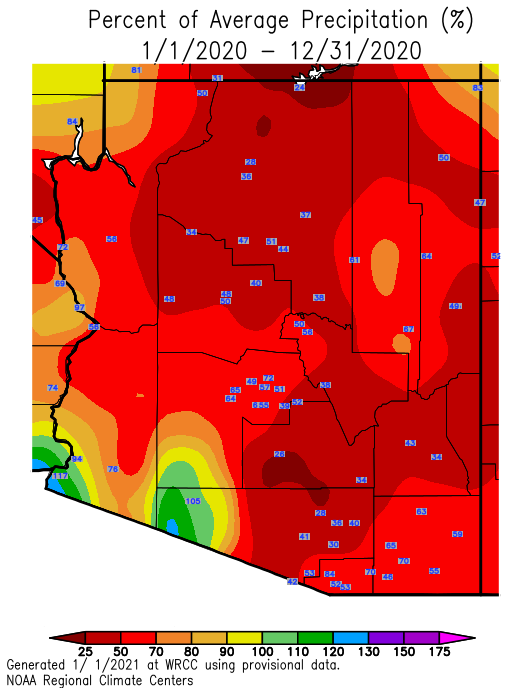
| Arizona Statewide Precipitation Maps (Data courtesy of Western Region Climate Center) |
|---|
|
Arizona 2020
Precipitation
 |
Arizona 2020 Precip Departure from normal
 |
Arizona 2020 Precip Percent Normal
 |
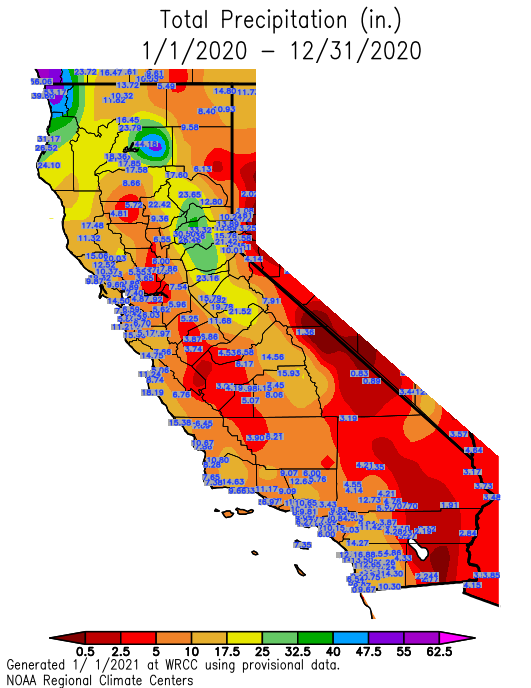
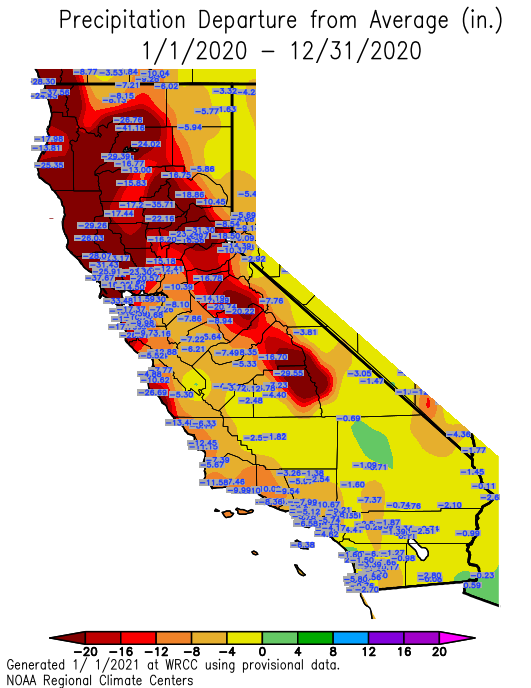
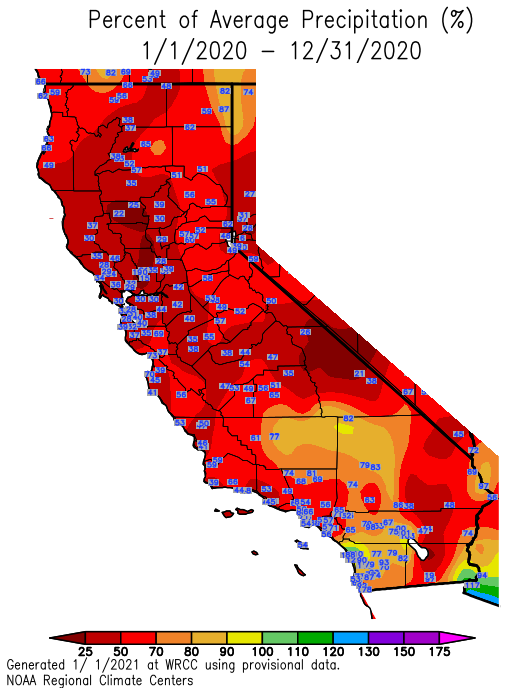
| California Statewide Precipitation Maps (Data courtesy of Western Region Climate Center) |
|---|
|
California 2020
Precipitation
 |
California 2020 Precip Departure from normal
 |
California 2020 Precip Percent Normal
 |
CLIMATE REPORT
NATIONAL WEATHER SERVICE PHOENIX AZ
245 PM MST SAT JAN 02 2021
...................................
...THE PHOENIX AZ CLIMATE SUMMARY FOR THE YEAR OF 2020...
CLIMATE NORMAL PERIOD 1981 TO 2010
CLIMATE RECORD PERIOD 1895 TO 2021
WEATHER OBSERVED NORMAL DEPART LAST YEAR'S
VALUE DATE(S) VALUE FROM VALUE
NORMAL
..............................................................
TEMPERATURE (F)
RECORD
HIGH 122 06/26/1990
LOW 16 01/07/1913
HIGHEST 118 07/30 114 4
LOWEST 35 02/04 35 0
02/05
AVG. MAXIMUM 89.5 86.7 2.8
AVG. MINIMUM 64.9 63.5 1.4
MEAN 77.2 75.1 2.1
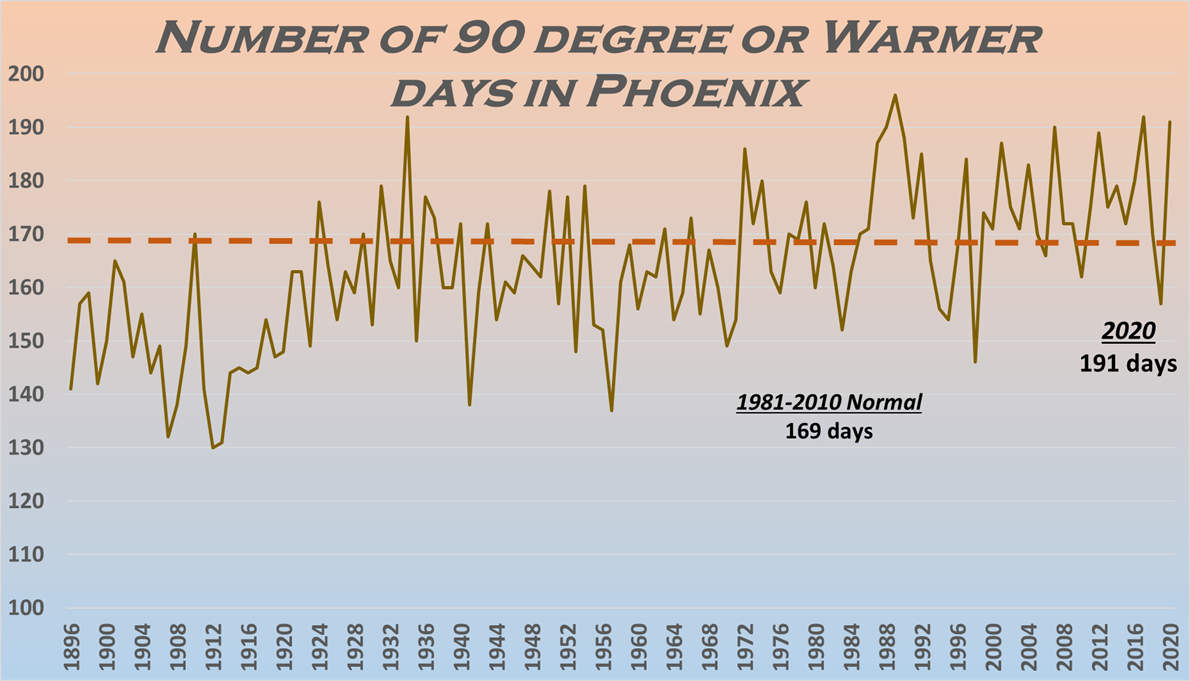
DAYS MAX >= 90 191 169.0 22.0
DAYS MAX <= 32 0 0.0 0.0
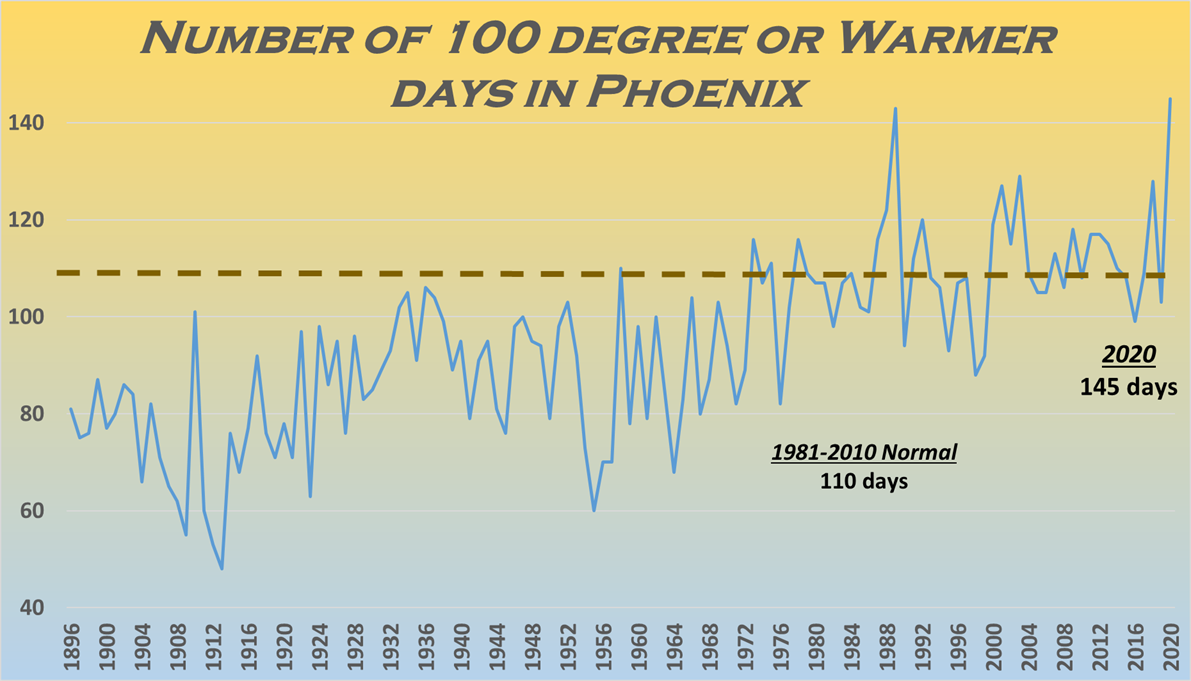
DAYS MAX >= 100 145
DAYS MAX >= 110 53
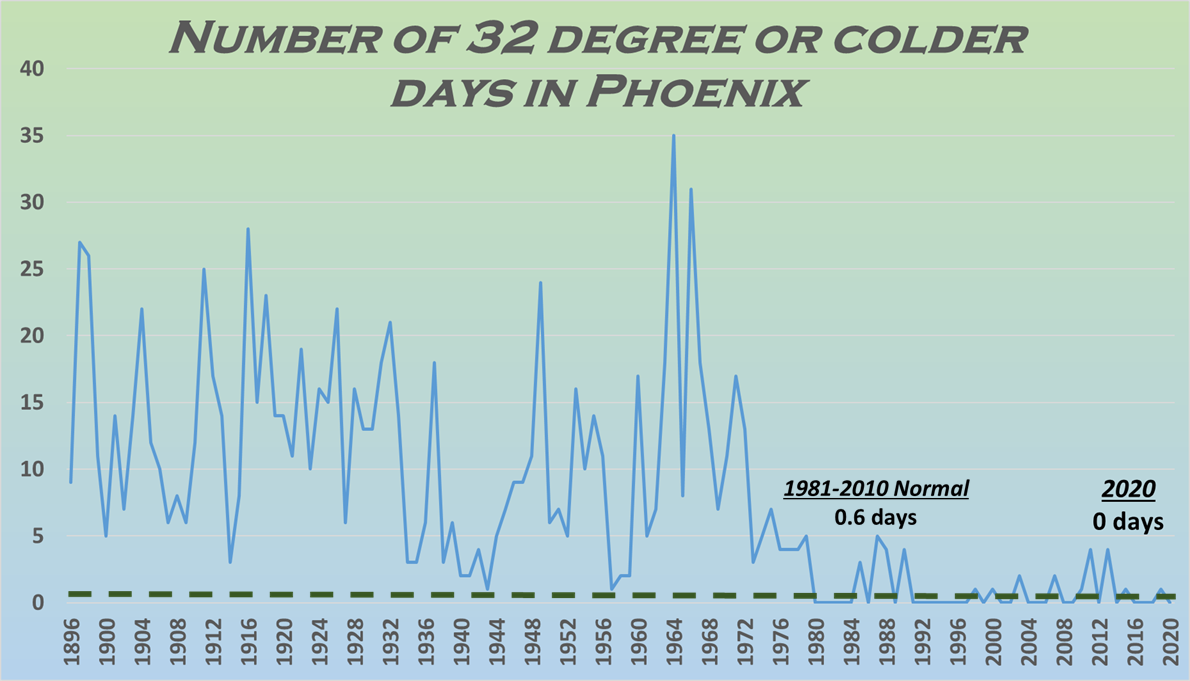
DAYS MIN <= 32 0 0.4 -0.4
DAYS MIN <= 0 0 0.0 0.0
DAYS MIN >= 90 28
PRECIPITATION (INCHES)
RECORD
MAXIMUM 19.73 1905
MINIMUM 2.82 2002
TOTALS 5.00 8.03 -3.03
DAYS >= .01 15 36.6 -21.6
DAYS >= .10 11 18.7 -7.7
DAYS >= .50 3 4.5 -1.5
DAYS >= 1.00 1 1.3 -0.3
GREATEST
24 HR. TOTAL 1.04 02/22 TO 02/22
DEGREE DAYS
HEATING TOTAL 841 935 -94
SINCE 7/1 367 397 -30
COOLING TOTAL 5419 4608 811
SINCE 1/1 5419 4607 812
..............................................................
WIND (MPH)
AVERAGE WIND SPEED 6.2
HIGHEST GUST SPEED/DIRECTION 59/090 DATE 08/17
AVERAGE RH (PERCENT) 30
WEATHER CONDITIONS. NUMBER OF DAYS WITH
THUNDERSTORM 11 HEAVY RAIN 4
RAIN 8 LIGHT RAIN 22
FOG W/VIS <= 1/4 MILE 0
- INDICATES NEGATIVE NUMBERS.
R INDICATES RECORD WAS SET OR TIED.
MM INDICATES DATA IS MISSING.
T INDICATES TRACE AMOUNT.
CLIMATE REPORT
NATIONAL WEATHER SERVICE PHOENIX AZ
245 PM MST SAT JAN 02 2021
...................................
...THE YUMA AZ CLIMATE SUMMARY FOR THE YEAR OF 2020...
CLIMATE NORMAL PERIOD 1981 TO 2010
CLIMATE RECORD PERIOD 1876 TO 2021
WEATHER OBSERVED NORMAL DEPART LAST YEAR'S
VALUE DATE(S) VALUE FROM VALUE
NORMAL
..............................................................
TEMPERATURE (F)
RECORD
HIGH 124 07/28/1995
LOW 22 01/24/1937
12/26/1911
01/20/1883
HIGHEST 120 09/05 115 5
LOWEST 39 01/02 36 3
01/08
12/31
AVG. MAXIMUM MM 88.3 MM
AVG. MINIMUM 63.3 63.4 -0.1
MEAN MM 75.9 MM
DAYS MAX >= 90 MM 174.8 MM
DAYS MAX <= 32 0 0.0 0.0
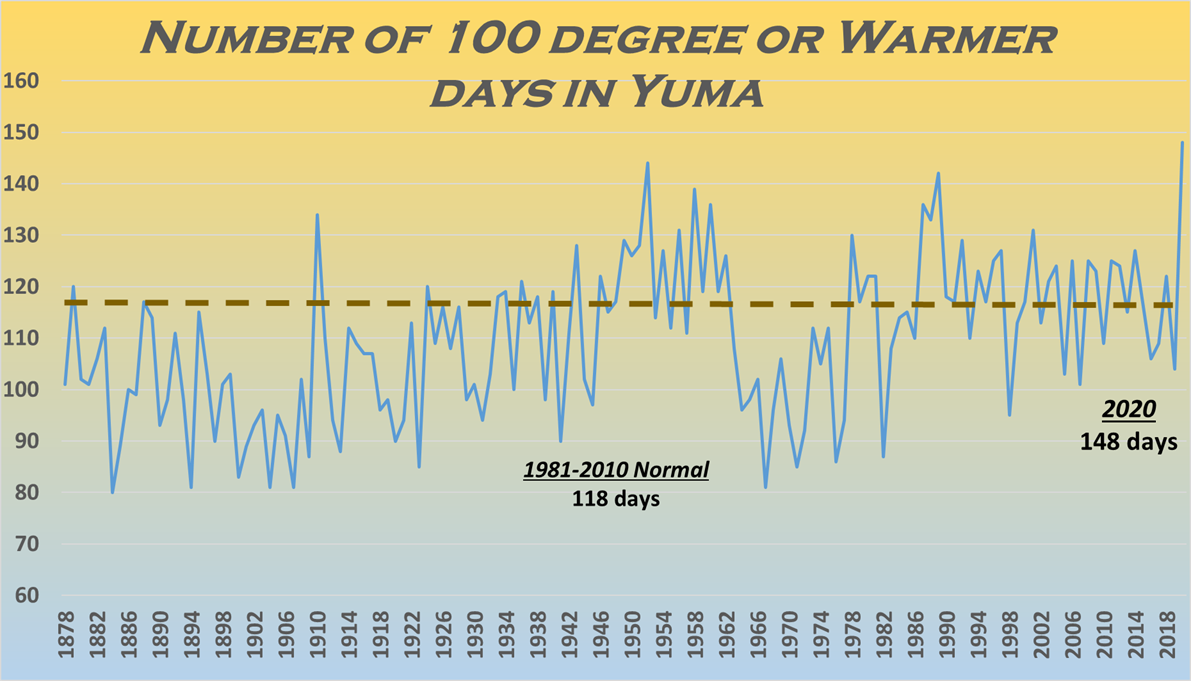
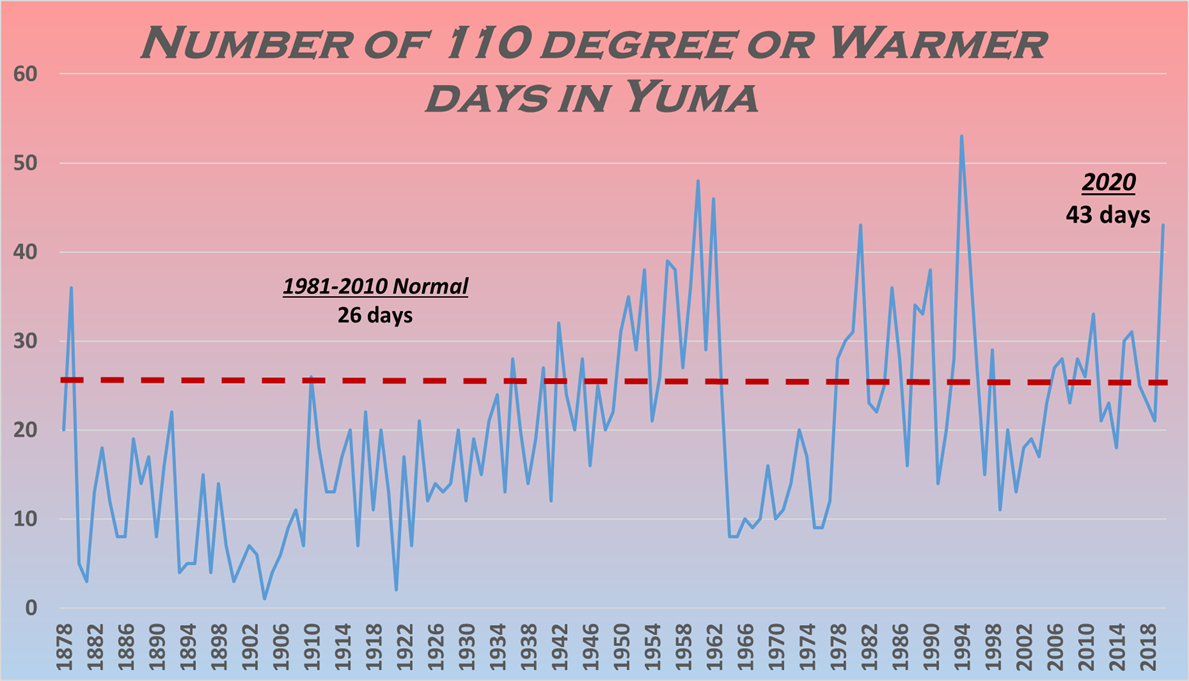
DAYS MAX >= 100 MM
DAYS MAX >= 110 MM
DAYS MIN <= 32 0 0.1 -0.1
DAYS MIN <= 0 0 0.0 0.0
DAYS MIN >= 90 MM
PRECIPITATION (INCHES)
RECORD
MAXIMUM 11.41 1905
MINIMUM 0.03 2002
TOTALS 4.15 3.56 0.59
DAYS >= .01 13 17.4 -4.4
DAYS >= .10 10 8.6 1.4
DAYS >= .50 3 1.9 1.1
DAYS >= 1.00 1 0.5 0.5
GREATEST
24 HR. TOTAL MM
DEGREE DAYS
HEATING TOTAL MM 687 MM
SINCE 7/1 MM 300 MM
COOLING TOTAL MM 4650 MM
SINCE 1/1 MM 4651 MM
..............................................................
WIND (MPH)
AVERAGE WIND SPEED 6.7
HIGHEST GUST SPEED/DIRECTION 45/250 DATE 04/08
AVERAGE RH (PERCENT) 35
WEATHER CONDITIONS. NUMBER OF DAYS WITH
THUNDERSTORM 7 HEAVY RAIN 2
RAIN 4 LIGHT RAIN 15
FOG W/VIS <= 1/4 MILE 2
- INDICATES NEGATIVE NUMBERS.
R INDICATES RECORD WAS SET OR TIED.
MM INDICATES DATA IS MISSING.
T INDICATES TRACE AMOUNT.
CLIMATE REPORT
NATIONAL WEATHER SERVICE PHOENIX AZ
245 PM MST SAT JAN 02 2021
...................................
...THE IMPERIAL CA CLIMATE SUMMARY FOR THE YEAR OF 2020...
CLIMATE NORMAL PERIOD 1981 TO 2010
CLIMATE RECORD PERIOD 1925 TO 2021
WEATHER OBSERVED NORMAL DEPART LAST YEAR'S
VALUE DATE(S) VALUE FROM VALUE
NORMAL
..............................................................
TEMPERATURE (F)
RECORD
HIGH 122 06/20/2017
LOW 16 01/22/1937
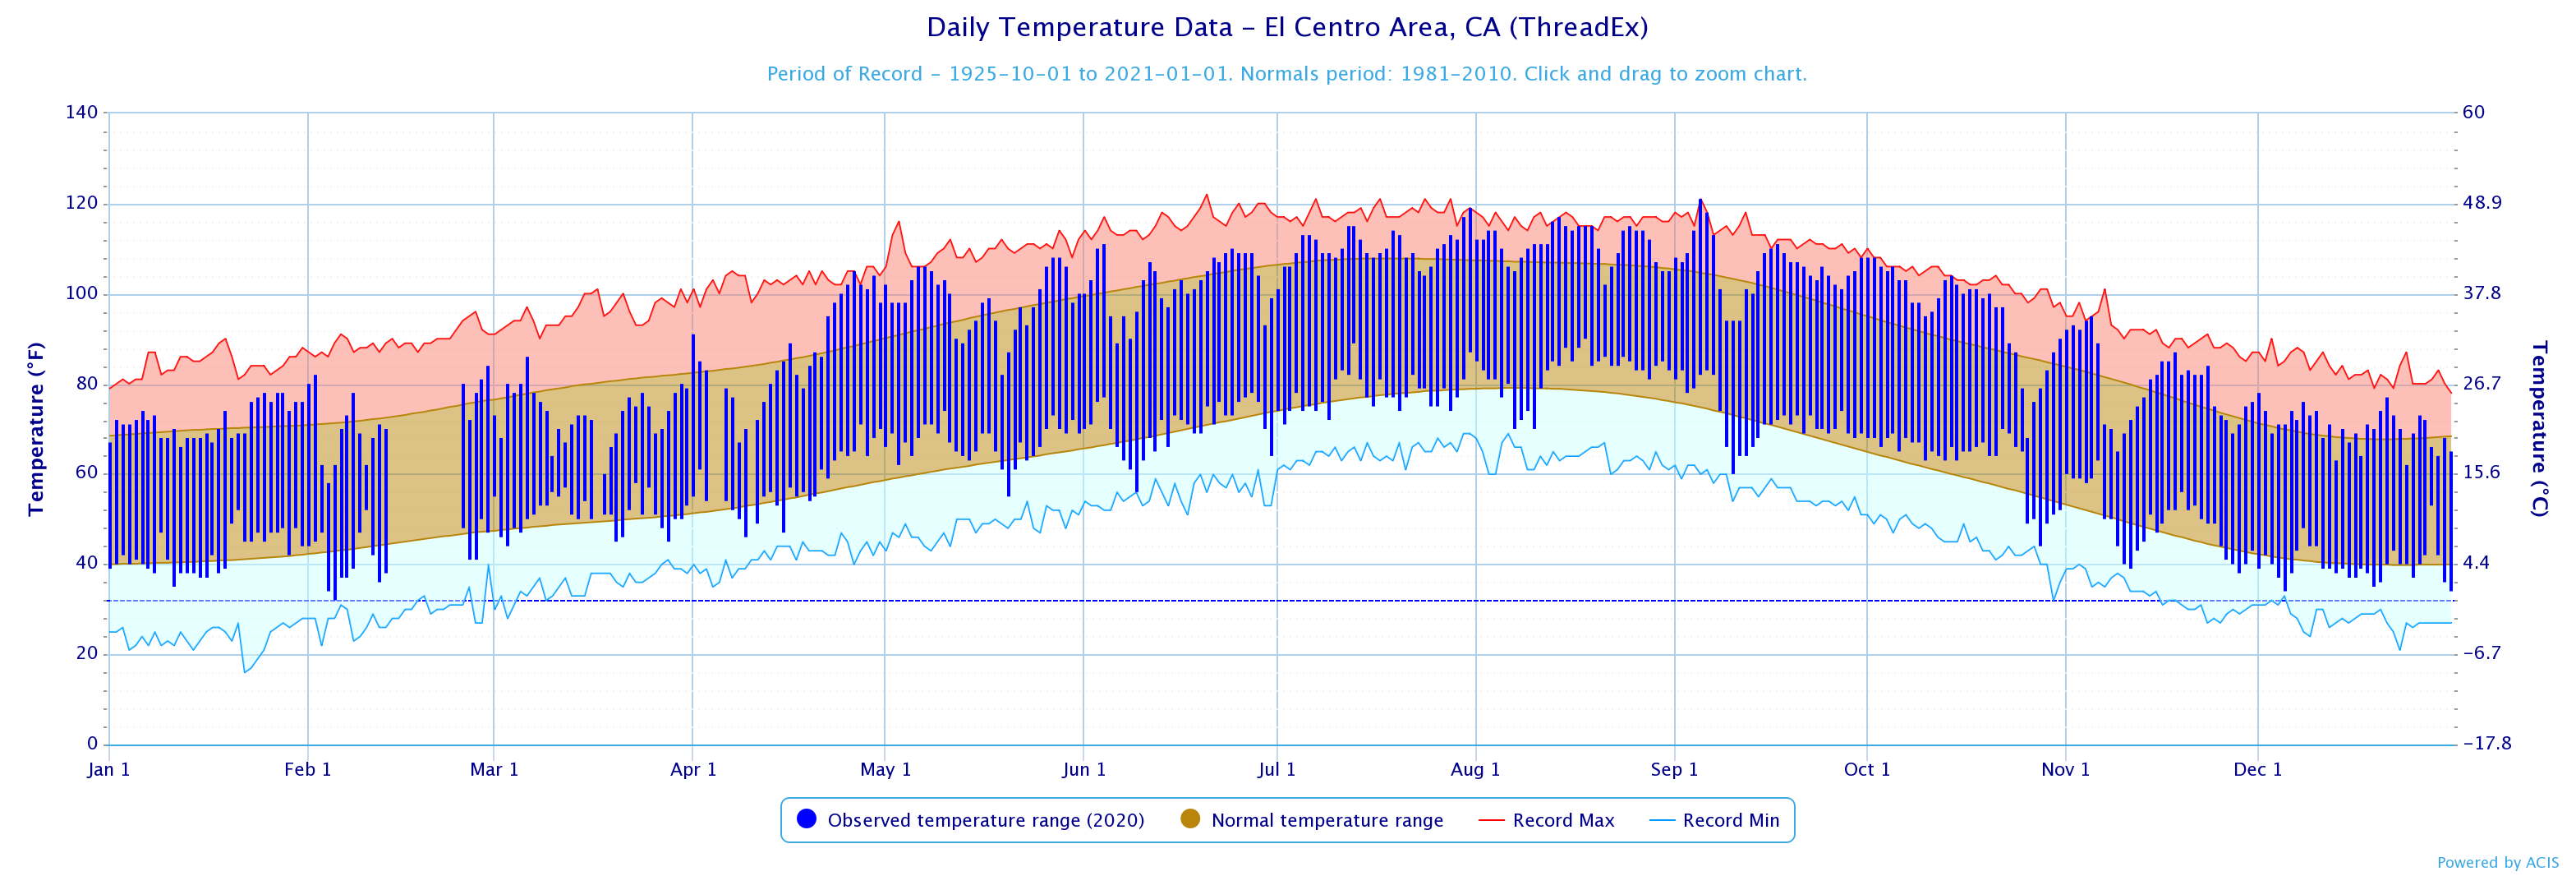
HIGHEST 121 09/05 116 5
LOWEST 32 02/05 31 1
AVG. MAXIMUM 90.1 88.1 2.0
AVG. MINIMUM 59.8 57.9 1.9
MEAN 74.9 73.0 1.9
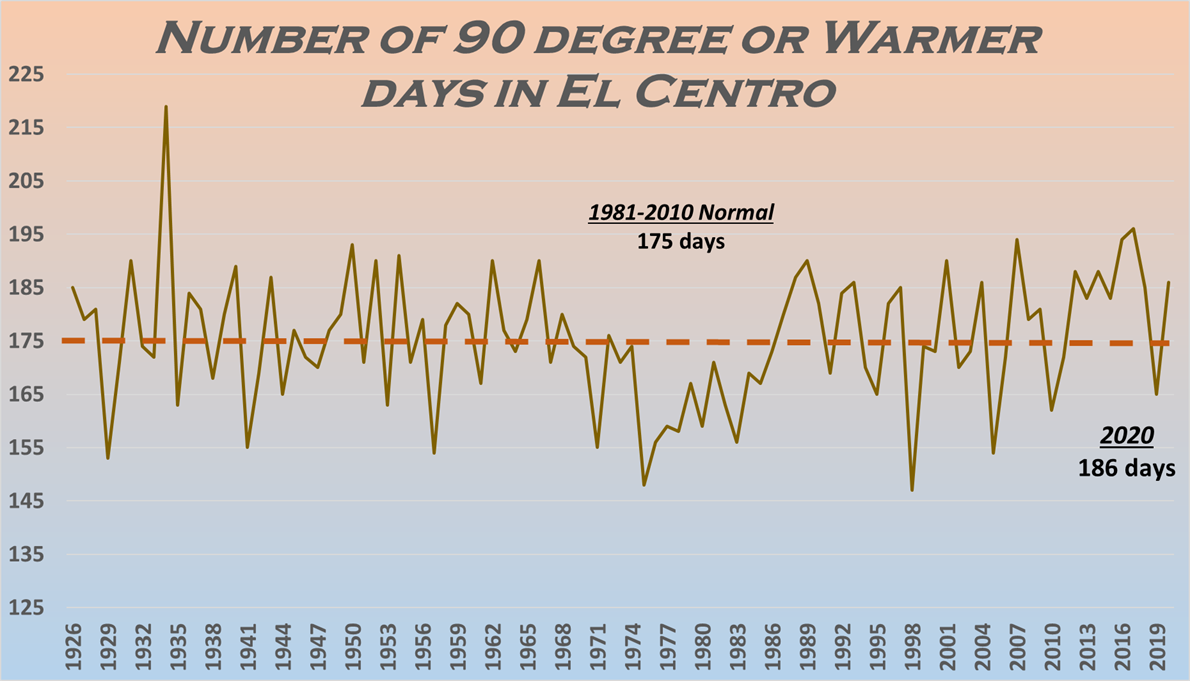
DAYS MAX >= 90 187 175.0 12.0
DAYS MAX <= 32 0 0.0 0.0
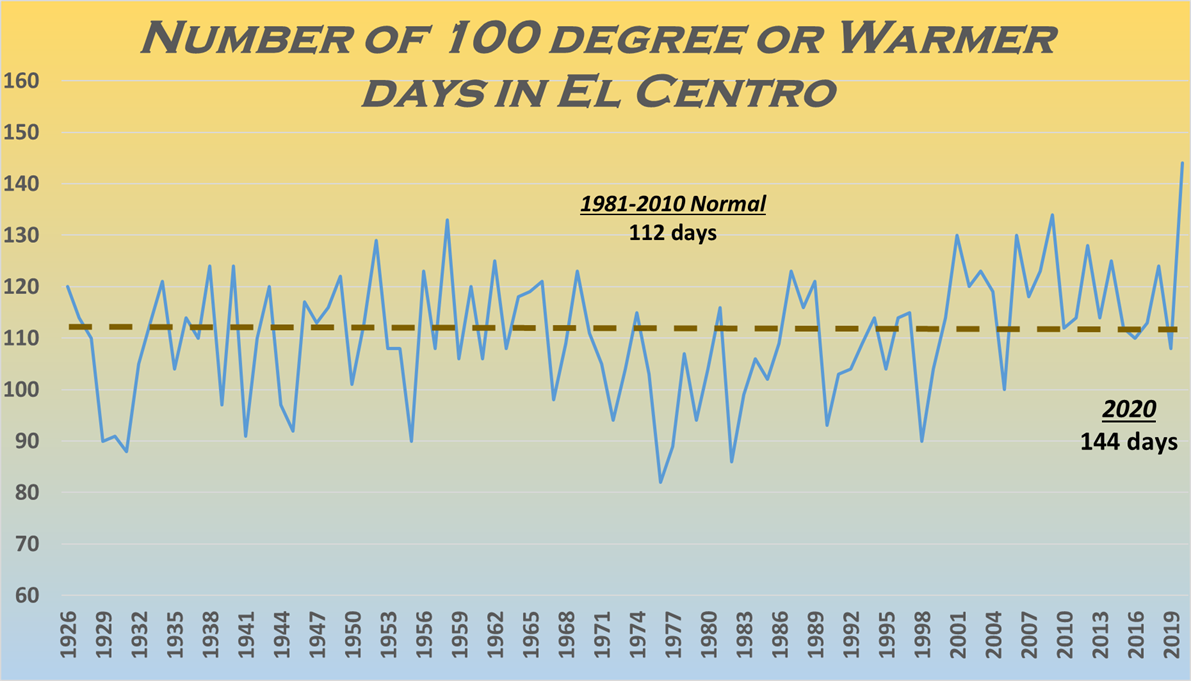
DAYS MAX >= 100 144
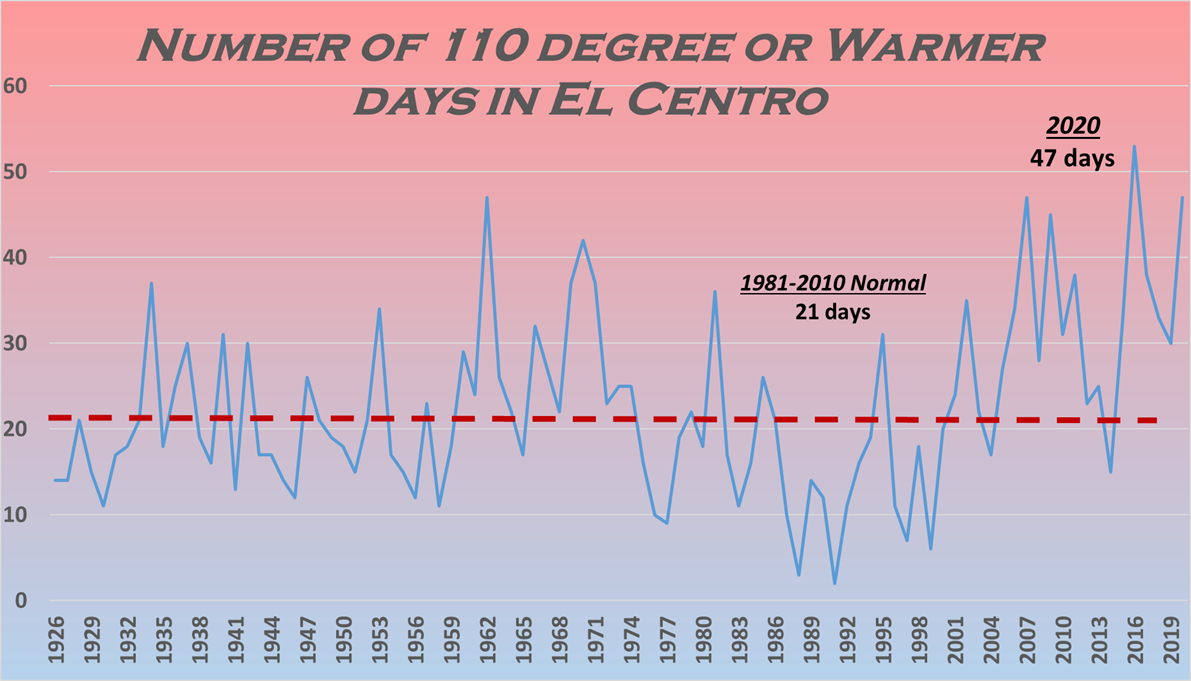
DAYS MAX >= 110 47
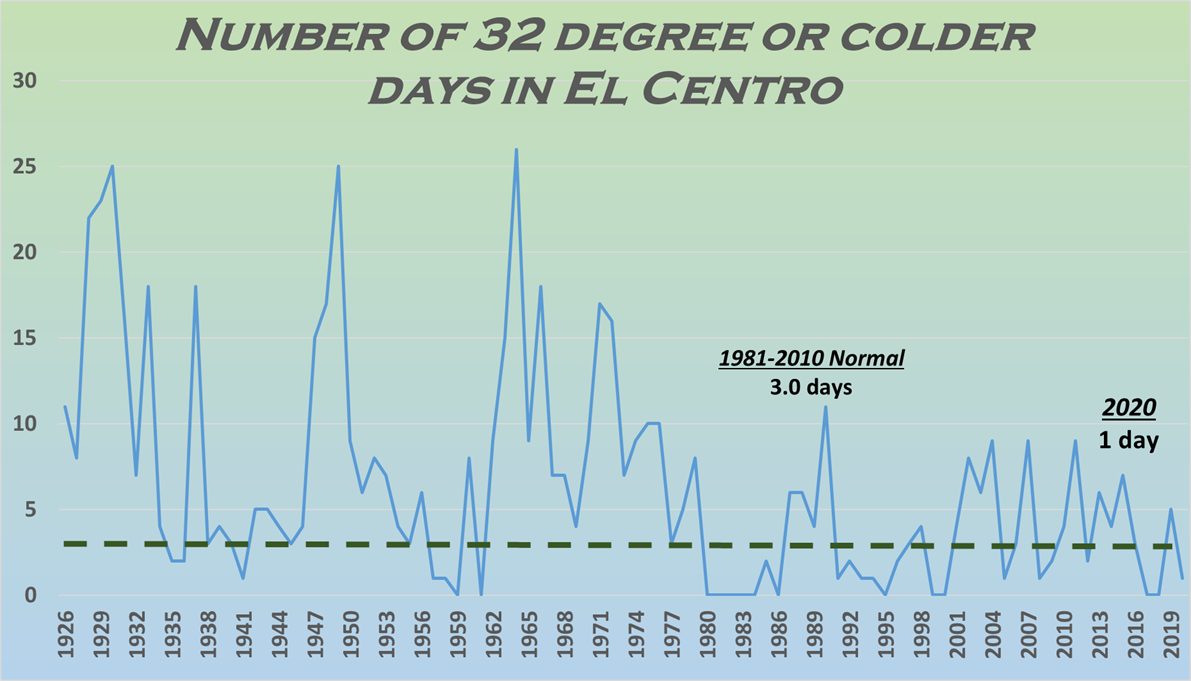
DAYS MIN <= 32 1 3.8 -2.8
DAYS MIN <= 0 0 0.0 0.0
DAYS MIN >= 90 1
PRECIPITATION (INCHES)
RECORD
MAXIMUM 5.72 1983
MINIMUM 0.16 1956
TOTALS 2.51 3.44 -0.93
DAYS >= .01 8 16.0 -8.0
DAYS >= .10 5 7.0 -2.0
DAYS >= .50 2 2.0 0.0
DAYS >= 1.00 0 0.0 0.0
GREATEST
24 HR. TOTAL 0.95 03/10 TO 03/10
DEGREE DAYS
HEATING TOTAL 896 1029 -133
SINCE 7/1 410 452 -42
COOLING TOTAL 4649 3977 672
SINCE 1/1 4649 3977 672
..............................................................
WIND (MPH)
AVERAGE WIND SPEED 6.6
HIGHEST GUST SPEED/DIRECTION 51/260 DATE 11/07
AVERAGE RH (PERCENT) 36
WEATHER CONDITIONS. NUMBER OF DAYS WITH
THUNDERSTORM 5 HEAVY RAIN 2
RAIN 5 LIGHT RAIN 13
FOG W/VIS <= 1/4 MILE 3
- INDICATES NEGATIVE NUMBERS.
R INDICATES RECORD WAS SET OR TIED.
MM INDICATES DATA IS MISSING.
T INDICATES TRACE AMOUNT.


 Follow us on YouTube