|
|
||
| Average Date | October 22nd | |
| Earliest Date | September 29th, 1942 | |
| Latest Date | November 19th, 2002 | |
|
|
||
| Average Date | October 25th | |
| Earliest Date | October 2nd, 2003 | |
| Latest Date | November 16th, 1946 | |
|
|
||
| Average Date | October 27th | |
| Earliest Date | October 3rd, 1974 | |
| Latest Date | November 17th, 1970 | |
|
|
||
| Average Date | October 10th | |
| Earliest Date | September 5th, 1982 | |
| Latest Date | November 8th, 2004 | |
|
|
||
| Average Date | October 21st | |
| Earliest Date | September 24th, 1989 | |
| Latest Date | November 12th, 2016 | |
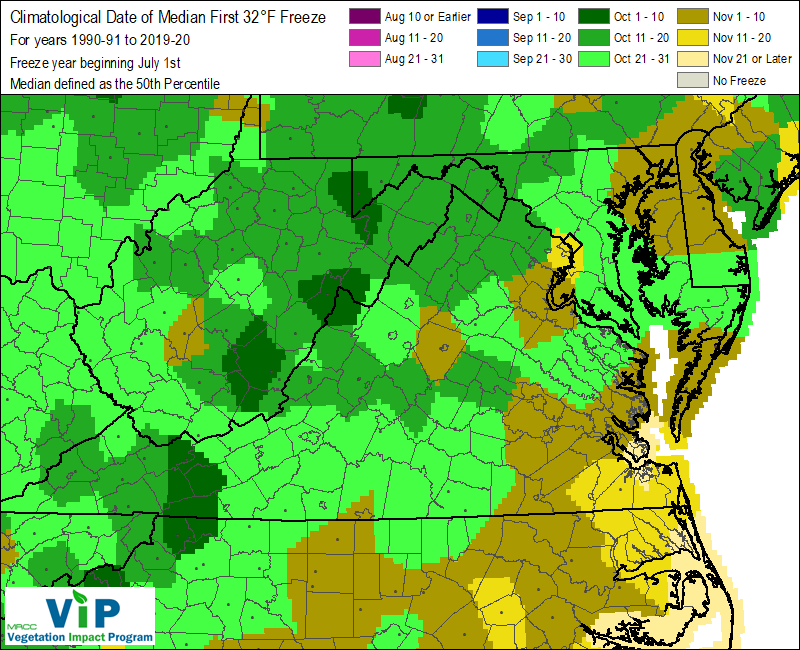
Below is a map for the average (50%) date of the first Fall freeze. This map uses data from a slightly different timeframe from the data above. The data below was compiled using the NCDC Climate data from the 30 year period of record spanning the years between 1981 and 2010. This difference in time periods accounts for the slight difference in the Median dates for the first freeze.