Southeast RFC
River Forecast Center
These graphs are automated model output produced every three hours. To collaborate on the inflow guidance please call our office...770-486-0028 ext 1.
<center>
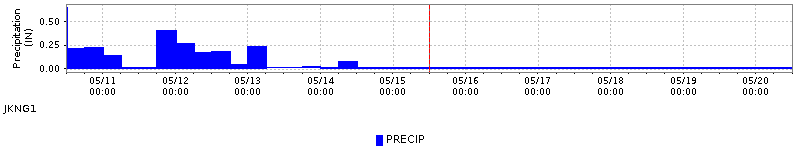
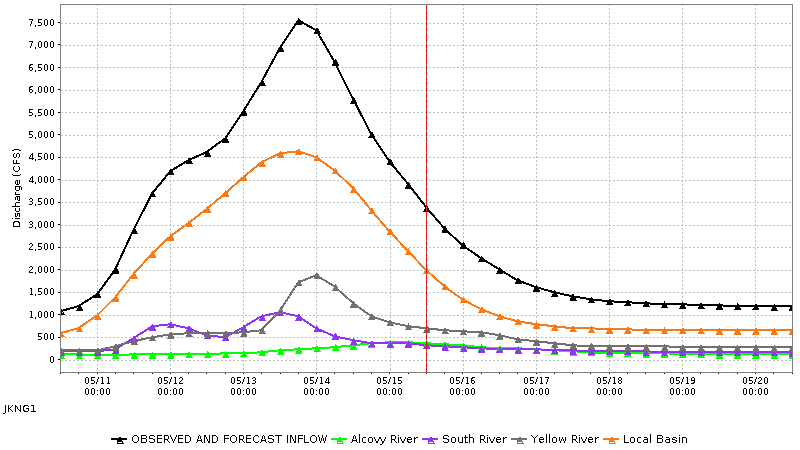
| Jackson Dam Gridded Precipitation Areal Mean Estimate IN | INFLOW River Discharge Simulated Instantaneous CFS | |
|---|---|---|
| 05/23/2026 00GMT | 0.44 | 549.26 |
| 05/23/2026 06GMT | 0.07 | 595.53 |
| 05/23/2026 12GMT | 0.02 | 683.15 |
| 05/23/2026 18GMT | 0.07 | 802.35 |
| 05/24/2026 00GMT | 0.22 | 915.23 |
| 05/24/2026 06GMT | 0.06 | 963.04 |
| 05/24/2026 12GMT | 0.00 | 1069.25 |
| 05/24/2026 18GMT | 0.00 | 1216.82 |
| 05/25/2026 00GMT | 0.05 | 1262.78 |
| 05/25/2026 06GMT | 0.02 | 1180.41 |
| 05/25/2026 12GMT | 0.00 | 1080.64 |
| 05/25/2026 18GMT | 0.05 | 998.11 |
| 05/26/2026 00GMT | 0.88 | 971.92 |
| 05/26/2026 06GMT | 0.00 | 1236.72 |
| 05/26/2026 12GMT | 0.02 | 1795.28 |
| 05/26/2026 18GMT | 0.12 | 2284.96 |
| 05/27/2026 00GMT | 0.39 | 2548.72 |
| 05/27/2026 06GMT | 0.00 | 2383.84 |
| 05/27/2026 12GMT | 0.00 | 2211.53 |
| 05/27/2026 18GMT | 0.00 | 2905.44 |
| 05/28/2026 00GMT | 0.02 | 3569.13 |
| 05/28/2026 06GMT | 0.02 | 3255.73 |
| 05/28/2026 12GMT | 0.00 | 2811.14 |
| 05/28/2026 18GMT | 0.00 | 2463.43 |
| 05/29/2026 00GMT | 0.02 | 2142.56 |
| 05/29/2026 06GMT | 0.03 | 1808.49 |
| 05/29/2026 12GMT | 0.00 | 1484.14 |
| 05/29/2026 18GMT | 0.04 | 1273.92 |
| 05/30/2026 00GMT | 0.24 | 1135.37 |
| 05/30/2026 06GMT | 0.00 | 1037.12 |
| 05/30/2026 12GMT | 0.00 | 984.65 |
| 05/30/2026 18GMT | 0.00 | 1012.40 |
| 05/31/2026 00GMT | 0.00 | 1069.67 |
| 05/31/2026 06GMT | 0.00 | 1042.97 |
| 05/31/2026 12GMT | 0.00 | 961.17 |
| 05/31/2026 18GMT | 0.00 | 866.83 |
| 06/01/2026 00GMT | 0.00 | 765.07 |
| 06/01/2026 06GMT | 0.00 | 679.26 |
| 06/01/2026 12GMT | 0.00 | 619.44 |
| 06/01/2026 18GMT | 0.00 | 579.82 |
| 06/02/2026 00GMT | 0.00 | 554.60 |
</center>
US Dept of Commerce
National Oceanic and Atmospheric Administration
National Weather Service
Southeast RFC
4 Falcon Drive
Peachtree City, GA 30269
770-486-0028
Comments? Questions? Please Contact Us.

