 |
|
NOAA Central Library Brown Bag Seminar Probabilistic Subseasonal Weather Forecasts for the Energy Sector |
|
|
June 3, 2020 The NOAA Central Library invited Dr. Judith Curry of Climate Forecast Application Network (CFAN) to give a Brown Bag Seminar on probabilistic subseasonal weather forecasts for the energy sector, a project supported by NOAA under the Small Business Innovation Research (SBIR) program. The talk focused on forecast innovations on subseasonal time scales, such as the ‘forecast window opportunity’ approach, probability of extreme weather event, ensemble calibration, multi-model approach, and advanced online decision support tool. Forecast examples for the energy sector were illustrated. The products included both anomalies from mean and measures of the extreme event. Ensemble interpretation approach incorporated quantile probabilities, ensemble clustering, and creation of synthetic ensembles. To make objective evaluation of forecast confidence, ‘forecast window opportunity’ approach was applied to identify windows of time and space where expected skill was higher than usual because of the presence of curtain phase of large scale circulation pattern that was guided by historical predictability analysis. The prediction skill was largely enhanced by calibration, which corrected biases and distributional errors. For U.S. temperature and the interpretation of heat/cold wave, the consensus forecast, which used adaptive weighting scheme for all of the forecast streams based on recent error statistics, outperformed European Center for Medium Range Weather Forecast (ECMWF) ensemble mean (Fig. 1) and Global Forecast System (GFS) Model Output Statistics (MOS) forecasts. For subseasonal prediction of 100-m wind speed in the western U.S., ECMWF forecasts showed skill out to ~17 days, and further skill improvement by CFAN’s calibration, particularly for ‘high wind’ cases. The advantage of CFAN’s calibration and ensemble interpretation in extending the predictability of tropical cyclones was also highlighted by the end. In closing, Dr. Curry looked forward to the prospects of additional advances of subseasonal to seasonal forecasting and pointed out the primary skill appears to be from identification of extreme event probability, appropriate ensemble interpretation, and identification of forecast windows of opportunity. It is advantageous to use a multi-model approach. In addition to the ECMWF model, incorporation of more improved models, such as the extended Global Ensemble Forecast System (GEFS), is anticipated. The most promising frontier is developing hybrid statistical-dynamical forecast models, of which there are two types: 1) use a global dynamic model to predict the primary circulation regimes and then apply a statistical model to translate these regimes to surface weather, and 2) identify relevant circulation patterns using statistical forecast system and then cluster the global model ensemble based on the circulation patterns to inform the surface forecast. Finally, there is a broad need for more climate dynamics research on the subseasonal to seasonal timescales, in particular the Global Atmospheric Angular Momentum (GLAAM) and Global Weather Oscillations (GWO), which seem to be largely untapped in operational forecast research on subseasonal timescales. (This presentation was recorded by NOAA Central Library and is available at https://youtu.be/0mcHLJ3UpFA) |
CFAN operational 15 day probabilistic minimum temperature forecast initialized on 5/2/2019. The top panel shows the probability density function (pdf) distribution from the raw uncalibrated ECMWF ensemble with the light green bounding 90th percentile of ensemble members. The dash line shows the climatological temperature, the blue line the actual observation, and the red line the CFAN main forecast. The size of the red arrow indicates the distance between the climatology and the 60th percentile represented by the border between the yellow and orange. The larger the distance the higher the probability of the cold wave. The bottom panel shows the same as the top panel, except for the pdf from the CFAN calibrated ECMWF ensemble, using the quantile-to-quantile distribution adjustment. It shows a subtle shift of the distribution downwards but also broadening of the overall distribution. Compare the size of the red arrows of the raw Tmin vs. the calibrated Tmin, the calibrated ECMWF pdf produced the higher probability of cold wave. |
|
North American Multi-Model Ensemble Teleconference Make Initialized Forecasts with No Additional Integration Needed by Analog Model of the Model – A Promising Development in Data Mining for Long-lead Climate Prediction |
|
|
May 7, 2020 Dr. Matthew Newman of Cooperative Institute for Research in Environmental Sciences (CIRES), University of Colorado and NOAA Physical Sciences Laboratory (PSL) was invited to give a webinar on Mining Large Climate Model Data Sets to Make Multi-year Initialized Global SST Forecasts. The study used an innovative model-analog technique (Ding et al. 2018, 2019), which first finds the closest matches (“analogs”) to initial observed anomalies from a long (500+ years) coupled general circulation model (CGCM) control simulation. For the observed state, the analog ensemble is the k (~10-20 seems to be enough) nearest states defined by root-mean-square (RMS) distance. The analogs are defined only by matching equally weighted observed sea surface temperature (SST) / sea surface height (SSH) anomalies within some specified region. Then, the forecast for all model variables (not just SST/SSH) is made by an ensemble of analog evolution. The results showed promise, in that (1) Some El Niño-Southern Oscillation (ENSO) events are predictable two or more years ahead, and may be identified beforehand by ensemble-mean signal-to-noise ratio (See figure); and (2) long-lead initialized skill also exists in SW Indian Ocean and western South Pacific, but less so for the Pacific Decadal Oscillation (PDO), whose skill depends on ENSO there. The study revealed that initializing directly on the model attractor has advantages of identical bias correction, initialization state in model space without initialization shock, and forecast errors that are more directly related to model error (Ding et al. 2020). The implications of making extension applications to North American Multi-Model Ensemble (NMME) hindcast datasets were discussed. In the end of the talk, Dr. Newman encouraged the audience to ask “is it more efficient to use machine learning techniques to ‘make a model of the model,’ or to run large traditional assimilation-initialized hindcasts?” when looking to develop operational forecast tools today. |
Long-lead ENSO forecasts of opportunity. Top: Niño3.4 observations (the bottom row, same as black line in the bottom panel), “Month 0” model-analog reconstruction (same as white line in the bottom panel), and hindcasts for leads of 1-36 months. Contours show where 62.5% of hindcast ensemble members are predicted in the upper/lower tercile. Middle: Forecast signal-to-noise ratio (SNR); SNR < 0.75 are not shaded. Contours show where ensemble means verified as either hit (solid) or false alarm (dashed); contours also not shown for SNR < 0.75. Bottom: Observed NinÞo3.4 time series (black) compared with model-analog reconstruction (white); green indicates model-analog initial spread. For the Gaussian ensemble, SNR = 0.75 indicates 62.5% ensemble members shift to the predicted tercile. Above this threshold, most model-analog ensemble-mean forecasts appear to be hits. |
|
References Ding, H., M. Newman, M. A. Alexander, and A. T. Wittenberg, 2018: Skillful climate forecasts of the tropical Indo-Pacific ocean using model-analogs. J. Climate, 31, 5437-5459, doi: 10.1175/JCLI-D-17-0661.1. ―, ―, ―, and ―, 2019: Diagnosing secular variations in retrospective ENSO seasonal forecast skill using CMIP5 model-analogs. Geophys. Res. Lett., 46, 1721-1730, doi: 10.1029/2018GRL080598. ―, ―, ―, and ―, 2020: Relating CMIP5 model biases to seasonal forecast skill in the tropical Pacific. Geophys. Res. Lett., 47, e2019GL086765, doi: 10.1029/2019GL086765. |
|
|
Climate Dynamics Webinar, George Mason University Understanding seasonal predictability of ENSO and US precipitation using CFSv2 reforecasts of sixty years (1958-2017) |
|
|
March 25, 2020 Department of Atmospheric, Oceanic & Earth Sciences, George Mason University (AOES/GMU) hosted a webinar for Prof. Bohua Huang to give an update in understanding seasonal predictability of ENSO and US precipitation based on his recent experiments using NCEP Climate System Version 2 (CFSv2) ensemble seasonal reforecasts of sixty years from 1958 to 2017 (Huang et al. 2017, 2019). For ENSO prediction, overall skill is comparable before and after 1979 (See figure.) although observations, particularly over the ocean, have been significantly improved in the later period. In particular, the prediction skill of the onset and development of ENSO events in 1958–78 is comparable to that for 1979–2014, with the ENSO predictions initialized in April during 1958–78 even showing higher skill in summer. However, the skill of the earlier predictions declines faster in the ENSO decaying phase, because the reforecasts initialized after boreal summer persistently predict lingering wind and SST anomalies over the eastern equatorial Pacific, making the model events longer than their observed counterparts. Since the 1980s, reforecasts initialized in boreal fall overestimate the peak SST anomalies of strong El Niño events. Both phenomena imply that the model’s air–sea feedback (Bjerknes feedback) is overly active in the eastern Pacific before ENSO event termination. On the other hand, the reforecasts have improved skill in predicting SST anomalies in the North Pacific and North Atlantic after 1979. For US precipitation prediction, a maximum signal-to-noise (MSN) EOF method, which maximizes the ratio between the variances of signal and noise, is applied to the ensemble seasonal precipitation predictions to identify the predictable patterns objectively. In winter and spring, the most predictable patterns feature a north–south dipole throughout the United States. The summer and fall patterns are dominated by the anomalies in central and southern United States, respectively. In verification with observations, the winter–spring patterns are more skillful. ENSO is the leading ocean forcing factor of the predictable patterns of US precipitation in boreal fall-winter-spring, but other oceanic factors also play an active role during summer and fall. The multidecadal change of the U.S. precipitation predictability is attributable to the low-frequency modulation of the ENSO predictability and the influences of other major climate modes. The PDO can be a dominant factor associated with enhanced prediction skill in 1979–99 and reduced skill in 1958–78. Since the 2000s, the forcing from the SST anomalies in the tropical North Atlantic with opposite sign to those |
Correlation skill of CFSv2 reforecast SST verified against ERSSTv3 for 1958-1978 (left column) and 1979-2014 (right column); (a) April (0 month lead), (b) June (2 month lead), (c) September (5 month lead), and (d) December (8 month lead). |
|
in the tropical Pacific has become a significant factor for the U.S. summer precipitation prediction. The case studies reveal seasonal anticyclonic anomalies in the subtropical eastern Pacific reduced 1963-64 and 2015-16 winter precipitation in California, because pre-existing Northeast Pacific warm SST anomalies might have shifted the El Niño-induced trough northward. For discussions, Prof. Huang left a research question: “How can we use the additional observations more efficiently?” since the observation base before 1979 (plus statistics after) seems to provide a good baseline for further improvement. References Huang, B., C.-S. Shin, and A. Kumar, 2019: Predictive skill and predictable patterns of the U.S. seasonal precipitation in CFSv2 reforecasts of 60 Years (1958–2017). J. Climate, 32, 8603-8637, DOI: 10.1175/JCLI-D-19-0230.1. ―, ―, J. Shukla, L. Marx, M. A. Balmaseda, S.Halder, P. Dirmeyer, and J. L. Kinter III, 2017: Reforecasting the ENSO Events in the Past 57 Years (1958–2014). J. Climate, 30, 7669-7693, DOI: 10.1175/JCLI-D-16-0642.1. |
|
|
The 8th NCEP Ensemble User Workshop S2S Prediction and Applications Session August 29, 2019 The 8th NCEP Ensemble User Workshop was held at NOAA Center for Weather and Climate Prediction in College Park, Maryland on August 27-29, 2019. The central theme was to better convey forecast uncertainties to users to optimize the utility of NWS forecast information. The workshop had a session on subseasonal-to-seasonal (S2S) climate prediction and applications on day 3. Climate Prediction Center (CPC) Director David DeWitt gave an overview, which broached the subject. The presentations by ensemble developer, forecast producer and external partner representatives followed to share their valuable experiences in evaluation and utility of the products. Following is the main content of the overview. Requirements and challenges to improve S2S climate prediction The subseasonal to seasonal predictions are characterized by small signals and large noise, hence they are inherently probabilistic. The key tool for informing forecasts is using ensemble of dynamical models. The S2S threat vector describing the forecast uncertainty narrows as time to event decreases. But it never becomes deterministic. CPC hazard forecasts present the opportunity when we anticipate a period of increased predictability. CPC S2S prediction products use ensembles with focus on the first month. The week-2 probabilistic hazards outlook is designed to forecast probability of extreme events. We use the Global Ensemble Forecast System (GEFS) based Week-2 Global Probabilistic Extremes Forecast Tool to inform the development of probabilistic hazard, which is available online. Our standard temperature and precipitation outlooks include week-2 and week 3-4 forecasts, which are issued in tercile classes (above, near, or below normal) daily and in two classes (above or below normal) once per week on Friday, respectively. CPC also issues GEFS-based week-2 forecast for the probability of exceeding 50 mm rainfall. |
|
|
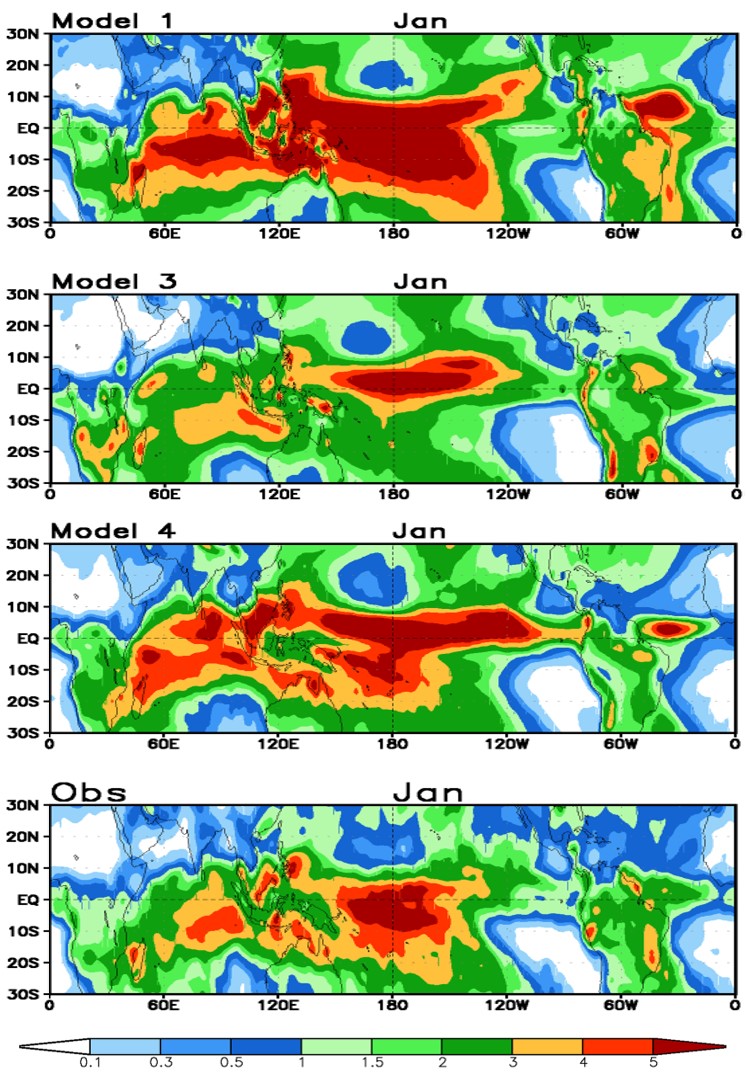
CPC technical requirements for the day 6 to ~ day 35 ensemble forecast system are (1) consistent reforecasts with each real-time upgrade of length at least 20 years, and 5 members, (2) equilibrated boundary conditions in reforecasts and real-time, i.e. no discontinuities or non-physical trends in soil moisture, upper ocean temperature, and sea ice etc., (3) metrics for evaluation of upgrade, such as i) temperature and precipitation skills over the same domain as that of CPC outlooks, ii) global skill for relevant fields for Global Tropics Hazards Outlook and International Desk products, and iii) fidelity of simulation of major modes of S2S variability and associated teleconnections from El Niño-Southern Oscillation (ENSO), Madden-Julian Oscillation (MJO), Arctic Oscillation (AO), North Atlantic Oscillation (NAO), Pacific/North Amerian pattern (PNA), and Sudden Stratospheric Warming (SSW). CPC's wishlist to improve the day 6 to ~ Day 35 ensemble forecast system contains (1) reliable predictions of periods of enhanced versus suppressed predictability, (2) reduction of persistent systematic errors in coupled general circulation models (CGCMs), and (3) improved precipitation forecasts on all timescales. There has been dramatically increased skill in predicting MJO as a result of tremendous efforts to improve physics made by Environmental Modeling Center. To derive the benefit for stakeholders, we still need to drastically improve teleconnections from MJO, which involve other important processes, like nonlinear interactions with the jet stream in the mid-latitude as one of them. More scientific challenges that limit CPC S2S forecast skill include (1) El Niño false alarms, a major systematic error that current generation coupled models have in timing and amplitude of equatorial Pacific SST anomalies forecast, (2) systematic errors in forecasting magnitude and distribution of average precipitation in the tropics (even at first month lead) (ex. See figure), (3) inability to predict onset of flash drought as occurred over Northern Plain in 2017, which highlights challenges on predictability of precipitation beyond week-2 for the spring and summer seasons when variability is controlled by convective as opposed to advective processes, and accuracy of land surface model simulation of enhanced evaporation, (4) development of erroneous double Inter Tropical Convergence Zone (ITCZ), a common model problem across time scales from S2S to long-term climate change. Societal demand for S2S forecasts continues to grow. S2S models are just starting to be run at resolutions where transient eddies are resolved. Hopefully, this leads to improvements in representation of their statistics from a forecasting perspective. Persistent systematic errors in S2S (and climate change) models likely limit forecast skill. Reducing these errors should be a priority for the global S2S enterprise in order to meet societal demand for improved S2S forecast skill. (Collated by Jiayu Zhou) |
Standard deviation of January precipitation from one month lead forecasts by 3 state of the art S2S models (top 3 panels) and the observation (bottom panel). It demonstrates that models have errors of 100% or more in predicting mean statistics of tropical precipitation. Result is even worse if large ENSO events being removed. |
|
Sub-Seasonal Climate Forecast Rodeo Symposium A subseasonal machine learning forecast model for the Forecast Rodeo June 17, 2019 The Sub-Seasonal Climate Forecast Rodeo Symposium was held in NOAA Auditorium, Silver Spring, MD. Dr. Judah Cohen of Team StillLearning, one of the three winning teams, gave a talk about their success in developing a machine learning system to improve subseasonal forecasts of temperature and precipitation over the western U.S. The system is an ensemble of two nonlinear regression models: a local linear regression model with multitask feature selection (MultiLLR) and a weighted local autoregression enhanced with multitask k-nearest neighbor features (AutoKNN). The MultiLLR model introduces candidate regressors from each data source in the Subseasonal Rodeo dataset and then prunes irrelevant predictors using a multitask backward stepwise criterion designed for the forecasting skill objective. The AutoKNN model extracts features only from the target variable (temperature or precipitation), combining lagged measurements with a skill-specific form of nearest-neighbor modeling. The results were encouraging. Each model alone was more accurate than the debiased operational U.S. Climate Forecasting System (CFSv2), and the ensemble skill exceeded that of the top Rodeo competitor. Moreover, over 2011-2018, an ensemble of two regression models and debiased CFSv2 improved debiased CFSv2 skill by 20-38% for temperature and 120-146% for precipitation. In discussions of the next step, Team StillLearning plan to extend the forecasts to the contiguous U.S. For more information, see https://arxiv.org/pdf/1809.07394.pdf. The symposium also honored Salient and Lupoa13 two teams for their outstanding work to improve week 3-4 and 4-6 forecasts, namely “connecting terrestrial rainfall prediction with sea surface temperature and salinity variability” conducted by Salient and “constructing subseasonal forecast using a combination of contingency and analog techniques as well as a crude form of artificial intelligence” pursued by Lupoa13. The next round Rodeo II was announced by Bureau of Reclamationation, Department of the Interior, and will kick off on July 19th, 2019. |
|
|
North American Multi-Model Ensemble Teleconference Verifying the NMME: 2012 – 2018 June 6, 2019 The North American Multi-Model Ensemble (NMME) forecast products have been widely used for decision making since 2011. The quality of the prediction is an important focus for service improvement. Dr. Sarah Strazzo of Climate Prediction Center conducted a study on four types of NMME seasonal forecasts (uncalibrated1, Probability Anomaly Correlation (PAC) calibrated (van den Dool et al. 2017), “Calibration, Bridging, and Merging” (CBaM) post-processed (Strazzo et al. 2018), and “Bridged”2 NMME forecasts) over the period of 2012-2018 and presented her findings in the June teleconference. Her results showed overall more hits and correct negatives than false positives and misses from contingency table of verification. The observation of more above than below normal temperatures was captured by uncalibrated, PAC calibrated, and CBaM post-processed forecasts, among which uncalibrated and PAC calibrated forecasts over-predicted above normal temperatures while CBaM post-processed and “Bridged” over-predicted below normal temperatures. Moreover, PAC calibrated precipitation forecasts achieved impressive Heidke skill scores, and NMME forecasts, particularly the post-processed versions, tended to outperform ENSO-derived forecasts in general. Her results further showed “hits” also increased as predicted probabilities increased, a good indication of “forecast opportunity” potential. In her summary, Dr. Strazzo shared with audience her promising thoughts to leverage other predictability sources, specifically to improve the prediction of winter below normal temperatures. 1) NMME includes CFSv2, CanCM3, CanCM4, GFDL-CM2.1, GFDL-FLOR, NASA-GEOS, and NCAR-RSMAS-CCSM4 participant models. Probabilities are calculated as ensemble frequencies relative to model mean terciles. 2) Uses bridged forecasts (1-month lead) as a stand-in for empirical ENSO-derived forecasts. References Strazzo, S., D. Collins, A. Schepen, Q. J. Wang, E. Becker, and L. Jia, 2018: Seasonal prediction of North American temperature and precipitation using the Calibration, Bridging, and Merging (CBaM) method. NWS Sci. Technol. Infusion Clim. Bull., 42nd NOAA Annu. Clim. Diagn. Predict. Workshop, Norman, OK, National Oceanic and Atmospheric Administration, 177-180, doi:10.7289/V5/CDPW-NWS-42nd-2018. van den Dool, H., E. Becker, L.-C. Chen, and Q. Zhang, 2017: The probability anomaly correlation and calibration of probabilistic forecasts. Wea. Forecasting, 199-206. |
|
|
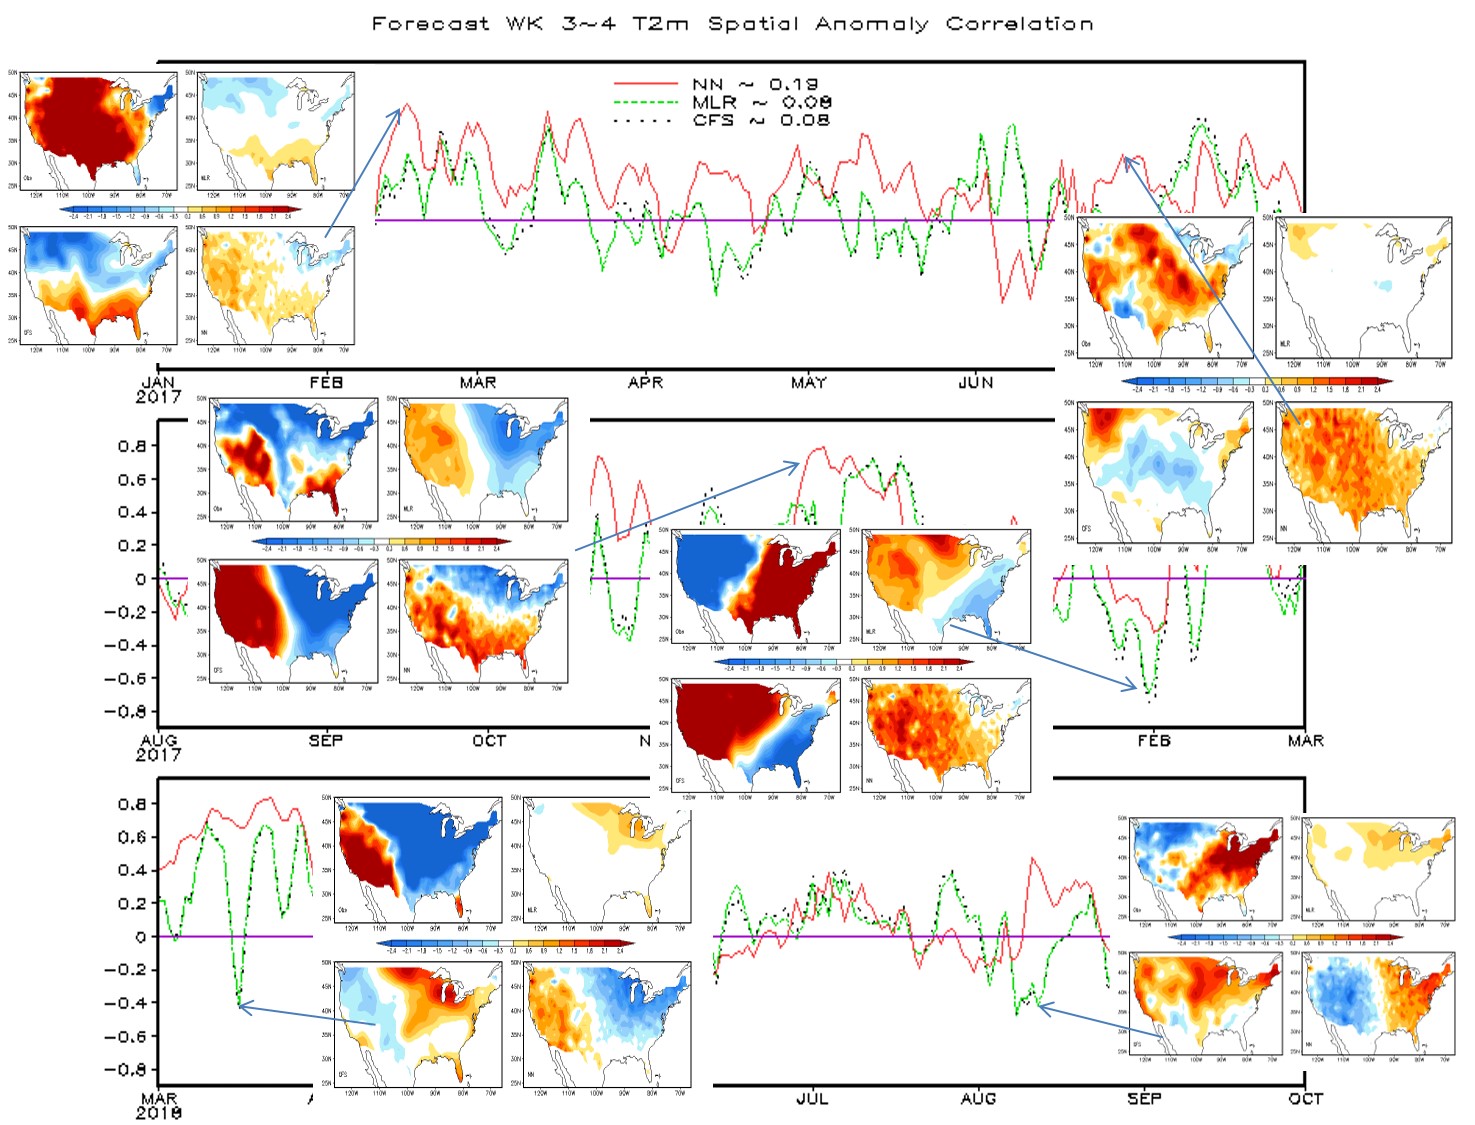
First NOAA Workshop on Artificial Intelligence Using neural net to improve week 3-4 precipitation and 2 meter temperature forecast April 25, 2019 The 1st NOAA Workshop on Leveraging AI in the Exploitation of Satellite Earth Observations & Numerical Weather Prediction was held in National Center for Weather and Climate Prediction, College Park, MD on April 23-25, gathering more than 400 scientists, program managers, and leaders from the public, academic and commercial sectors to exchange ideas, share lessons learned, and to discuss both the future potential and limitations of AI. Being selected by the workshop organizing committee, Dr. Yun Fan of Climate Prediction Center gave a presentation on the work of using artificial neural networks (NN) to improve the Climate Forecast System (CFS) week 3-4 precipitation and 2 meter temperature (T2m) forecast in the Post-Forecast and Extreme Weather session. Taking the advantage of flexibility of NN architectures that can handle big dataset and account for nonlinear impact, pattern relationship and co-variability among predictors and predictands, his preliminary results showed great potential of NN to improve week 3-4 forecast skill over CFS and multiple linear regression (MLR). As presented in Fig. 1, some CFS forecasts and corresponding observations are out of phase, which are reversed by NN, but not by MLR, prompting the value of NN. More information about the motivation, the NN basic as well as additional variables and cases explored are detailed in his presentation, which is available at https://www.star.nesdis.noaa.gov/star/documents/meetings/2019AI/Thursday/S5-6_NOAAai2019_Fan.pptx. |
|
|
Time series (Jan 2017 - Oct 2018) of spatial anomaly correlation between observation and week 3-4 T2m forecast by NN, MLR, and CFS indicated by red solid, green dotted and black dotted line, respectively. Each four-panel inset shows the anomaly of forecast by CFS (lower left), MLR (upper right) and NN (lower right) in comparison with that of observation (upper left) at a specific time. |
|
|
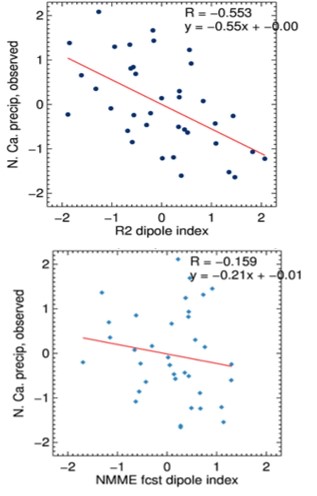
North American Multi-Model Ensemble Teleconference Assessment of variances and NAD-NorCal precipitation relationship in NMME forecast April 4, 2019 Drs. Huug van den Dool and Emily Becker of Climate Prediction Center (CPC) gave a joint presentation on the topics of 1) EOF patterns in 200 hPa height in NMME models and observation, and 2) NMME representation of stationary wave pattern and the “North American Dipole index” in the April NMME teleconference. Principal Scientist Emeritus Huug van den Dool studied the time series of “all” model members (many realizations) versus that of observation (a single realization) to explain how using the ensemble mean as input can result in a simpler time series and lead to forecast overconfidence. His EOF analysis of 200 hPa height revealed that the 1st mode was AO-like for both observation and all models, while the explained variance was 30% in observation and a large range from 20% to 40% among “all” model members. It was also demonstrated that nearly 50% (ranging from 37% to 58%) of the variance, when using ensemble means, was explained by the 1st EOF mode (one degree of freedom). The forecast based on the ensemble mean could be too simple when a lot of the “noise” variance being eliminated. Dr. van den Dool also showed the trends appear mostly in EOF2, if not EOF1, with spatially uniform maps and mainly up or down time series for all models calculated from ensemble means. CPC NMME Lead Dr. Becker explored the relationship between northern California (NorCal) precipitation and “North American Dipole” (NAD), a peak/trough of stationary wave pattern revealed in an early work by Wang et al. (2014). Her study demonstrated the relationship between DJF NAD index and NorCal precipitation was fairly strong (r=-0.55, See figure, top panel) in observation and even stronger (r=-0.88) in NMME ensemble mean forecast but weaker (r=-0.16, See figure, bottom panel) between forecasted NAD index and observed NorCal precipitation, though the former has some relationship with observed NAD index (r=0.36). Reference Wang, S.-Y., L. Hipps, R. R. Gillies, and J.-H. Yoon, 2014: Probable causes of the abnormal ridge accompanying the 2013-14 California drought: ENSO precursor and anthropogenic warming footprint. Geophys. Res. Lett., doi: 10.1002/2014GL059748
|
Scatter plot of observed NorCal precipitation with observed (top) and forecasted (bottom) NAD index, respectively. |
|
Verification of SSH hindcasts using multiple ocean reanalyses November 1, 2018 Sea surface height (SSH) has been used to measure the ocean currents that move heat around the globe as a critical component of Earth's climate. Its relationships with SST, salinity, tides, waves, and the atmospheric pressure loading patterns are of great interest of climate forecasters. To promote R2O activities for service improvement, the NMME project is planning to make its SSH hindcast data available to the community. In the teleconference this month, Dr. Bill Merryfield of the Canadian Centre for Climate Modelling and Analysis (CCCma) was invited to give a talk on his study of the verification of CCCma Coupled Climate Model, versions 3 and 4 (CanCM3/4) SSH hindcasts using multiple ocean reanalyses, i.e. Ocean ReAnalysis System 4 (ORAS4, ECMWF), Global Ocean Data Assimilation System (GODAS, NCEP), Cimate Forecast System Reanalysis (CFSR, NCEP) and German Estimating the Circulation and Climate of the Ocean, version 2 (GECCO2, University of Hamburg). His results showed hindcast skill of CanCM3/4 SSH was generally high (comparable to that for SST), although large differences existed depending on region and verification reanalysis product used, particularly in the Atlantic & Southern Oceans. Among the four reanalyses, the spatial mean skill was the highest for GODAS; this relationship may be at least partially attributed to the use of GODAS ocean temperatures to initialize CanCM3/4 hindcasts, as well as the lack of Arctic data in GODAS. Dr. Merryfield's study revealed skill may be the highest when using the multi-reanalysis mean for verification. Inconsistencies were found between reanalyses in global SSH trends; most of the reanalyses lack any realistic trend. Further work to improve skill by replacing global trend with observed trends are in progress. |
|
|
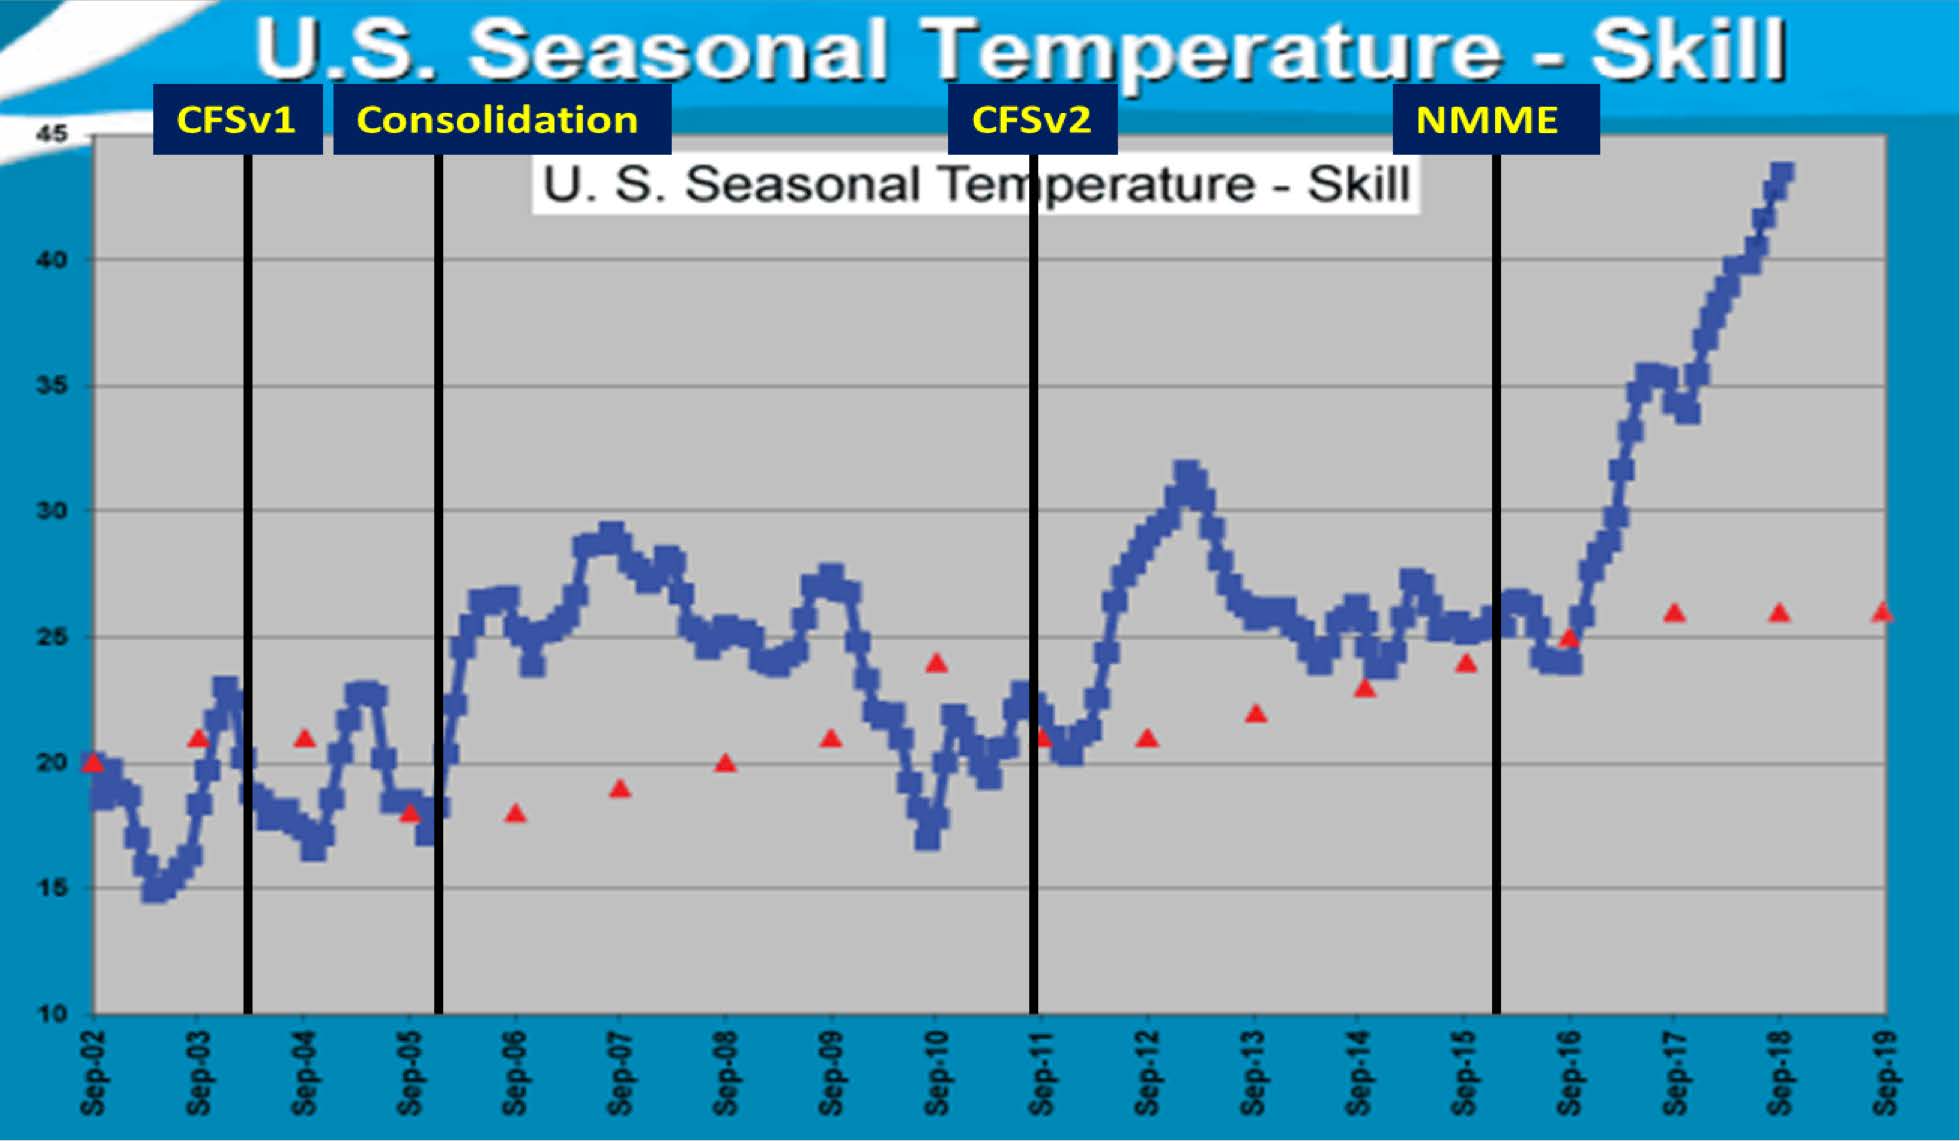
43rd NOAA Climate Diagnostics and Prediction Workshop S2S Prediction and Monitoring Success Stories from CPC and S2S Prediction Challenges for the Community October 23, 2018 The 43rd NOAA Climate Diagnostics and Prediction Workshop was successfully held in the University of California, Santa Barbara, CA. In the opening session, NOAA Climate Prediction Center (CPC) Director David DeWitt gave a speech on progresses in improving S2S prediction and monitoring products and services and challenges faced by forecasters to continue development. The comprehensive skill metric (CSM) based on all CPC extended to long range outlooks revealed continuous improvement of CPC products. In a recent assessment followed by the Government Performance and Results Act (GPRA), CPC seasonal prediction of U.S. surface temperature went up to a record high of the performance skill (See figure). The advancement was inseparable with ongoing R2O activities, such as improved objective seasonal consolidation for statistical models and North American Multi-Model Ensemble (NMME) with added research models, calibration enabled by GEFS reforecasts, and leveraging from shorter lead forecasts etc. The progresses were also reflected in newly implemented systems, tools and products exemplified by Modular Ocean Model version 6 (MOM6) Hybrid Global Ocean Data Assimilation System (GODAS), weak 3-4 Arctic sea ice prediction system, conventional observation reanalysis (CORe) to replace NCEP/NCAR Reanalysis 1, second generation CPC MORPHing technique (CMORPH), ENSO strength outlooks, and high-winds tool for week two probabilistic extremes outlook, to name a few. |
48 month running mean of T. Heidke skill score for seasonal forecast of US surface temperature. Each score plotted is an average of scores over the past 48 three moth "seasons". This skill score has been established as GPRA performance measure. The requirement of demonstrate program impact was mandated by Congress in 1993 through the Government Performance and Results Act (GPRA). |
|
In view of future challenges, David DeWitt made a list of difficult problems for research reference. 1. Improving forecast skill for tropical SST beyond the current ability to forecast large SST anomalies in the central and eastern Pacific. 2. Improving forecast skill for tropical precipitation beyond the current ability to forecast local precipitation anomalies associated with large SST anomalies in the central and eastern Pacific. 3. Improving modeling of coupled atmosphere-ocean interactions in order to simulate the coupling strength with fidelity in the tropics. 4. Understanding why there is a predictive skill minimum in upper level flow over the western US on S2S timescales. In closing, Director DeWitt placed hopes on people in field with considerable effort, and sufficient and sustained investment to work together on trying to make a break through. |
|
|
Climate Prediction Center Drought Outlook Support Briefing Scientific highlights September 18, 2018 Climate Prediction Center (CPC) Drought Outlook Support Briefing presents the current hydro-climate conditions, objective drought assessment over the United States for the recent weeks, calendar month and three month season, supporting the operational National Drought Monitor and National Drought Outlook. This monthÂ’s drought briefing led by Dr. Muthuvel Chelliah examined current drought conditions and brought attention to the need for carefully monitoring the details of rainfall deficits and soil moisture conditions on time scales ranging from weeks to years across the continental United States. He also stressed the fact that our ability to predict future drought conditions, critically depends our ability to predict precipitation in the upcoming month and seasonal time scale by our operational forecast models. Drought outlook is based on its predictability that comes largely from 1) teleconnections induced by large-scale remote forcing, which SST anomalies dominate, and 2) local land surface characteristics, e.g. soil moisture, vegetation, snow cover etc., which impact either directly on the water and energy balance or through their memory effect on atmospheric variability and land surface hydrology. The challenges are the unpredictable internal atmospheric variability, such as development of synoptic systems that may also interact with drought regionally. The Briefing showed ENSO neutral conditions were currently present and under El Niño Watch with ~50-55 % chance of El Niño in the Northern Hemisphere fall 2018 and increasing to ~65-70% during winter 2018-19. Monitoring of regional drought condition indicated the Northern Plains drought, which was continuing from 2017, got improved in early/middle summer, but did not completely recover from May-September rains of this year. The predominant South/Southwest drought, a consequence of the rainfall deficit associated with two recent back to back La Niñas, was undergoing changes. Short term drought improvement/removal had been noted across parts of Kansas/Oklahoma/Missouri/Arkansas/Louisiana since last month. Dryness/Drought was expanding/developing in the Pacific Northwest states expanding into Idaho. Despite marginal chance of El Niño development in fall 2018, subsurface Pacific conditions were still shown reasonably warm and pointing towards El Nino. Accordingly, models and forecasters continued to predict/expect El Nino conditions to develop in Fall and Winter. In the next three months, all models indicated slightly above normal rainfall particularly across the South and West, dryness in the Pacific Northwest. "But in the upcoming season, seasonal rains will arrive especially in mid/late November and December all along Pacific western states and adjoining states. Increasing chances of El Nino will help the drought in the south and west, and hence contribute to improving short term improvement, but longer term dryness will persist. Much of the easten half of the United States will likely remain drought free", Dr. Chelliah added. |
|
|
North American Multi-Model Ensemble Teleconference Strong relations between ENSO and the Arctic Oscillation in the NMME September 6, 2018 Discussions continued on the hot topic of the 2015-16 El Niño event and the prediction of California rainfall. The Arctic Oscillation (AO) impact is critical to improving middle- to high-latitude climate outlooks, and most models did not catch the positive AO observed during that season. Michelle LÂ’Heureux, Lead of the El Niño-Southern Oscillation (ENSO) team, NOAAÂ’s Climate Prediction Center did a more careful study, looking inside the complex problem. She demonstrated a strong correlation (r~0.9) between ensemble mean AO and ENSO values out to long lead times of 12 months in the NMME products, much stronger than the correlation in observations (See figure). Though her studies revealed the NMME has some skill in predicting the AO out to 5-7 seasons for winter and early spring, she noted that not all the AO skill (forecast vs. observations) can be attributed to ENSO, especially at short lead times. While ENSO can impact the winter AO/NAO, the predictable signal was smaller than the unpredictable noise, suggesting the NMME is overdoing the AO-ENSO relationship, especially during the spring and fall. This sensitivity may arise from the models underrepresenting or missing other sources of predictability. The details were explored in her paper with coauthors (LÂ’Heureux et al. 2017). Reference LÂ’Heureux, M. L., M. K. Tippett, A. Kumar, A. H. Butler, L. M. Ciasto, Q. Ding, , K. J. Harnos, and N. C. Johnson, 2017: Strong relations between ENSO and the Arctic Oscillation in the North American Multimodel Ensemble. Geophys. Res. Lett., 44, 11,654–11,662. |
Anomaly correlation between of the NMME ensemble mean Niño-3.4 and AO index values. Dots indicate the 5% significance level. The bottom row (Obs) indicates the contemporaneous correlation between the Niño-3.4 index and the AO index. The AO index has been inverted. The lead time is by month, for sliding seasonal averages. (From LÂ’Heureux et al. 2017) |
|
Climate Prediction Center Ocean Briefing August scientific highlights August 9, 2018 The NWS Climate Prediction Center Ocean Briefing makes monthly assessment of how the state of the global ocean evolved recently, what was the interaction with the atmosphere, and how the predictions were made for the future. To facilitate understanding of the science embedded in the forecast, it highlights important ongoing physical and dynamical processes for potential development. This month's ocean briefing led by Dr. Caihong Wen highlighted 1) current ENSO conditions compared with historical events, 2) Atlantic Multi-decadal Oscillation (AMO) related North Atlantic SST and ocean heat content evolution and the link to weak North Atlantic hurricane activities, and 3) capability of the new CPC pentad (5-day mean) Sea Surface Salinity (SSS) product in capturing meso-scale dynamical signals related to tropical instability wave (TIW), which plays an important role in air-sea interactions and subseasonal-to-seasonal (S2S) climate variability (Wen et al. 2012). The briefing material can be accessed at Reference Wen, C., Y. Xue, and A. Kumar, 2012: Ocean–Atmosphere Characteristics of Tropical Instability Waves Simulated in the NCEP Climate Forecast System Reanalysis. J. Climate, 25, 6409–6425. DOI: 10.1175/JCLI-D-11-00477.1 |
|
|
North American Multi-Model Ensemble Teleconference The impact of SST-forced and unforced teleconnections on 2015/16 El Niño winter precipitation over the western U.S. August 2, 2018 The ongoing discussion of the difficult prediction of anomalous dry conditions over Southern California during the 2015/16 El Niño winter was continued by Dr. Young-Kwon Lim of the Global Modeling and Assimilation Office, NASA Goddard Space Flight Center. Earlier contributions to this discussion were provided by Arun Kumar (4/5/18) and Huug van den Dool (6/14/18). In addition to finding that the spatial distribution of the tropical Pacific warming in 2015/16 was not a main cause of the negative precipitation anomalies in Southern California (agreeing with previous researchers), Dr. Lim showed that the atmospheric response to the Northeast Pacific warm water blob (WWB) SST could decrease precipitation in the Southwestern U. S. region, and the model response to the WWB was not sufficient to fully overcome the relatively large El Niño-driven positive precipitation anomalies. Regarding the role played by internal atmospheric variability, further regressing the intra-ensemble variance of the precipitation against the leading height modes produced precipitation anomalies that did much to close the gap between the observed and ensemble mean response, especially in the Southwest where the AO/NAO-like leading noise pattern was seen to play a key role. No NMME models predicted the negative precipitation anomalies over Southern California; rather, all of them displayed a strong and predictable response to the tropical Pacific SST forcing. “It may not represent a failure of the forecasts, but a failure to adequately provide the community with a quantifiable and understandable measure of the uncertainty in the prediction”, Dr. Lim said in conclusion. Reference Lim, Y.-K., S. D. Schubert, Y. Chang, A. M. Molod, and S. Pawson, 2018: The impact of SST-forced and unforced teleconnections on 2015/16 El Niño winter precipitation over the western US. J. Climate, 31, 5825-5844, doi:10.1175/JCLI-D-17-0218.1. |
|
|
North American Multi-Model Ensemble Teleconference Predictability of the sudden stratospheric warming in the NMME phase-2 models July 12, 2018 “Since skillful subseasonal predictions of Northern Hemisphere cold season extratropical weather and extreme events are linked to the Arctic Oscillation/Northern Annular Mode (AO/NAM), it is desirable to predict the state of the stratospheric polar vortex, and thus potentially the surface temperature and storm track patterns out 20-40+ days into the future.” Prof. Jason Furtado of the School of Meteorology, University of Oklahoma gave a presentation on quantifying fundamental characteristics of AO/NAM and related predictability in the NMME Phase-2 models, and identifying models biases in the development and subsequent impact of major sudden stratospheric warmings (SSW). His research, using the three NMME Phase-II models with sufficient stratospheric data (CanCM3, CanCM4, and NCAR-CCSM4) showed that: 1) modeled surface AO signature includes a much stronger Pacific loading center than in observations, 2) models underestimate the frequency of positive AO after approximately 7 days, 3) an observed significantly higher frequency of negative AO enduring through days 10-16 is not represented by the models, and 4) the models underestimate Northern Hemisphere polar vortex variability. Flaws were also found in wave forcings and resulting patterns. The composite of post-SSW impacts on 500 hPa geopotential height showed the North Atlantic Oscillation signature was present, but slightly eastward biased, and models show little agreement with observations in the Pacific sector. It was discussed that stratosphere-troposphere coupling biases may be tied to incorrect wave-mean flow interactions in the troposphere following major SSWs. |
|
|
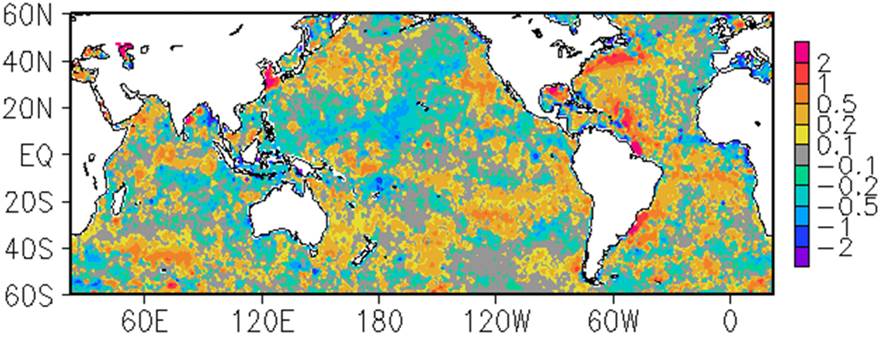
Climate Prediction Center Ocean Briefing Blended analysis of pentad sea surface salinity July 12, 2018 To support Ocean Briefing in real-time, Dr. Pingping Xie of Climate Prediction Center introduced a new monitoring product, Blended Analysis of Sea Surface Salinity (BASSS, Xie et al. 2014), which combined information of in situ measurements from NCEI and multiple satellite retrievals from NASA/SMAP, NASA/Aquarius and European Space Agency(ESA)/SMOS), using revised Optimum Interpolation (OI) based blending technique originally developed for monthly analysis to create pentad data of spatial resolution 1°x1° over global ocean that was daily updated with a delay of 2 days. |
Global Sea Surface Salinity Anomaly for 6/30-7/04 of 2018. (Click on the figure to enlarge.) |
|
In accompany with sea surface salinity, oceanic evaporation (E), precipitation (P) and E-P were also composed. The evaporation was produced from CFSR evaporation data adjusted against Objectively Analyzed air-sea Fluxes (OAFlux), and the precipitation from bias corrected CMORPH satellite precipitation estimates. Validation with Tropical Atmosphere Ocean (TAO) buoy observations showed that BASSS captures the major structure quite well, though TAO was not an independent input. The author welcomes user feedbacks, especially on requirements of 1) time/space resolution, 2) additional variables, and 3) diagnostic fields/tools and attribution analysis. Dr. Pingping Xie can be reached at pingping.xie@noaa.gov. Reference Xie, P., T. Boyer, E. Bayler, Y. Xue, D. Byrne, J. Reagan, R. Locarnini, F. Sun, R. Joyce, and A. Kumar, 2014: An in situ-satellite blended analysis of global sea surface salinity. J. Geophys. Res. Oceans, 119, 6140–6160, doi:10.1002/2014JC010046. |
|
|
North American Multi-Model Ensemble Teleconference More on “failed” precipitation forecasts June 14, 2018 Dr. Huug van den Dool of NWS Climate Prediction Center continued the discussion of the "unsuccessful" forecast of 2015/16 winter Southern California precipitation, following on the NMME teleconference led by Dr. Arun Kumar in April. Calibrated probabilistic forecasts (van den Dool et al. 2017), show improved reliability and resolution, but not predictability, which could be attributable to model deficiencies and shortcoming of the system such as signals captured by the models and the relatively short hindcast period. More in-depth thinking was explored, including (1) that the Southern California rainfall climate might be odd (intermittent, seasonal and non-Gaussian) and marginal, and the NMME models may not accurately represent the current Southern California climate; (2) interdecadal variations in ENSO/mid-latitude correlation could be poorly captured by the models; (3) eddy-mean flow interactions could impact the jet extension that reached the west coast of U.S. (e.g. 1982/83 vs. 2015/16); and (4) the noise could be changing, and may act "in our favor" on some occasions. An intense program of large-ensemble and shorter range forecasts was recommended for more insightful studies on the minority of model members that captured more accurate patterns for 2015/16. Lastly, Dr. van den Dool raised the question of how to make our probability forecasts a more effective and correct message in order to better serve our users. CPC forecasters are not predicting probabilities, but rather use probabilities to express uncertainty in the forecast (in lieu of error bars). Recalling the AMS statement from the 1980s on ethical standards for weather forecasting, “a forecast has to be unambiguous, reproducible and verifiable”, Dr. van den Dool made the point that a forecast should be correct or not correct, nothing in between. Reference van den Dool, H., E. Becker, L.-C. Chen, and Q. Zhang, 2017: The probability anomaly correlation and calibration of probabilistic forecasts. Wea. Forecasting, 32, 199-206. |
|
|
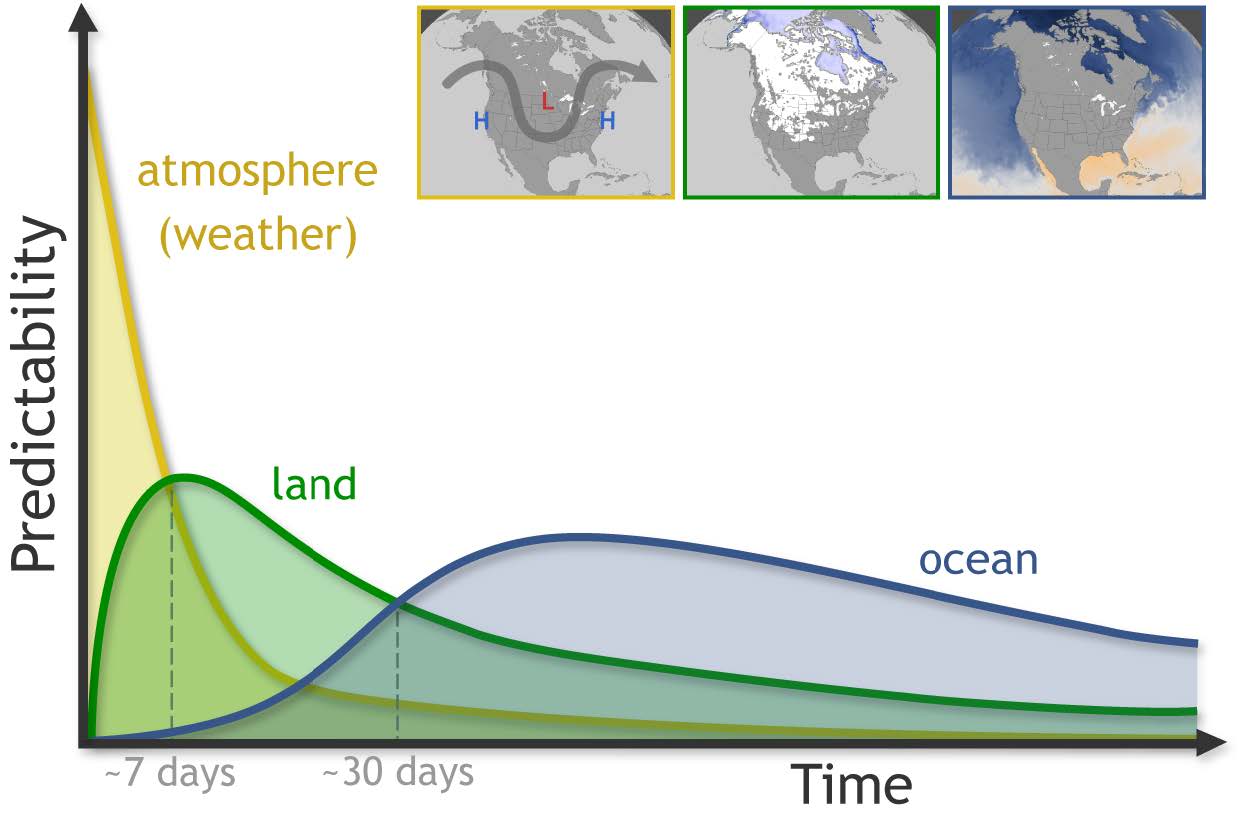
Environmental Modeling Center Seminar The emerging role of the land surface in weather and climate prediction May 29, 2018 Professor Paul Dirmeyer of George Mason University gave a seminar on the emerging role of the land surface in weather and climate prediction and keys to assessing and improving model performance related to land-atmosphere interactions at the NOAA Center for Weather and Climate Prediction, College Park, MD. It was demonstrated that the land surface, a slowly varying manifold relative to the atmosphere, provides predictability and prediction skill across a range of time scales with the peak influence in the “subseasonal” time range between 1-3 weeks (See figure). Looking for insight into the land-atmosphere feedback ingredients, i.e. sensitivity, variability and memory, Prof. Dirmeyer revealed a clear correlation between the efficiency of converting good land initial conditions into forecast improvement and the strength of the land-atmosphere coupling. There are significant impacts of land, or errors in its representation, beginning from the first morning of simulation via both terrestrial and atmospheric legs of the feedback pathway. The process chains that link soil moisture, vegetation, snow, and other land states through the energy and water cycles manifest through their effects on the growing daytime boundary layer, cloud formation and convection. The seminar concluded that the daily, monthly and seasonal mean skill arising from coupled land-atmosphere feedbacks can only be improved by improving the diurnal cycle. System-level planning should be pursued for model development, calibration and validation (Dirmeyer et al. 2018). |
Illustration of predictability distribution of atmosphere, land and ocean in time scales from weather to climate, showing the prominent role played by land states (namely soil moisture but also snow) at subseasonal time scales. |
|
Reference Dirmeyer, P., and Co-authors, 2018: Verification of land-atmosphere coupling in forecast models, reanalyses, and land surface models using flux site observations. J. Hydrometeor., 19, 375-392. doi: 10.1175/JHM-D-17-0152.s1 Climate Prediction Center Ocean Briefing Is an El Niño coming? May 10, 2018 In Climate Prediction Center (CPC) May Ocean Briefing, forecaster discussions led by Dr. Zeng-Zhen Hu focused on potential El Niño development and the possible impact of Climate Forecast System Reanalysis (CFSR) biases on ENSO forecast. Investigations revealed the depth of 20°C isotherm anomaly of CFSR minus Global Ocean Data Analysis System (GODAS) reached -10 m before 1999 and after 2015. The shift around 1999 was related to the sudden onset of positive trade wind bias resulted from assimilation of the Advanced TIROS Operational Vertical Sounder (ATOVS) satellite observations (Xue et al. 2011; Zhang et al. 2012). The shift around 2015 was partially related to the reset of CFSR ocean conditions with a parallel GODAS run to control a cold bias growth in the tropical Atlantic Ocean in CFSR and partially to the warm bias in the 1999-2010 climatology used to define anomalies. The periodic reset of the CFSR ocean with the parallel GODAS run not only removed the cold bias in the tropical Atlantic, but also removed the warm bias in the eastern Pacific that has persisted from 1999 until 2015 when the reset started. According to Dr. Yan Xue, the CPC Global Ocean Monitoring Lead, the cooler subsurface temperature anomalies in CFSR after 2015 likely contributed to somewhat cooler NINO3.4 anomaly forecast in CFSv2, as shown in the North American Multi-Model Ensemble (NMME) plume, since the CFSv2 SST hindcast has been also bias-corrected with the 1999-2010 climatology. The discussion materials are available at North American Multi-Model Ensemble Teleconference Predictability assessment of winter 2015/16 precipitation over the west coast of the US April 5, 2018 Dr. Arun Kumar, Principal Scientist at NOAA Climate Prediction Center, gave a presentation on a research challenge on the predictability of 2015/16 winter precipitation anomaly over the west coast of the U. S., where the observation was opposite to the mean El Niño signal. Key research questions were raised. 1) Were the differences due to unpredictable noise having an influence on individual seasonal mean? 2) Were the differences due to changes in atmospheric response to differences in ENSO SSTs, atmospheric response to other boundary forcing, or changes in ENSO teleconnections in a changing climate? Were those factors predictable? Using CFSv2 hindcasts (1982-2011) and real-time forecasts (2012-2015), Dr. Kumar demonstrated the model forecasts with DJF 2015/16 SST forcings were consistent with historical expectations; the contribution from noise could lead to subtle changes in circulation and could appreciably change seasonal mean precipitation outcomes from the “expected response”. For better understanding, there are further questions that need to be answered, e.g. 1) What is the PDF of seasonal mean atmospheric states during different El Niño conditions? 2) How does the “response and noise” vary from one event to another? 3) How predictable are the variations in SSTs themselves? “Though we know the approach, i.e. ensemble of GCM simulations with multiple models to pursue attribution studies, we don’t know how to build confidence in answering some of the questions and bringing them to a closure. With such a view, the use of probabilistic forecasts in decision making on an individual forecast basis is a hard dilemma to come to grips with”, said Dr. Kumar. |
|