
Dangerous and extreme heat will remain across portions of the southern U.S. this week. Heavy rainfall may bring significant flash flooding across portions of the Mid-Atlantic and Northeast through the night, and additional flash flooding concerns across New England on Wednesday. Monsoonal thunderstorms will bring a flash flood risk to the Four Corners region, especially in burn scar areas Read More >
2012 Drought and Heat Wave
Rainfall Deficits and Drought Progression
Though not as extreme as the drought of 2011, the spring, summer, and fall months of 2012, with the exception of March, once again received below normal amounts of precipitation, leading to drought conditions across much of the region, including eastern Oklahoma and northwest Arkansas. Below are bar graphs showing the 2012 monthly precipitation (in blue), along with the average expected amounts (in red) for both Tulsa, OK and Fort Smith, AR. Average data was taken from 1981 - 2010.
| Tulsa, OK | Fort Smith, AR |
 |
 |
As the bar graphs show, the majority of the spring, summer, and fall seasons of 2012 were once again dry, with below normal amounts of rainfall leading to drought conditions developing across the region. March was the only month with significant rainfall, with 6.24 inches in Tulsa, and 8.06 inches in Fort Smith. Looking at the Tulsa data, April, June, and August appear to be near normal in amounts of precipitation, however, when looking closer at the daily data, the majority of the rainfall that occurred in those months did so on one or two days, leaving the rest of the month dry. For example, in Tulsa during the month of June, 4.29 inches of rain fell. Of that total, 3.32 inches fell on June 4th, leaving the rest of the month mainly dry. The same goes for Fort Smith during the month of July, which received 3.91 inches. Most of that precipitation fell on July 9th (1.50 inches) and July 26th (1.32 inches). When heavy rainfall occurs, especially on already drought stricken ground, much of the precipitation turns into runoff, and is not absorbed by the soil. This does little to alleviate the drought conditions.
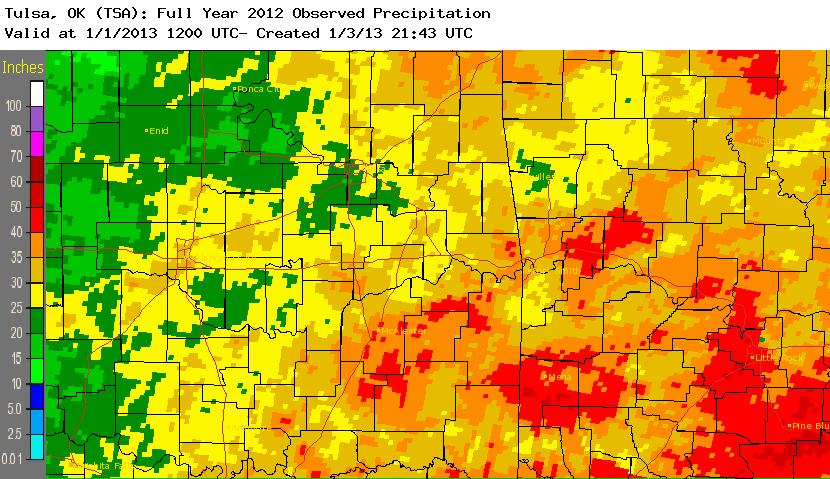
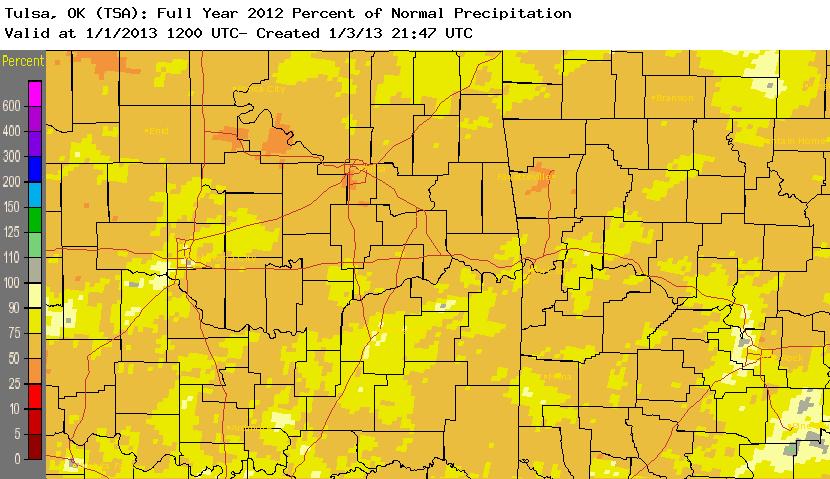
Below is a set of maps by month from March 2012 - November 2012 depicting the amounts of precipitation that fell during the month, the percent of normal, and the progression of the drought. Leading into the early spring months of 2012, much of western and central Oklahoma were already experiencing drought conditions, while southeast Oklahoma and northwest Arkansas were near normal. After the above normal precipitation in March, the drought levels decreased for April and May. With the limited rainfall in the month of May for both Tulsa and Fort Smith, drought returned by the beginning of June, and then intensified through the summer.
|
Month |
Observed Precipitation (click image for larger view) |
Percent of Normal Precipitation (click image for larger view) |
Drought Monitor (click image for larger view) |
|||||||||||||||
| March 2012 |  |
 |
 March 6, 2012 |
|||||||||||||||
| April 2012 |  |
 |
 April 3, 2012 |
|||||||||||||||
| May 2012 |  |
 |
 May 1, 2012 |
|||||||||||||||
| June 2012 |  |
 |
 June 5, 2012 |
|||||||||||||||
| July 2012 |  |
 |
 July 3, 2012 |
|||||||||||||||
| August 2012 |  |
 |
 |
|||||||||||||||
| September 2012 |  |
 |
September 4, 2012 |
|||||||||||||||
| October 2012 |  |
 |
October 2, 2012 |
|||||||||||||||
| November 2012 |  |
 |
November 6, 2012 |
|||||||||||||||
|
2012 Rainfall |
 |
 |
 |
|||||||||||||||
Average Temperatures and Their Effects on the Drought
Like 2011, above normal temperatures once again plagued the spring, summer, and fall months of 2012 across the forecast area, serving to further aggravate the persistent drought. Below are graphs showing the 2012 monthly average temperature (in blue), along with the expected monthly average temperature (in red) for both Tulsa, OK and Fort Smith, AR. Average data was taken from 1981 - 2010.
| Tulsa, OK | Fort Smith, AR |
 |
 |
As the line graphs show, temperatures were well above normal at both Tulsa, OK and Fort Smith, AR for a majority of the spring and summer months. With the exception of August, temperatures were on average between 3 and 10 degrees above normal in Tulsa, OK, and between 4 and 10 degrees above normal in Fort Smith, AR. In 2011, it was the summer months which were the most extreme, while in 2012 it was the spring months, leading to the hottest spring on record for both Tulsa, OK and Fort Smith, AR. March at both sites was over 10 degrees above normal, with average temperatures of 61.5 degrees in Tulsa, OK and 63.6 degrees in Fort Smith, AR.
Spring, Summer & Fall 2012 Records
The spring, summer, and fall months of 2012 were once again very warm, with well above normal temperatures, especially during the early spring. Several new records were set, including daily, monthly, and seasonal average temperatures and precipitation amounts.
Tulsa, OK:
|
Tulsa, OK |
Monthly Average Temperature | Departure from 1981-2010 Normal | Rank | Record | Monthly Average High Temperature | Normal Monthly High Temperature | Monthly Average Low Temperature | Normal Monthly Low Temperature |
| March 2012 | 61.5°F | +10.2°F | #1 hottest | 61.5°F 2012 | 72.6°F | 62.4°F | 50.3°F | 40.1°F |
| April 2012 | 65.6°F | +5.0°F | #10 hottest | 68.2°F 1925 | 75.7°F | 71.8°F | 55.6°F | 49.3°F |
| May 2012 | 74.3°F | +5.0°F | #2 hottest | 75.3° F 1962 | 85.1°F | 79.4°F | 63.5°F | 59.1°F |
| Spring 2012 | 67.2°F | +6.8°F | #1 hottest | 67.2°F 2012 | - | - | - | - |
| June 2012 | 80.7°F | +3.1°F | #18 hottest | 85.8°F 1911 | 91.6°F | 87.5°F | 69.8°F | 67.7°F |
| July 2012 | 88.9°F | +6.0°F | #6 hottest | 91.7°F 1980 | 101.2°F | 93.1°F | 76.6°F | 72.7°F |
| August 2012 | 82.9°F | +0.7°F | #46 hottest | 91.0°F 1936 | 96.1°F | 93.1°F | 69.8°F | 71.3°F |
| Summer 2012 | 84.2°F | +3.3°F | #6 hottest | 88.0°F 1980 | - | - | - | - |
| September 2012 | 75.9°F | +2.9°F | #28 hottest | 81.9°F 1931 | 87.6°F | 83.9°F | 64.3°F | 62.1°F |
| October 2012 | 60.7°F | -1.1°F | #25 coldest | 72.1°F 1963 | 72.2°F | 73.0°F | 49.2°F | 50.6°F |
| November 2012 | 52.6°F | +2.3°F | #23 hottest | 57.6°F 1999 | 66.2°F | 60.9°F | 39.0°F | 39.6°F |
| Fall 2012 | 63.0°F | +1.3°F | #37 hottest | 69.5°F 1931 | - | - | - | - |
* Hottest March on record, with the average temperature, average high temperature, and average low temperature all over 10°F above normal.
* 2nd hottest May on record, with the average temperature and average high temperature both 5°F above normal.
* Hottest Spring on record, with the average temperature almost 7°F above normal.
* 6th hottest July on record, with average high temperatures over 101°F.
* 6th hottest Summer on record, with an average temperature of 84.2°F (the record is 88.0°F from 1980).
* October was the only month with below normal average temperatures, as well as below normal average high and average low temperatures.
| Tulsa, OK | Rainfall | Departure from 1981-2010 Normal | Rank | Record |
| March 2012 | 6.24" | +2.95" | #9 wettest | 0.08" 1971 |
| April 2012 | 3.62" | -0.17" | #60 driest | 0.34" 1989 |
| May 2012 | 1.18" | -4.69" | #4 driest | 0.80" 1897 |
| Spring 2012 | 11.04" | -1.91" | #52 driest | 4.29" 1932 |
| June 2012 |
4.29" |
-0.43" | #61 driest | 0.27" 1933 |
| July 2012 | 1.38" | -1.98" | #36 driest | Trace 1935 |
| August 2012 | 3.32" | +0.42" | #52 wettest | 0.00" 1896 |
| Summer 2012 | 8.99" | -1.99" | #45 driest | 2.70" 1983 |
| September 2012 | 1.78" | -2.48" | #33 driest | 0.00" 1888 |
| October 2012 | 2.75" | -1.18" | #64 driest | Trace 1924 |
| November 2012 | 1.11" | -1.70" | #30 driest | Trace 1910 |
| Fall 2012 | 5.64" | -5.36" | #25 driest | 1.66" 1948 |
* 9th wettest March on record, with a record daily rainfall amount of 2.81" on March 19th.
* 4th driest May on record, with only 1.18 inches of rainfall (the average amount is 5.87 inches).
* 25th driest Fall on record, with only 5.64 inches of rainfall (the average amount is 11.00 inches).
Fort Smith, AR:
|
Fort Smith, AR |
Monthly Average Temperature | Departure from 1981-2010 Normal | Rank | Record | Monthly Average High Temperature | Normal Monthly High Temperature | Monthly Average Low Temperature | Normal Monthly Low Temperature |
| March 2012 | 63.6°F | +10.7°F | #1 hottest | 63.6°F 2012 | 75.7°F | 64.7°F | 51.5°F | 41.1°F |
| April 2012 | 67.5°F | +5.9°F | #3 hottest | 68.0°F 1896 | 78.1°F | 73.7°F | 56.8°F | 49.5°F |
| May 2012 | 75.8°F | +5.9°F | #1 hottest | 75.8°F 2012 | 87.5°F | 80.5°F | 64.0°F | 59.2°F |
| Spring 2012 | 69.0°F | +7.6°F | #1 hottest | 69.0°F 2012 | - | - | - | - |
| June 2012 | 82.6°F | +4.8°F | #9 hottest | 85.0°F 2011 | 95.0°F | 88.1°F | 70.1°F | 67.5°F |
| July 2012 | 88.0°F | +5.7°F | #4 hottest | 91.2°F 2011 | 100.6°F | 93.0°F | 75.5°F | 71.6°F |
| August 2012 | 83.8°F | +1.7°F | #36 hottest | 88.4°F 1936 | 95.8°F | 93.4°F | 71.7°F | 70.8°F |
| Summer 2012 | 84.8°F | +4.0°F | #6 hottest | 88.2°F 2011 | - | - | - | - |
| September 2012 | 77.3°F | +3.4°F | #19 hottest | 83.4°F 1939 | 88.9°F | 85.4°F | 65.7°F | 62.3°F |
| October 2012 | 62.0°F | -0.8°F | #50 coldest | 70.6°F 1963 | 74.0°F | 74.8°F | 49.9°F | 50.7°F |
| November 2012 | 53.1°F | +1.5°F | #40 hottest | 59.7°F 1909 | 67.4°F | 62.8°F | 38.8°F | 40.3°F |
| Fall 2012 | 64.1°F | +1.4°F | #35 hottest | 68.3°F 1931 | - | - | - | - |
* Hottest March on record, with the average temperature, average high temperature, and average low temperature all over 10°F above normal.
* 3rd hottest April on record, with the average temperature, average high temperature, and average low temperature all almost 5°F above normal.
* Hottest May on record, with the average temperature, average high temperature, and average low temperature all almost 5°F above normal.
* Hottest Spring on record, with the average temperature over 7°F above normal.
* 4th hottest July on record, with average high temperatures over 100°F.
* 6th hottest Summer on record, with an average temperature of 84.8°F (the record is 88.2°F from 2011).
* October was the only month with below normal average temperatures, as well as below normal average high and average low temperatures.
| Fort Smith, AR | Rainfall | Departure from 1981-2010 Normal | Rank | Record |
| March 2012 | 8.06" | +4.21" | #7 wettest | 0.50" 2007 |
| April 2012 | 2.99" | -1.31" | #48 driest | 0.36" 1903 |
| May 2012 | 1.15" | -4.32" | #3 driest | 0.38" 1886 |
| Spring 2012 | 12.20" | -1.42" | #74 driest | 3.44" 1936 |
| June 2012 | 1.57" | -2.71" | #20 driest | 0.38" 1914 |
| July 2012 | 3.91" | +0.61" | #36 wettest | 0.07" 2001 |
| August 2012 | 2.18" | -0.41" | #56 driest | Trace 2000 |
| Summer 2012 | 7.66" | -2.51" | #44 driest | 2.94" 1934 |
| September 2012 | 1.79" | -2.26" | #35 driest | 0.05" 1928 |
| October 2012 | 2.65" | -1.67" | #57 driest | Trace 1964 |
| November 2012 | 0.29" | -4.15" | #2 driest | 0.26" 1904 |
| Fall 2012 | 4.73" | -8.08" | #12 driest | 3.07" 1963 |
* 7th wettest March on record, with daily rainfall records on March 8th with 2.74 inches, and March 20th with 2.11 inches.
* 3rd driest May on record, with only 1.15 inches of rainfall (the average amount is 5.47 inches).
* 2nd driest November on record, with only 4 days of measurable precipitation totaling 0.29 inches of rainfall (the normal amount is 4.44 inches).
* 12th driest Fall on record, with only 4.73 inches of rainfall (the average amount is 12.81 inches).
Effects of the Heat and Drought
The extremely hot and dry conditions had dire consequences across all of the Southern Plains, including crop and livestock losses, water restrictions, losses in recreation due to low lake levels and blue algae outbreaks, and numerous heat related illnesses and deaths. A state wide burn ban was issued for much of August and September, however, several large wildfires still occurred, burning thousands of acres of pasture and farmland, along with destroying many homes.
 |
 |
|
Fire burning near Drumright, OK on Aug 4, 2012. Photo Credit: Tulsa World |
Firefighters fighting a fire near Mannford, OK on Aug 5, 2012. Photo Credit: Tulsa World |
So, why was it so hot and dry?
Much like the summer months of 2011, the spring and summer seasons of 2012 were very warm across much of the central US. The main contributing factor was a large and persistent area of high pressure which developed over the central portion of the nation, including the Midwest, Central, and Southern Plains. This large high promoted record breaking heat, and directed precipitation to the north, across the Northern Plains, and Great Lakes region, leaving the central part of the nation dry. Also, like in 2011, the unusually hot temperatures served to reinforce the large area of high pressure, making a change in the weather pattern difficult.
The NOAA Drought Task Force produced an assessment report of the 2012 Drought. The full report, as well as an executive summary and recorded briefing, can be found here: An Interpretation of the Origins of the 2012 Central Great Plains Drought
|
|
|
| Surface Weather Map from July 7, 2012 | High and Low Temperatures from July 7, 2012 |
What can we expect for the upcoming winter season?
Thus far, December 2012 has continued the dry and warm pattern, with below normal precipitation and above normal temperatures. The current and projected ENSO phase is neutral, meaning we are not experiencing El Nino (warmer than average sea surface temperatures) or La Nina (cooler than normal sea surface temperatures) conditions, and are not expecting either to develop over the next few months. This, along with other global and regional oscillations, lead forecasters to predict a slightly higher (33-40%) chance of a warmer than average winter season for Oklahoma and western Arkansas, along with a neutral to slightly above normal (33%) expected precipitation for eastern Oklahoma and western Arkansas. This does not mean, however, that the region will not receive any winter storm systems over the months of December - February, but that on average for the entire season we would expect slightly warmer and average to slightly above precipitation values. This projection would serve to continue the drought across much of the region, with the exception of portions of far eastern Oklahoma and western Arkansas, where the signal for above normal precipitation is highest.
 |
 |
 |
|
3-Month Temperature Outlook (issued Nov 15) |
3-Month Precipitation Outlook (issued Nov 15) |
3-Month Drought Outlook (issued Nov 15) |
For current forecast and drought conditions see the links below:
 |
 |
 |
| 3-Month Temperature Outlook | 3-Month Precipitation Outlook | 3-Month Drought Outlook |
Updated: April 16, 2013


