| |
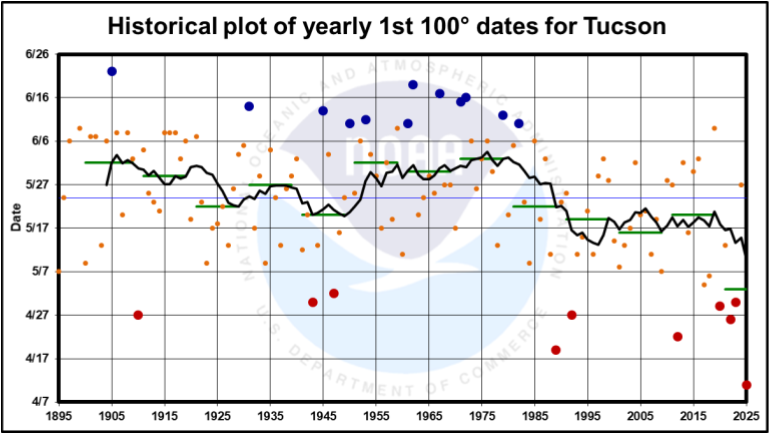
The 10 earliest 1st occurrences |
|
|
The 10 latest 1st occurrences |
| 1 |
March 19, 2026 |
1 |
June 22, 1905 |
| 2 |
April 11, 2025 |
2 |
June 19, 1962 |
| 3 |
April 19, 1989 |
3 |
June 17, 1967 |
| 4 |
April 22, 2012 |
4 |
June 16, 1972 |
| 5 |
April 26, 2022 |
5 |
June 15, 1971 |
| 6T |
April 27, 1910 |
6 |
June 14, 1931 |
| |
April 27, 1992 |
7 |
June 13, 1945 |
| 8 |
April 29, 2020 |
8 |
June 12, 1979 |
| 9T |
April 30, 2023 |
9 |
June 11, 1953 |
| |
April 30, 1943 |
10T |
June 10 in 1950, 1961 & 1982 |
|
| 1st 100° occurrences in Tucson by date |
| Dates |
# occurrences |
Year(s) |
| March 19 |
1 |
2026 |
| April 11 |
1 |
2025 |
| April 19 |
1 |
1989 |
| April 22 |
1 |
2012 |
| April 26 |
1 |
2022 |
| April 27 |
2 |
1910, 1992 |
| April 29 |
1 |
2020 |
| April 30 |
2 |
1943, 2023 |
| May 2 |
1 |
1947 |
| May 4 |
1 |
2017 |
| May 6 |
1 |
2018 |
| May 7 |
2 |
1895, 2009 |
| May 8 |
1 |
2001 |
| May 9 |
4 |
1900, 1923, 1934, 1984 |
| May 11 |
5 |
1960, 1988, 1993, 1996, 2007 |
| May 12 |
1 |
1941 |
| May 13 |
7 |
1903, 1927, 1937, 1944, 1978, 2002, 2021 |
| May 14 |
1 |
2000 |
| May 15 |
1 |
1994 |
| May 16 |
2 |
1948, 2014 |
| May 17 |
5 |
1924, 1932, 1956, 1970, 2003 |
| May 18 |
1 |
1925 |
| May 19 |
4 |
2008, 1986, 1958, 1920 |
| May 20 |
5 |
2005, 1980, 1963, 1942, 1907 |
| May 21 |
3 |
2006, 1995, 1914 |
| May 22 |
1 |
1926 |
| May 23 |
4 |
1990, 1983, 1922, 1913 |
| May 24 |
4 |
1964, 1949, 1936, 1896 |
| May 25 |
4 |
1991, 1966, 1951, 1912 |
| May 26 |
3 |
1974, 1938, 1928 |
| May 27 |
4 |
2024, 2011, 1969, 1968 |
| May 28 |
2 |
2010, 1999 |
| May 29 |
5 |
1997, 1965, 1955, 1939, 1933 |
| May 30 |
1 |
2015, 1977 |
| May 31 |
0 |
. |
| June 1 |
3 |
2013, 2004, 1957 |
| June 2 |
7 |
2016, 1998, 1987, 1975, 1940, 1918, 1909 |
| June 3 |
3 |
1954, 1946, 1929 |
| June 4 |
2 |
1935, 1911 |
| June 5 |
2 |
1981, 1930 |
| June 6 |
7 |
1985, 1976, 1973, 1952, 1919, 1904, 1897 |
| June 7 |
3 |
1921, 1902, 1901 |
| June 8 |
5 |
1917, 1916, 1915, 1908, 1906 |
| June 9 |
3 |
2019, 1959, 1899 |
| June 10 |
3 |
1982, 1961, 1950 |
| June 11 |
1 |
1953 |
| June 12 |
1 |
1979 |
| June 13 |
1 |
1945 |
| June 14 |
1 |
1931 |
| June 15 |
1 |
1971 |
| June 16 |
1 |
1972 |
| June 17 |
1 |
1967 |
| June 19 |
1 |
1962 |
| June 22 |
1 |
1905 |
| |
| Average 1st 100° occurrence by decade |
| 1900s |
June 1 |
Latest occurrence (June 22, 1905) |
| 1910s |
May 29 |
. |
| 1920s |
May 22 |
. |
| 1930s |
May 27 |
. |
| 1940s |
May 20 |
. |
| 1950s |
June 1 |
. |
| 1960s |
May 30 |
. |
| 1970s |
June 2 |
. |
| 1980s |
May 22 |
|
| 1990s |
May 19 |
. |
| 2000s |
May 16 |
. |
| 2010s |
May 21 |
|
| 2020s |
April 26 (7 yrs) |
.Earliest occurrence (March 19, 2026) |
|

