| HeatRisk Maps | Historical HeatRisk Data | ||||||
| No risk. | Risk to those extremely sensitive to heat. | Risk to those sensitive to heat. | Risk to most people. | Risk to everyone. |
| None | Minor | Moderate | Major | Extreme |
 Probability High Temperature is 120+ °F Probability High Temperature is 120+ °F |
||||||
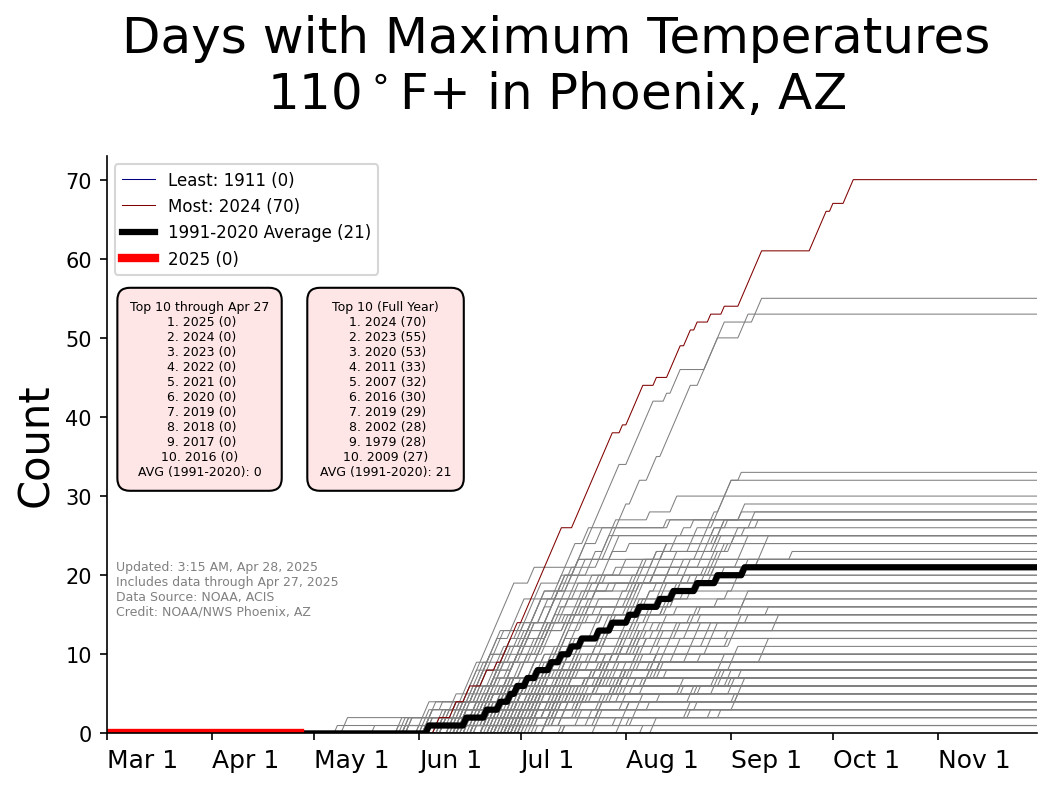
| Probability High Temperature is 110+ °F |
||||||
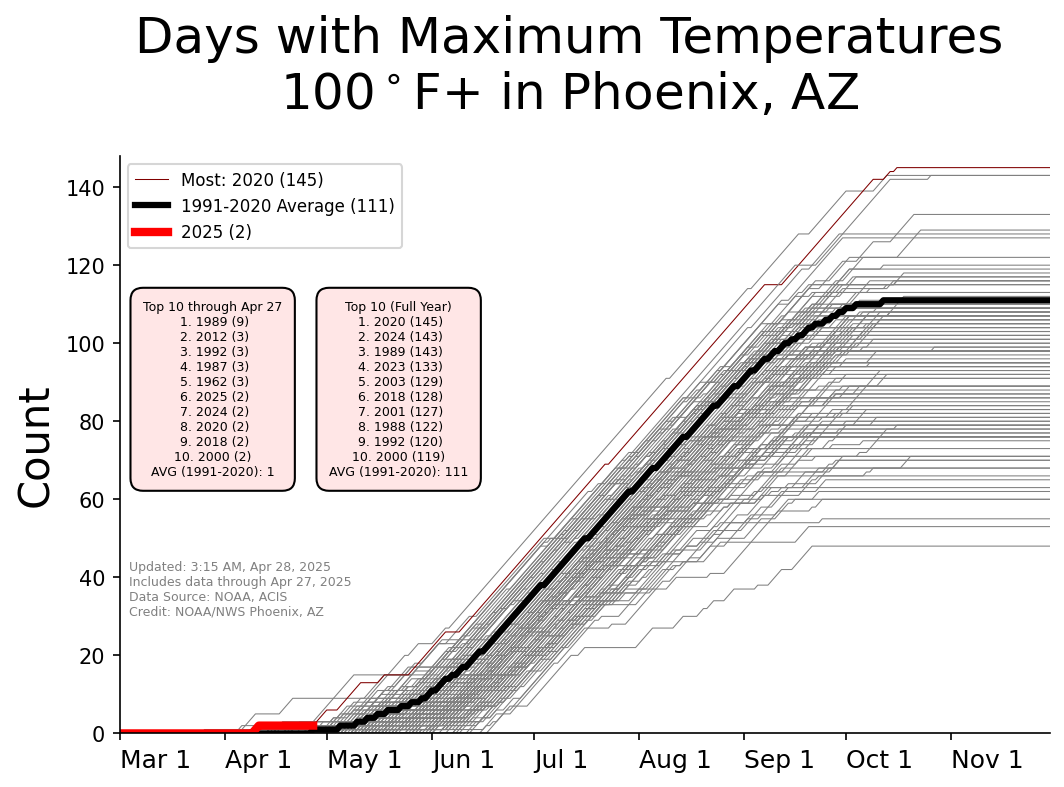
| Probability High Temperature is 100+ °F |
||||||
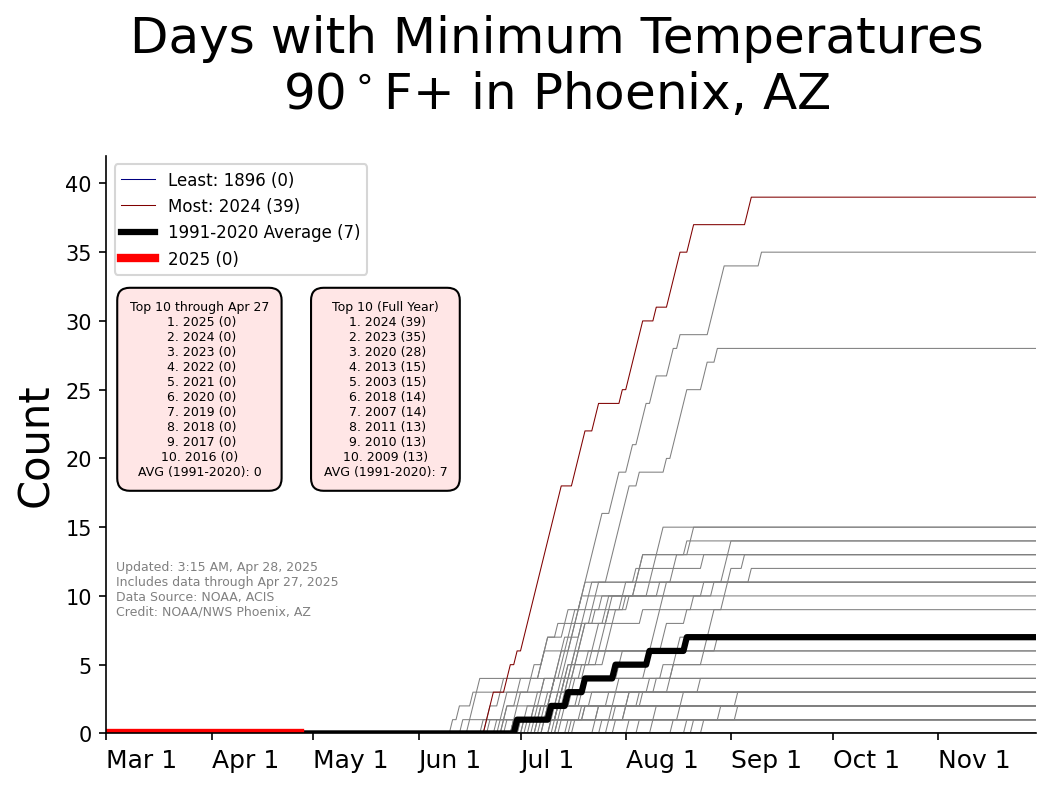
 Probability High Temperature is 90+ °F Probability High Temperature is 90+ °F |
||||||
| Probability High Temperature is 80+ °F |
||||||
| Daily Record High Maximum Temperatures | ||||||
| Daily Record Warm Minimum Temperatures | ||||||
|
Above: 33%
Near: 33%
Below: 33%
Probability of the average temperature during next week being above, near, or below normal. Get more from the NOAA/Climate Prediction Center |
 |
Heat is the deadliest weather in Arizona. During Arizona's hottest months, the NWS issues alerts to notify the public when unusually hot weather is expected. These alerts are intended to raise awareness and prevent heat illness and death from occurring and mitigate financial impacts. When the NWS issues an alert, it should serve as a signal that on that day it is not "business as usual."
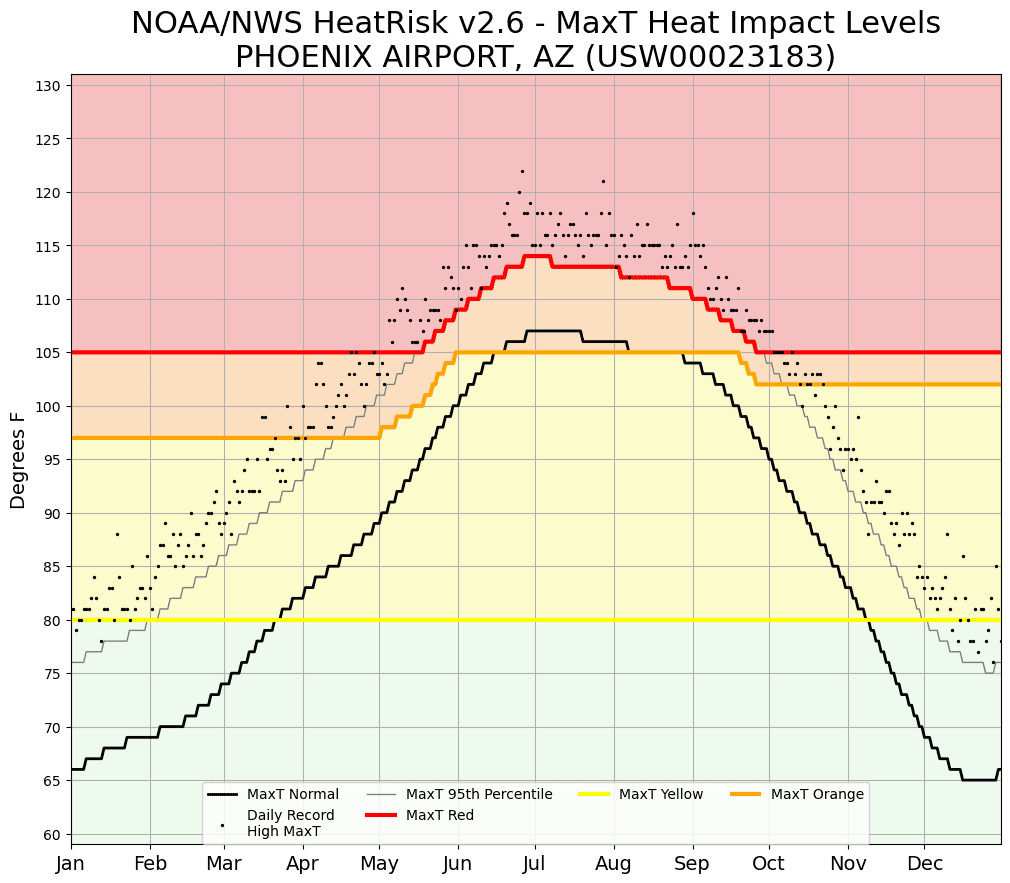
Collaborative research with the Centers for Disease Control and Prevention (CDC) shows that heat-associated deaths in Arizona can occur with temperatures in the mid 80s and hotter. Research also shows that our bodies have a greater ability to tolerate heat as the summer wears on, known as acclimation. For example, a temperature of 105 °F in May will seem hot, whereas the same temperature in June or July will not seem as hot because our bodies have acclimated to the heat. Hence, there is not one single, constant temperature used to determine when an alert will be issued. In order to better address heat risk and allow you to prepare for upcoming heat events, the NWS developed the experimental HeatRisk product.
| Level 0 (Green): No elevated risk. | Level 1 (Yellow): Minor Risk for those extremely sensitive to heat, especially those without effective cooling and/or adequate hydration. | Level 2 (Orange): Moderate Risk for those who are sensitive to heat, especially those without effective cooling and/or adequate hydration. | Level 3 (Red): Major Risk for much of the population, especially those who are heat sensitive and those without effective cooling and/or adequate hydration. | Level 4 (Magenta): Extreme Risk for entire population due to long duration heat, with little to no relief overnight. |
HeatRisk provides a quick view of potentially impactful heat conditions over the upcoming seven days based on how much above normal high and low temperatures are, the duration of unusual heat, and humidity (as represented by overnight low temperatures). HeatRisk is portrayed in a numeric (0-4) and color (green/yellow/orange/red/magenta) scale which is similar in approach to the Air Quality Index (AQI) or the UV Index. It provides one value each day that indicates the approximate level of heat risk concern for any location, along with identifying the groups who are most at risk. This product is complementary to the official NWS Watch/Warning/Advisory program and is meant to provide continuously available heat risk guidance for those decision makers and heat sensitive populations who need to take actions at levels that may be below current NWS heat product levels.
 |
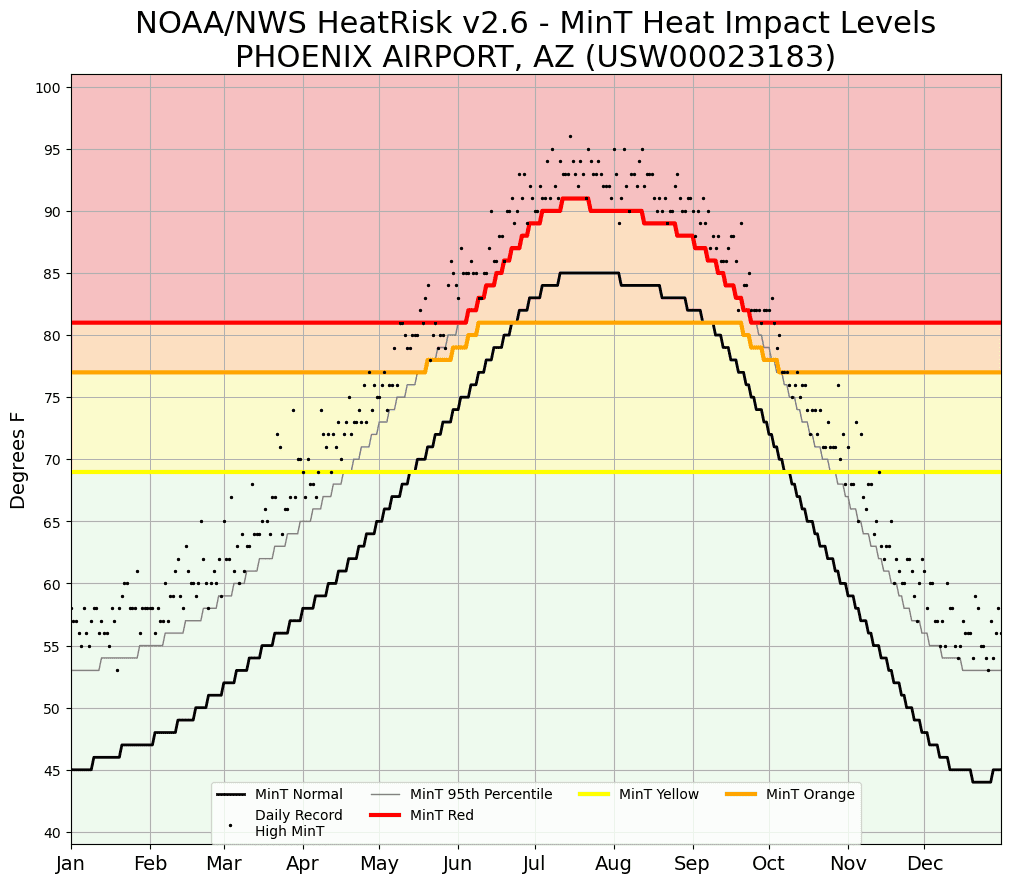 |
| HeatRisk temperature thresholds for Phoenix Sky Harbor International Airport. Click image for full version. Other locations available here. |
|
When "Major" or "Extreme" HeatRisk conditions are forecast, an Extreme Heat Watch or Extreme Heat Warning will be issued. An Extreme Heat Watch conveys a moderate (50%) confidence that extreme heat will occur. If confidence increases to a high (80%+) level, an Extreme Heat Warning is issued. An exception would be in the case of a mixture of periods of recommended Warnings and Advisories, where forecaster discretion and coordination with surrounding offices should determine the appropriate Legacy Product and messaging strategy. Both alerts are a way to give public and emergency officials a "heads up" that extreme temperatures are expected. Note that many lower elevation locations across the Southwest which experience chronic heat do not receive the lesser Heat Advisory alert.
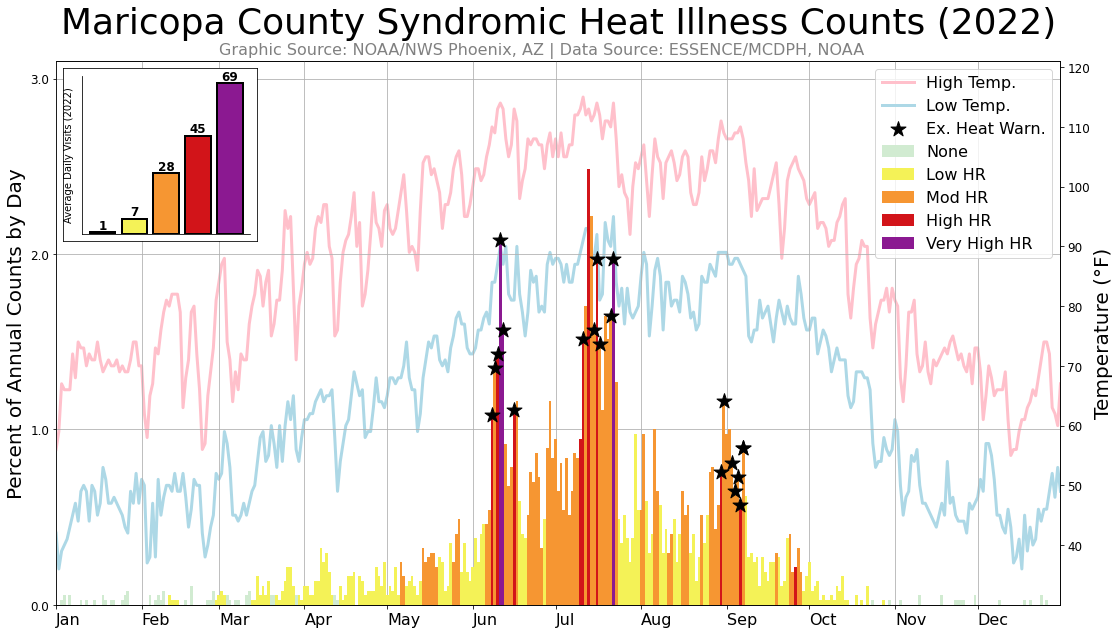
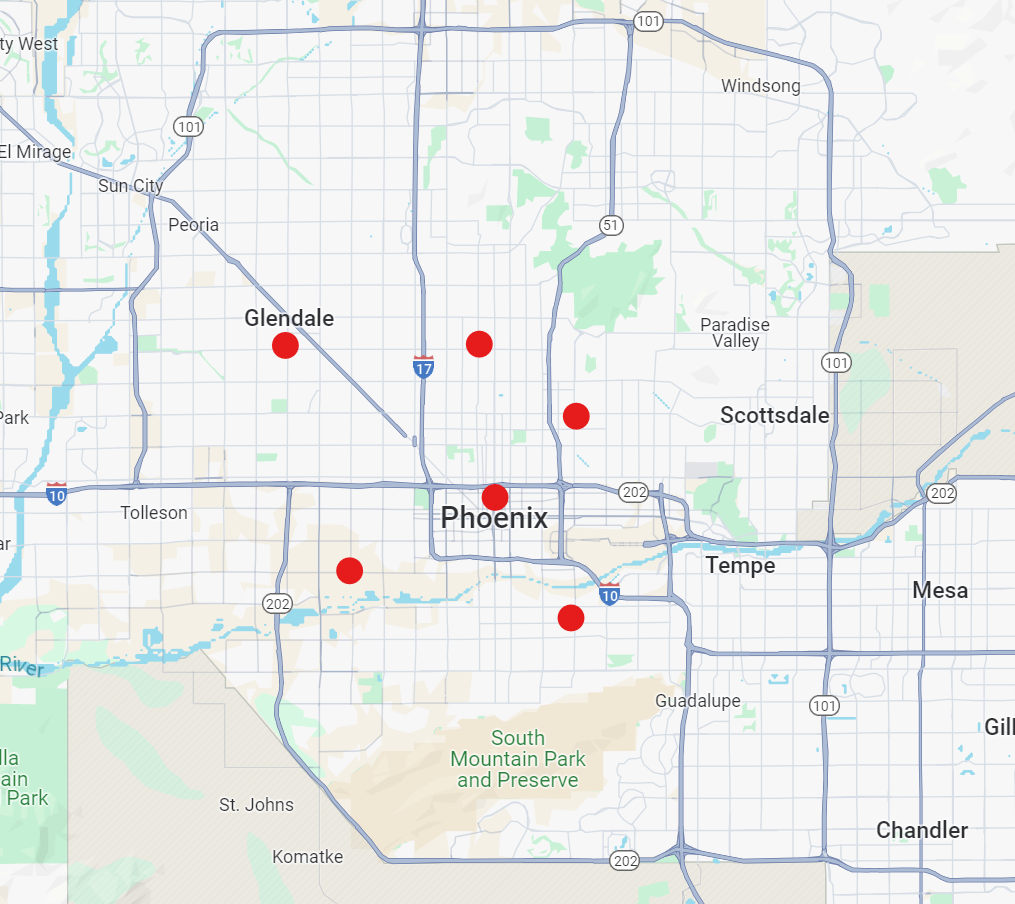
Based on an analysis of emergency room visits across Maricopa County during 2020 (and subsequent years), it has been found that HeatRisk categories accurately describe the level of heat-related illness. During the hottest days, with "Major (High)" and "Extreme (Very High)" HeatRisk categories, spikes in ER visits were noted. These days were generally coincident with the issuance of Extreme Heat Warnings. For lower risk days, ER visits were still noted but to a lesser degree. When averaging by HeatRisk category, there is a steady increase in ER visits for heat-related illness as intensity levels increase. Notably, heat-related illness was observed even on "Low" days, clearly indicating that even without official alerts heat can pose a significant health threat if precautions are not taken.
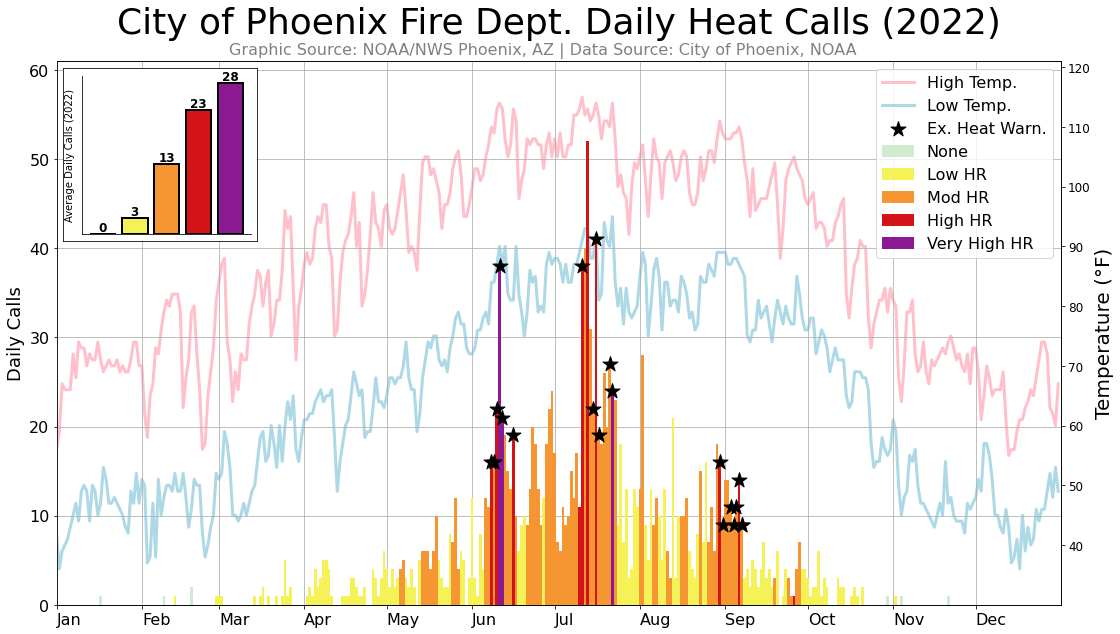
A similar analysis of heat-related emergency calls received by the City of Phoenix Fire Department showed a clear connection between call volume and HeatRisk category. During 2022, the largest spikes in calls were coincident with episodes including "Major (High) " and "Extreme (Very High)" HeatRisk levels. Averaged by HeatRisk category (inset), a clear stepwise function is revealed. Notably, calls are still received even on "Low" days, supporting continued risk to very sensitive groups.
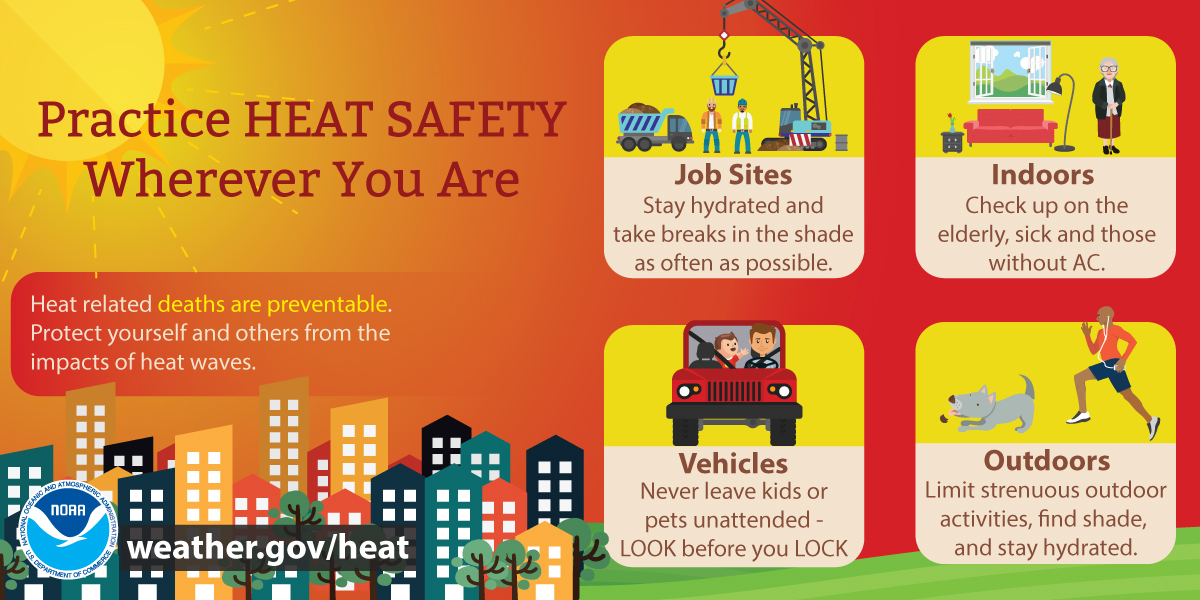
Preventing Heat-Related Illness
Your body keeps itself cool by letting heat escape through the skin, and by evaporating sweat (perspiration). If your body does not cool properly or does not cool enough, you might suffer from a heat-related illness.
Anyone can be susceptible to heat-related illness. Those at greatest risk are infants and young children, adults over 65, people who are homeless, people who are overweight, people who overexert during work or exercise, and people who are physically ill or on certain medications, such as for depression, insomnia, or poor circulation. Heat-related illness may be serious or even deadly if unattended.
Staying healthy during the summer is easier if you take the time to protect yourself by making sure you are drinking enough water and limiting your exposure to the heat. Follow these simple rules:
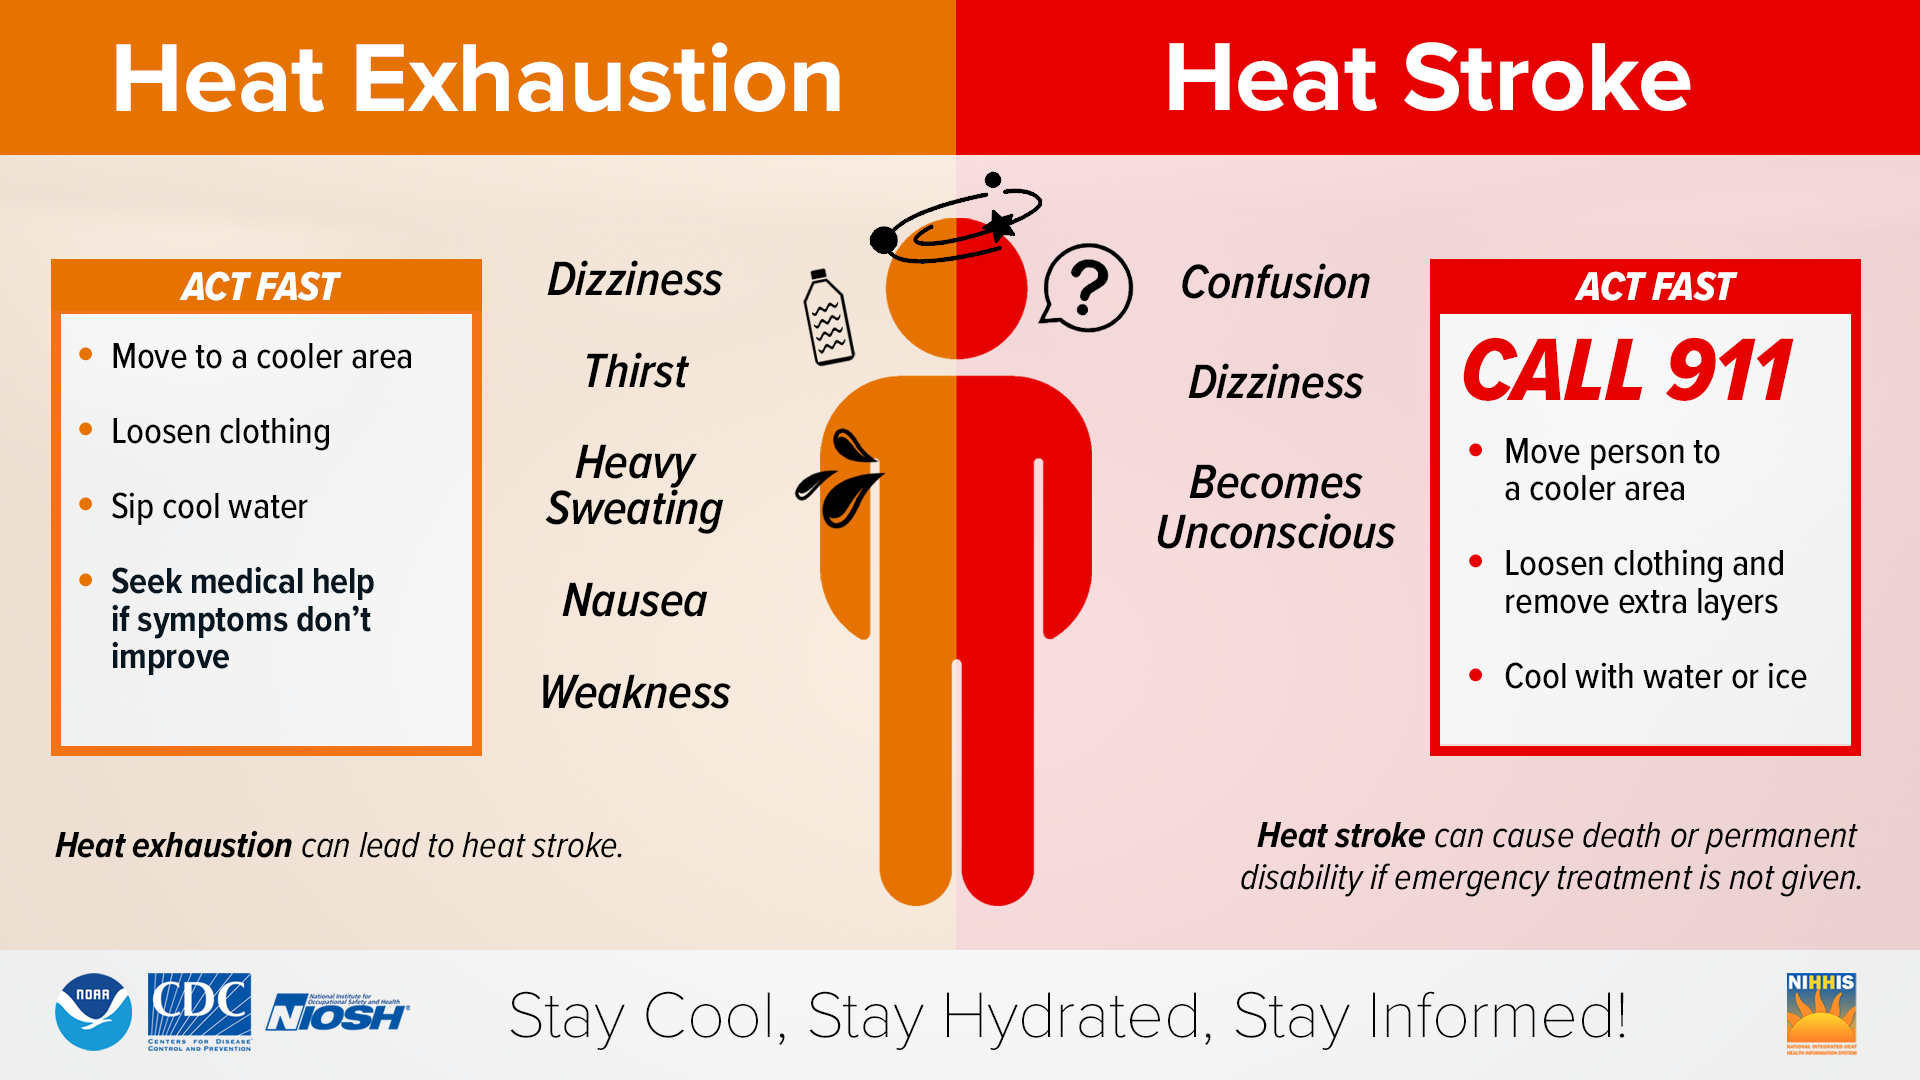
Signs & Symptoms of Heat-Related Illness
When temperatures are on the rise, watch for the following symptoms:
Stages of Heat-Related Illness
Heat-related illness usually comes in stages. The signal of the first stage is thirst. Drinking water at this stage can prevent you from progressing to the more serious kinds of heat related illnesses. The next stage is muscle cramps. These cramps can be mild or very painful. If you are caring for a person who has heat cramps, have him or her stop activity and rest. If the person is fully awake and alert, have him or her drink small amounts of cool water or a commercial sports drink. Gently stretch the cramped muscle and hold the stretch for about 20 seconds, then gently massage the muscle. Repeat these steps if necessary. If the victim has no other signals of heat-related illness, the person may resume activity after the cramps stop.
The signals of the next, more serious stage of a heat-related illness (often called heat exhaustion) include:
The warning signs of the most serious stage of a heat-related illness (often called heat stroke or sun stroke) vary but may include:
NOTE: Heat stroke is life threatening. Call 9-1-1 or the local emergency number if you are suffering from any of the above symptoms.
General Care for Heat Emergencies
General care for heat emergencies include cooling the body, giving fluids, and minimizing shock. For specific heat-related emergencies, follow these steps:
Additional Resources:
ADHS Extreme Weather & Public Health | CalOES Summer Heat Resources | CDC Extreme Heat | EPA Extreme Heat
Phoenix, AZ Area
2025 (10 through Jul 1): Jun 14 to Jun 20, Jun 29 to Jul 1
2024 (45): Jun 5 to Jun 7, Jun 11 to Jun 16, Jun 20 to Jun 21, Jul 4 to Jul 13, Jul 19 to Jul 20, Aug 3 to Aug 5, Aug 19 to Aug 20, Sep 4 to Sep 6, Sep 25 to Oct 8
2023 (42): Jul 1 to Jul 29, Aug 4 to Aug 7, Aug 16 to Aug 17, Aug 26 to Aug 30, Sep 9 to Sep 10
2022 (17): Jun 8 to Jun 12, Jun 16, Jul 11, Jul 16, Jul 21 to Jul 22, Aug 30 to Aug 31, Sep 3 to Sep 7
2021 (20): Jun 12 to Jun 20, Jul 9 to Jul 11, Aug 3 to Aug 4, Aug 25 to Aug 27, Sep 9, Sep 12 to Sep 13
2020 (49): Apr 26 to Apr 30, May 6 to May 7, May 27 to May 31, Jun 2 to Jun 4, Jul 10 to Jul 13, Jul 19, Jul 29 to Aug 4, Aug 9 to Aug 10, Aug 12 to Aug 20, Aug 24 to Aug 28, Sep 4 to Sep 7, Sep 17
2019 (24): Jun 11 to Jun 13, Jul 11 to Jul 12, Jul 15 to Jul 16, Jul 27 to Jul 28, Aug 3 to Aug 5, Aug 13 to Aug 16, Aug 20 to Aug 21, Aug 27 to Aug 28, Aug 30 to Aug 31, Sep 4, Sep 7
2018 (16): May 6, Jun 3 to Jun 4, Jun 12 to Jun 13, Jun 21 to Jun 22, Jul 5 to Jul 6, Jul 23 to Jul 25, Aug 6 to Aug 7, Sep 14 to Sep 15
2017 (19): Jun 4 to Jun 7, Jun 17 to Jun 26, Jul 5 to Jul 7, Aug 29 to Aug 30
2016 (11): Jun 3 to Jun 6, Jun 19 to Jun 23, Jul 22 to Jul 23
2015 (13): Jun 16 to Jun 21, Aug 4 to Aug 5, Aug 13 to Aug 17
2014 (7): Jun 2 to Jun 4, Jul 23 to Jul 24, Jul 30 to Jul 31
2013 (14): Jun 2, Jun 7, Jun 12, Jun 28 to Jul 3, Aug 1, Aug 16 to Aug 18, Aug 20
2012 (20): May 21 to May 22, May 31 to Jun 1, Jun 18, Jun 27 to Jun 30, Jul 9 to Jul 10, Aug 6 to Aug 14
2011 (22): Jun 22, Jun 27 to Jun 29, Jul 1 to Jul 3, Aug 2 to Aug 3, Aug 18, Aug 22 to Sep 1, Sep 4
2010 (24): Jun 6 to Jun 7, Jun 30 to Jul 2, Jul 8 to Jul 10, Jul 13 to Jul 21, Aug 5, Aug 13 to Aug 15, Aug 23 to Aug 24, Sep 3
2009 (20): Jul 11 to Jul 14, Jul 17 to Jul 20, Jul 26 to Jul 28, Aug 2 to Aug 6, Aug 27 to Aug 30
2008 (20): May 18 to May 20, Jun 14 to Jun 22, Jul 1 to Jul 3, Jul 18, Jul 31 to Aug 2
2007 (5): Jul 4 to Jul 5, Aug 12 to Aug 13, Aug 29
2006 (8): Jun 3 to Jun 5, Jul 14 to Jul 15, Jul 21 to Jul 23
Yuma, AZ Area
2023 (34): Jul 1 to Jul 5, Jul 11 to Jul 22, Jul 25 to Jul 29, Aug 5 to Aug 7, Aug 16 to Aug 17, Aug 26 to Aug 30, Sep 9 to Sep 10
2022 (11): Jun 9 to Jun 12, Jul 11, Jul 21 to Jul 22, Aug 30 to Aug 31, Sep 6 to Sep 7
2021 (22): Jun 14 to Jun 20, Jun 27 to Jun 28, Jul 9 to Jul 11, Aug 3 to Aug 5, Aug 25 to Aug 29, Sep 12 to Sep 13
2020 (39): Apr 26 to Apr 30, May 6 to May 7, May 27 to May 29, Jun 3 to Jun 4, Jul 11 to Jul 13, Jul 19, Jul 30 to Aug 3, Aug 13 to Aug 20, Aug 24 to Aug 28, Sep 4 to Sep 7, Sep 17
2019 (18): Jun 11 to Jun 13, Jul 15 to Jul 16, Aug 3 to Aug 5, Aug 13 to Aug 16, Aug 20 to Aug 21, Aug 30 to Aug 31, Sep 4
2018 (11): May 6, Jun 13, Jun 22, Jul 5 to Jul 6, Jul 23 to Jul 25, Jul 26, Aug 6, Sep 8
2017 (16): May 23, Jun 17 to Jun 26, Jul 7, Aug 27 to Aug 30
2016 (9): Jun 3 to Jun 5, Jun 19 to Jun 22, Jul 22 to Jul 23
2015 (13): Jun 16 to Jun 21, Aug 4 to Aug 5, Aug 13 to Aug 17
2014 (5): Jul 23 to Jul 24, Jul 30 to Jul 31, Aug 30
2013 (8): Jun 7, Jun 28 to Jul 3, Aug 17
2012 (17): May 13, May 14, May 21 to May 22, May 31 to Jun 1, Jun 18, Jul 9 to Jul 11, Aug 8 to Aug 14
2011 (8): Jun 28, Jul 2 to Jul 3, Aug 2 to Aug 4, Aug 29, Sep 8
2010 (6): Jul 17 to Jul 18, Aug 24 to Aug 25, Sep 3 to Sep 4
2009 (16): Jul 11 to Jul 14, Jul 17 to Jul 20, Jul 26 to Jul 28, Aug 5, Aug 27 to Aug 30
2008 (23): May 18 to May 20, Jun 14 to Jun 23, Jun 30 to Jul 3, Jul 18, Aug 1 to Aug 2, Sep 6
2007 (3): Jul 4 to Jul 5, Aug 29
2006 (7): Jun 3 to Jun 4, Jul 14 to Jul 15, Jul 21 to Jul 23
El Centro, CA Area
2023 (34): Jul 1 to Jul 5, Jul 11 to Jul 22, Jul 25 to Jul 29, Aug 5 to Aug 7, Aug 16 to Aug 17, Aug 26 to Aug 30, Sep 9 to Sep 10
2022 (22): Jun 9 to Jun 12, Jul 11, Jul 15 to Jul 17, Jul 21 to Jul 22, Aug 30 to Sep 7, Sep 25 to Sep 27
2021 (23): Jun 14 to Jun 20, Jun 27 to Jun 28, Jul 9 to Jul 12, Aug 3 to Aug 5, Aug 25 to Aug 29, Sep 12 to Sep 13
2020 (38): Apr 26 to Apr 30, May 6 to May 7, May 27 to May 29, Jun 3 to Jun 4, Jul 11 to Jul 13, Jul 30 to Aug 3, Aug 13 to Aug 20, Aug 24 to Aug 28, Sep 4 to Sep 7, Sep 17
2019 (21): Jun 11 to Jun 12, Jul 12 to Jul 16, Jul 27 to Jul 28, Aug 3 to Aug 5, Aug 13 to Aug 16, Aug 20 to Aug 21, Aug 30 to Aug 31, Sep 4
2018 (15): May 6, May 9, Jun 3 to Jun 4, Jun 13, Jun 22, Jul 6, Jul 23 to Jul 27, Aug 6 to Aug 7, Sep 8
2017 (15): May 23, Jun 18 to Jun 26, Jul 7, Aug 27 to Aug 30
2016 (15): Jun 3 to Jun 5, Jun 19 to Jun 22, Jun 29, Jul 22 to Jul 23, Jul 27 to Jul 28, Aug 15 to Aug 17
2015 (13): Jun 16 to Jun 21, Aug 4 to Aug 5, Aug 13 to Aug 17
2014 (5): Jul 23 to Jul 24, Jul 30 to Jul 31, Aug 30
2013 (8): Jun 7, Jun 28 to Jul 3, Aug 17
2012 (17): May 13 to May 14, May 21 to May 22, May 31 to Jun 1, Jun 18, Jul 9 to Jul 11, Aug 8 to Aug 14
2011 (5): Jun 28, Jul 2, Aug 29, Aug 31, Sep 8
2010 (6): Jul 17 to Jul 18, Aug 24 to Aug 25, Sep 3, Sep 4
2009 (16): Jul 11 to Jul 14, Jul 17 to Jul 20, Jul 26 to Jul 28, Aug 5, Aug 27 to Aug 30
2008 (20): May 18 to May 20, Jun 14 to Jun 23, Jun 30 to Jul 3, Jul 18, Aug 1 to Aug 2, Sep 6
2007 (3): Jul 4 to Jul 5, Aug 29
2006 (7): Jun 3 to Jun 4, Jul 14 to Jul 15, Jul 21 to Jul 23

