Key NWS Flood Inundation Mapping links:
Flooding is the most frequent severe-weather related and the costliest natural disaster in the United States. Iowa is no stranger to flooding either. Historically, flooding has totally or partially accounted for 80% of all Presidential disaster declarations involving the state.
To help officials and the public prepare for, mitigate, and respond to flooding, the National Weather Service (NWS) is adding experimental flood inundation mapping to its forecast services. These new services put water on the map at the neighborhood scale. They show where, when, and how much flood waters are forecast. They also help communicate the timing and magnitude of high water events by showing modeled inundated areas.
On September 3, 2025, these services were expanded to 60% of the U.S. population including Iowa. Note that the real-time flood inundation mapping will be visible only when flooding is occurring or forecast. Additional NWS flood inundation mapping products will be introduced in future releases. When deployed for 100% of the U.S. population in 2026, NWS flood inundation mapping will be available for 110,000 river miles near NWS river forecast center forecast point locations, and for 3.4 million river miles covered by NWS National Water Model forecast guidance. The NWS first launched its flood inundation mapping services in the fall of 2023, covering 10% of the country’s population in portions of Louisiana, New York, Pennsylvania, and Texas.
"Flooding is the most frequent severe weather-related threat, and our costliest natural disaster," said David Vallee, Director, Service Innovation and Partnership Division, NOAA’s National Water Center. "Expanding our flood inundation mapping availability has been a game-changer in providing actionable, real-time information to emergency and water resource managers, and will expand the delivery of impact-based decision support services to our core partners who work to keep Americans safe and informed."
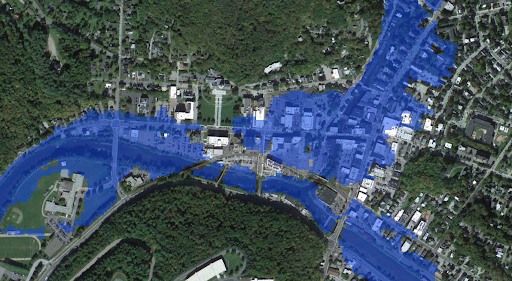 |
| NWS flood inundation map showing expected inundation in a city and adjoining areas. Credit: NOAA’s Office of Water Prediction. |
NWS flood inundation maps are available on its new National Water Prediction Service website--which was unveiled in late March 2024--and on a few Geographic Information System (GIS) applications. NWS flood inundation mapping services for the lower 48 states include the following options:
Flood inundation corresponding to the National Water Model latest streamflow analysis.
Flood inundation corresponding to the maximum stage in the five-day forecast from the official, traditional NWS streamflow predictions.
Flood inundation corresponding to the maximum stage in the five-day forecast guidance from the National Water Model.
Static categorical flood inundation mapping (i.e., CatFIM) for select NWS river forecast locations within the flood inundation mapping domain.
Separate FIM from NWS partners (i.e., partner FIM) such as the Iowa Flood Center at the University of Iowa for select locations within the flood inundation mapping domain.
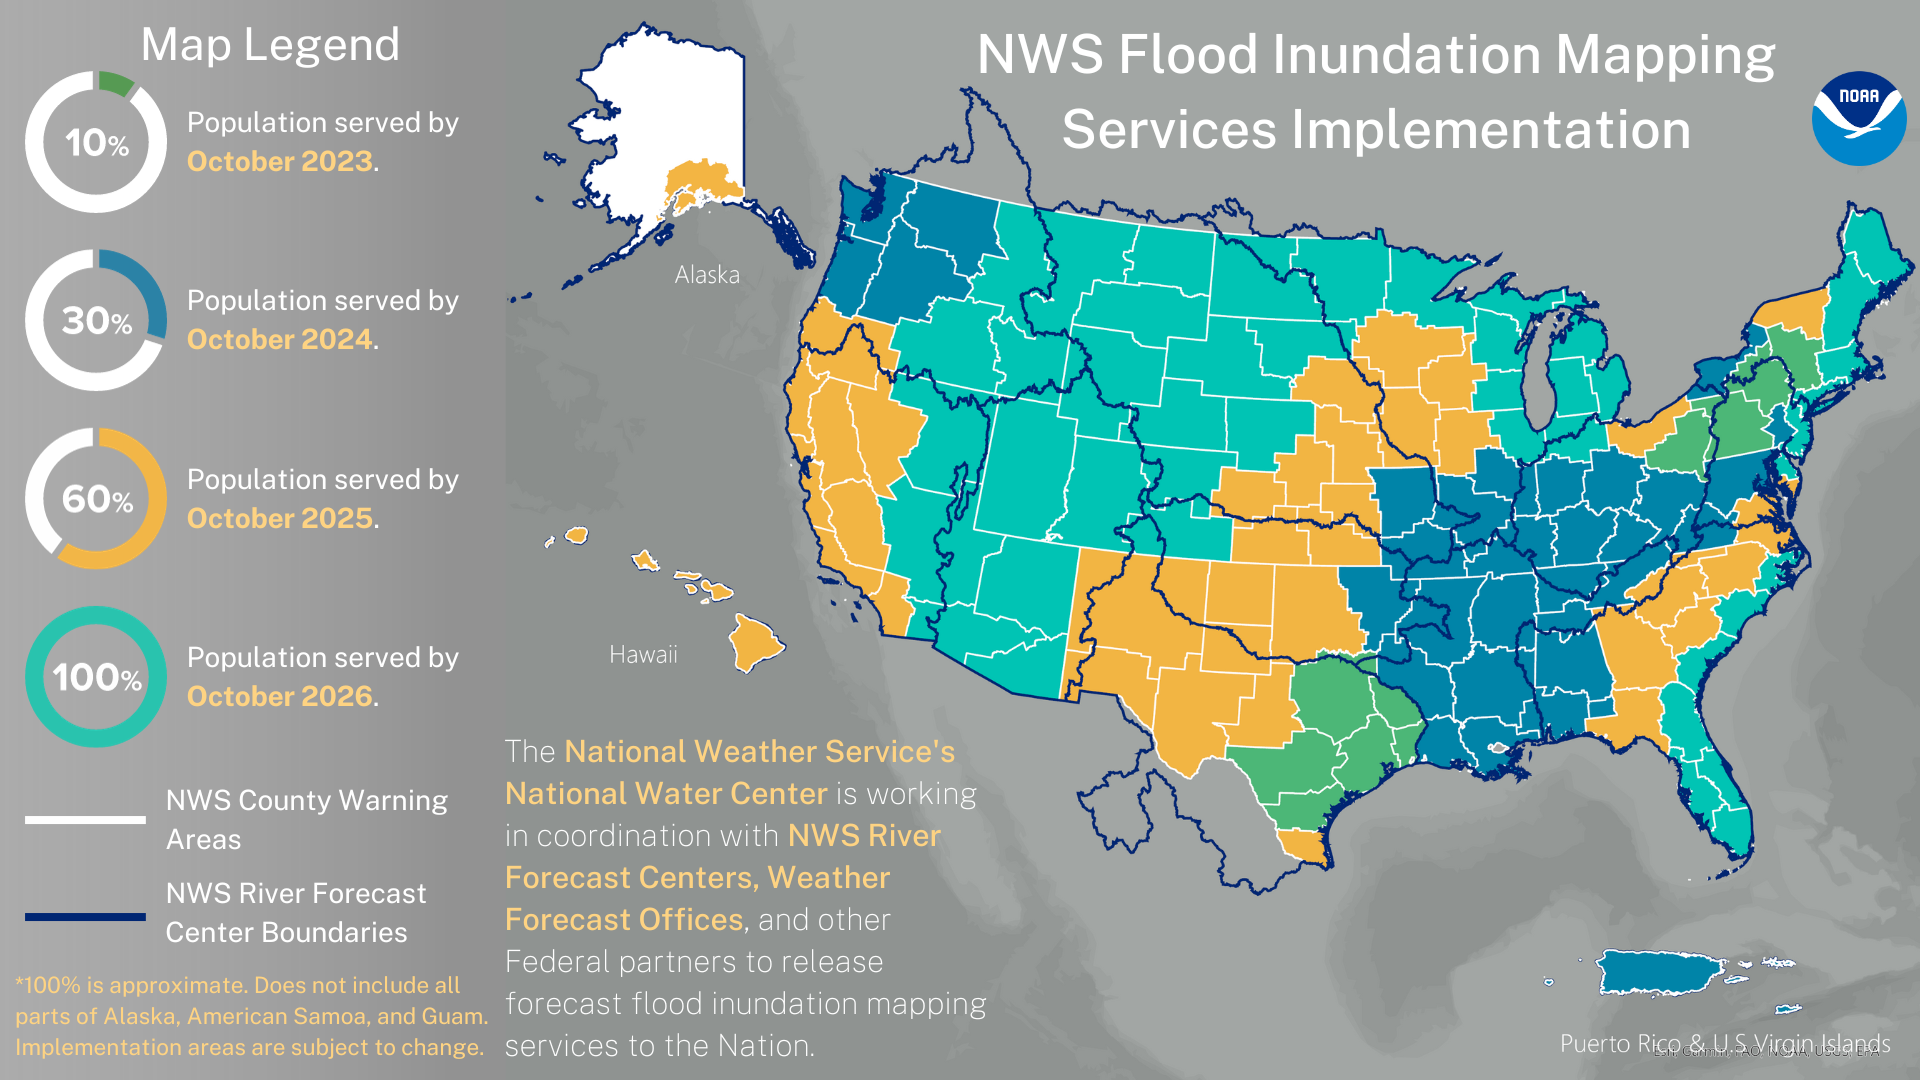 |
| NWS flood inundation mapping implementation schedule. Credit: NOAA’s Office of Water Prediction. |
To develop the new maps, NOAA’s NWS National Water Center worked in coordination with the National Weather Service's river forecast centers (RFCs) and its local weather forecast offices (WFOs) along with Federal and other partners. New NWS flood inundation mapping services leverage the Height Above Nearest Drainage (HAND) method, which is a low-complexity, terrain-based approach for inundation mapping. It uses the Digital Elevation Model (DEM) produced by the U.S. Geological Survey’s (USGS) 3DElevation Program and the NHDPlus Hydrography stream network dataset produced by the USGS to create a "hydrofabric." The hydrofabric represents the land surface elevations at the 10 meter resolution, consistent with the location of the stream and river channel network represented as vectors or lines.
The NWS is collaborating with its state, local, and federal partners who may already have their own flood inundation maps to help ensure officials have the best possible information to inform their decisions and actions regarding protection of life and property.
Additional NWS Flood Inundation Mapping Resources
NWS Office of Water Prediction (OWP)--see the FIM Services section
Feel free to contact us with your questions or suggestions. You can also provide feedback through this national survey. We look forward to continuing to work with you as the NWS transforms into a more nimble, flexible and mobile agency providing essential services to you.

