|
Current Conditions and Seven Day Forecast |
||
| Current Conditions | Forecast | Severe Weather | Hydrology/Rivers | Winter Weather | Fire Weather | Safety |
** Give us feedback on our flood impact statements and flood inundation mapping **
** Send us your flooding reports **
Reservoir Forecasts--provided daily by the U.S. Army Corps of Engineers
 |
 |
 |
| Saylorville Lake Forecast | Related Info | Lake Red Rock Forecast | Related Info | Coralville Lake Forecast (NWS Quad Cities Service Area) | Related Info |
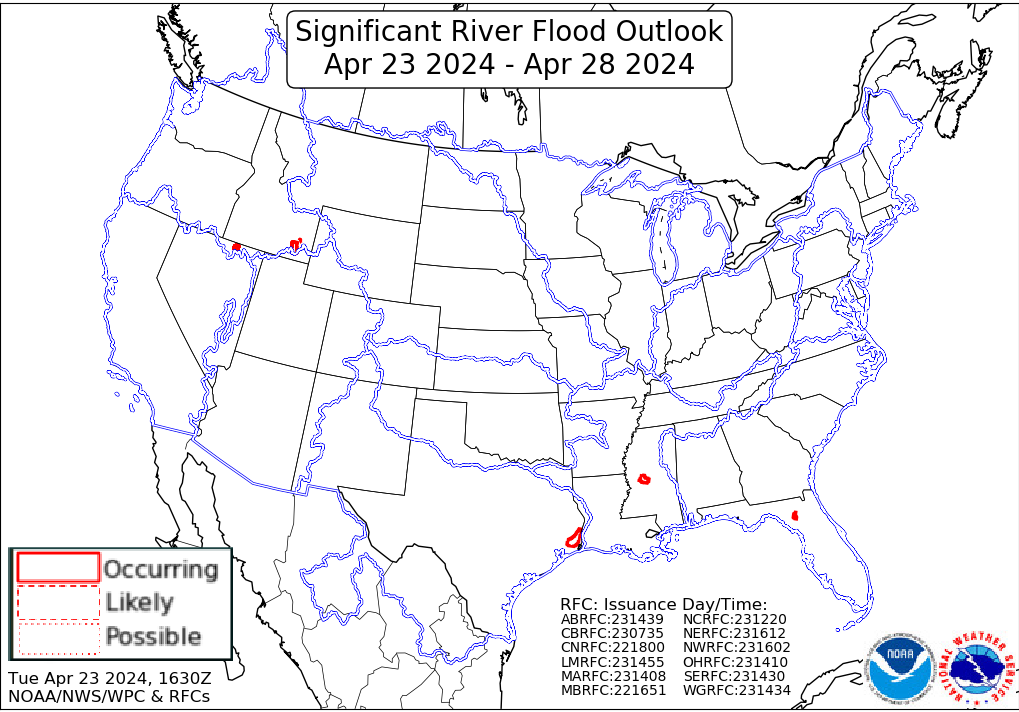
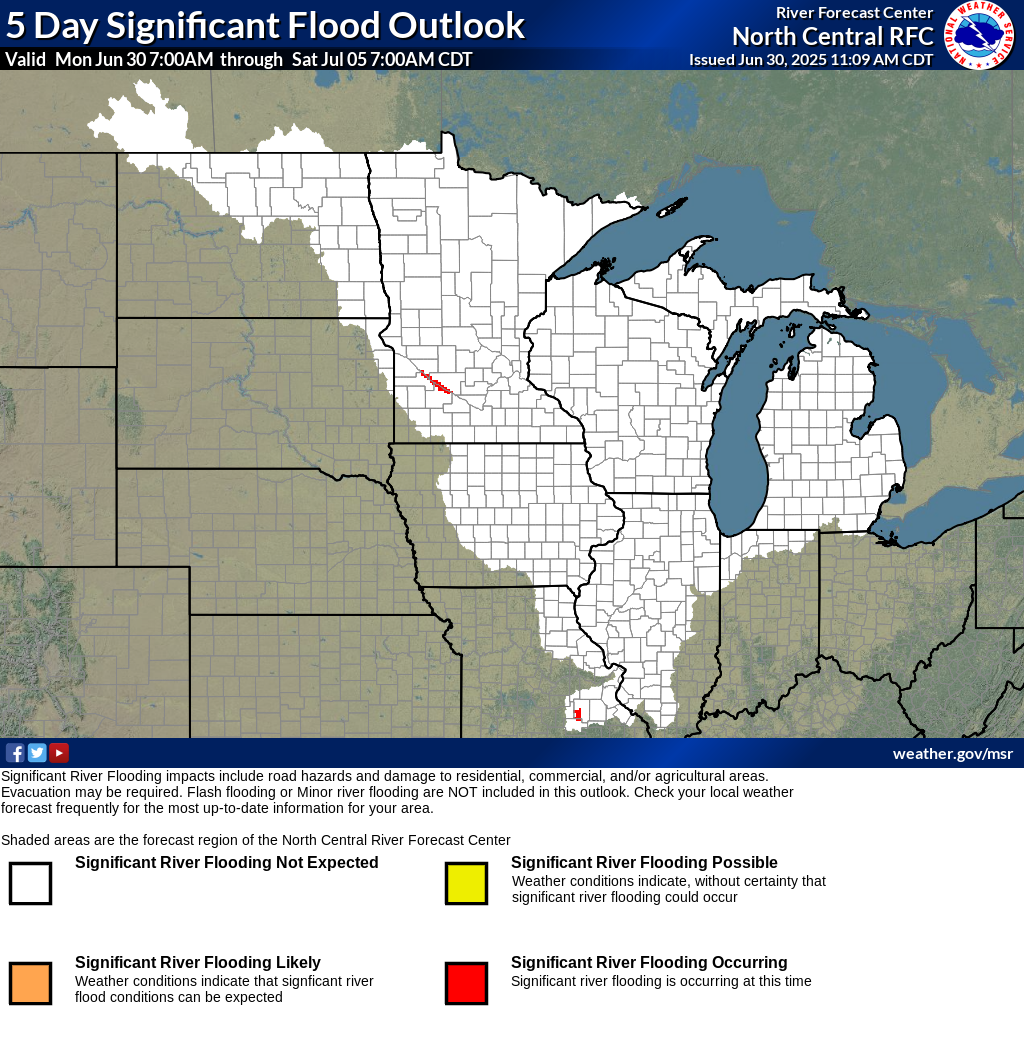
Significant River Flood & Flood Hazard Outlook Graphics
 |
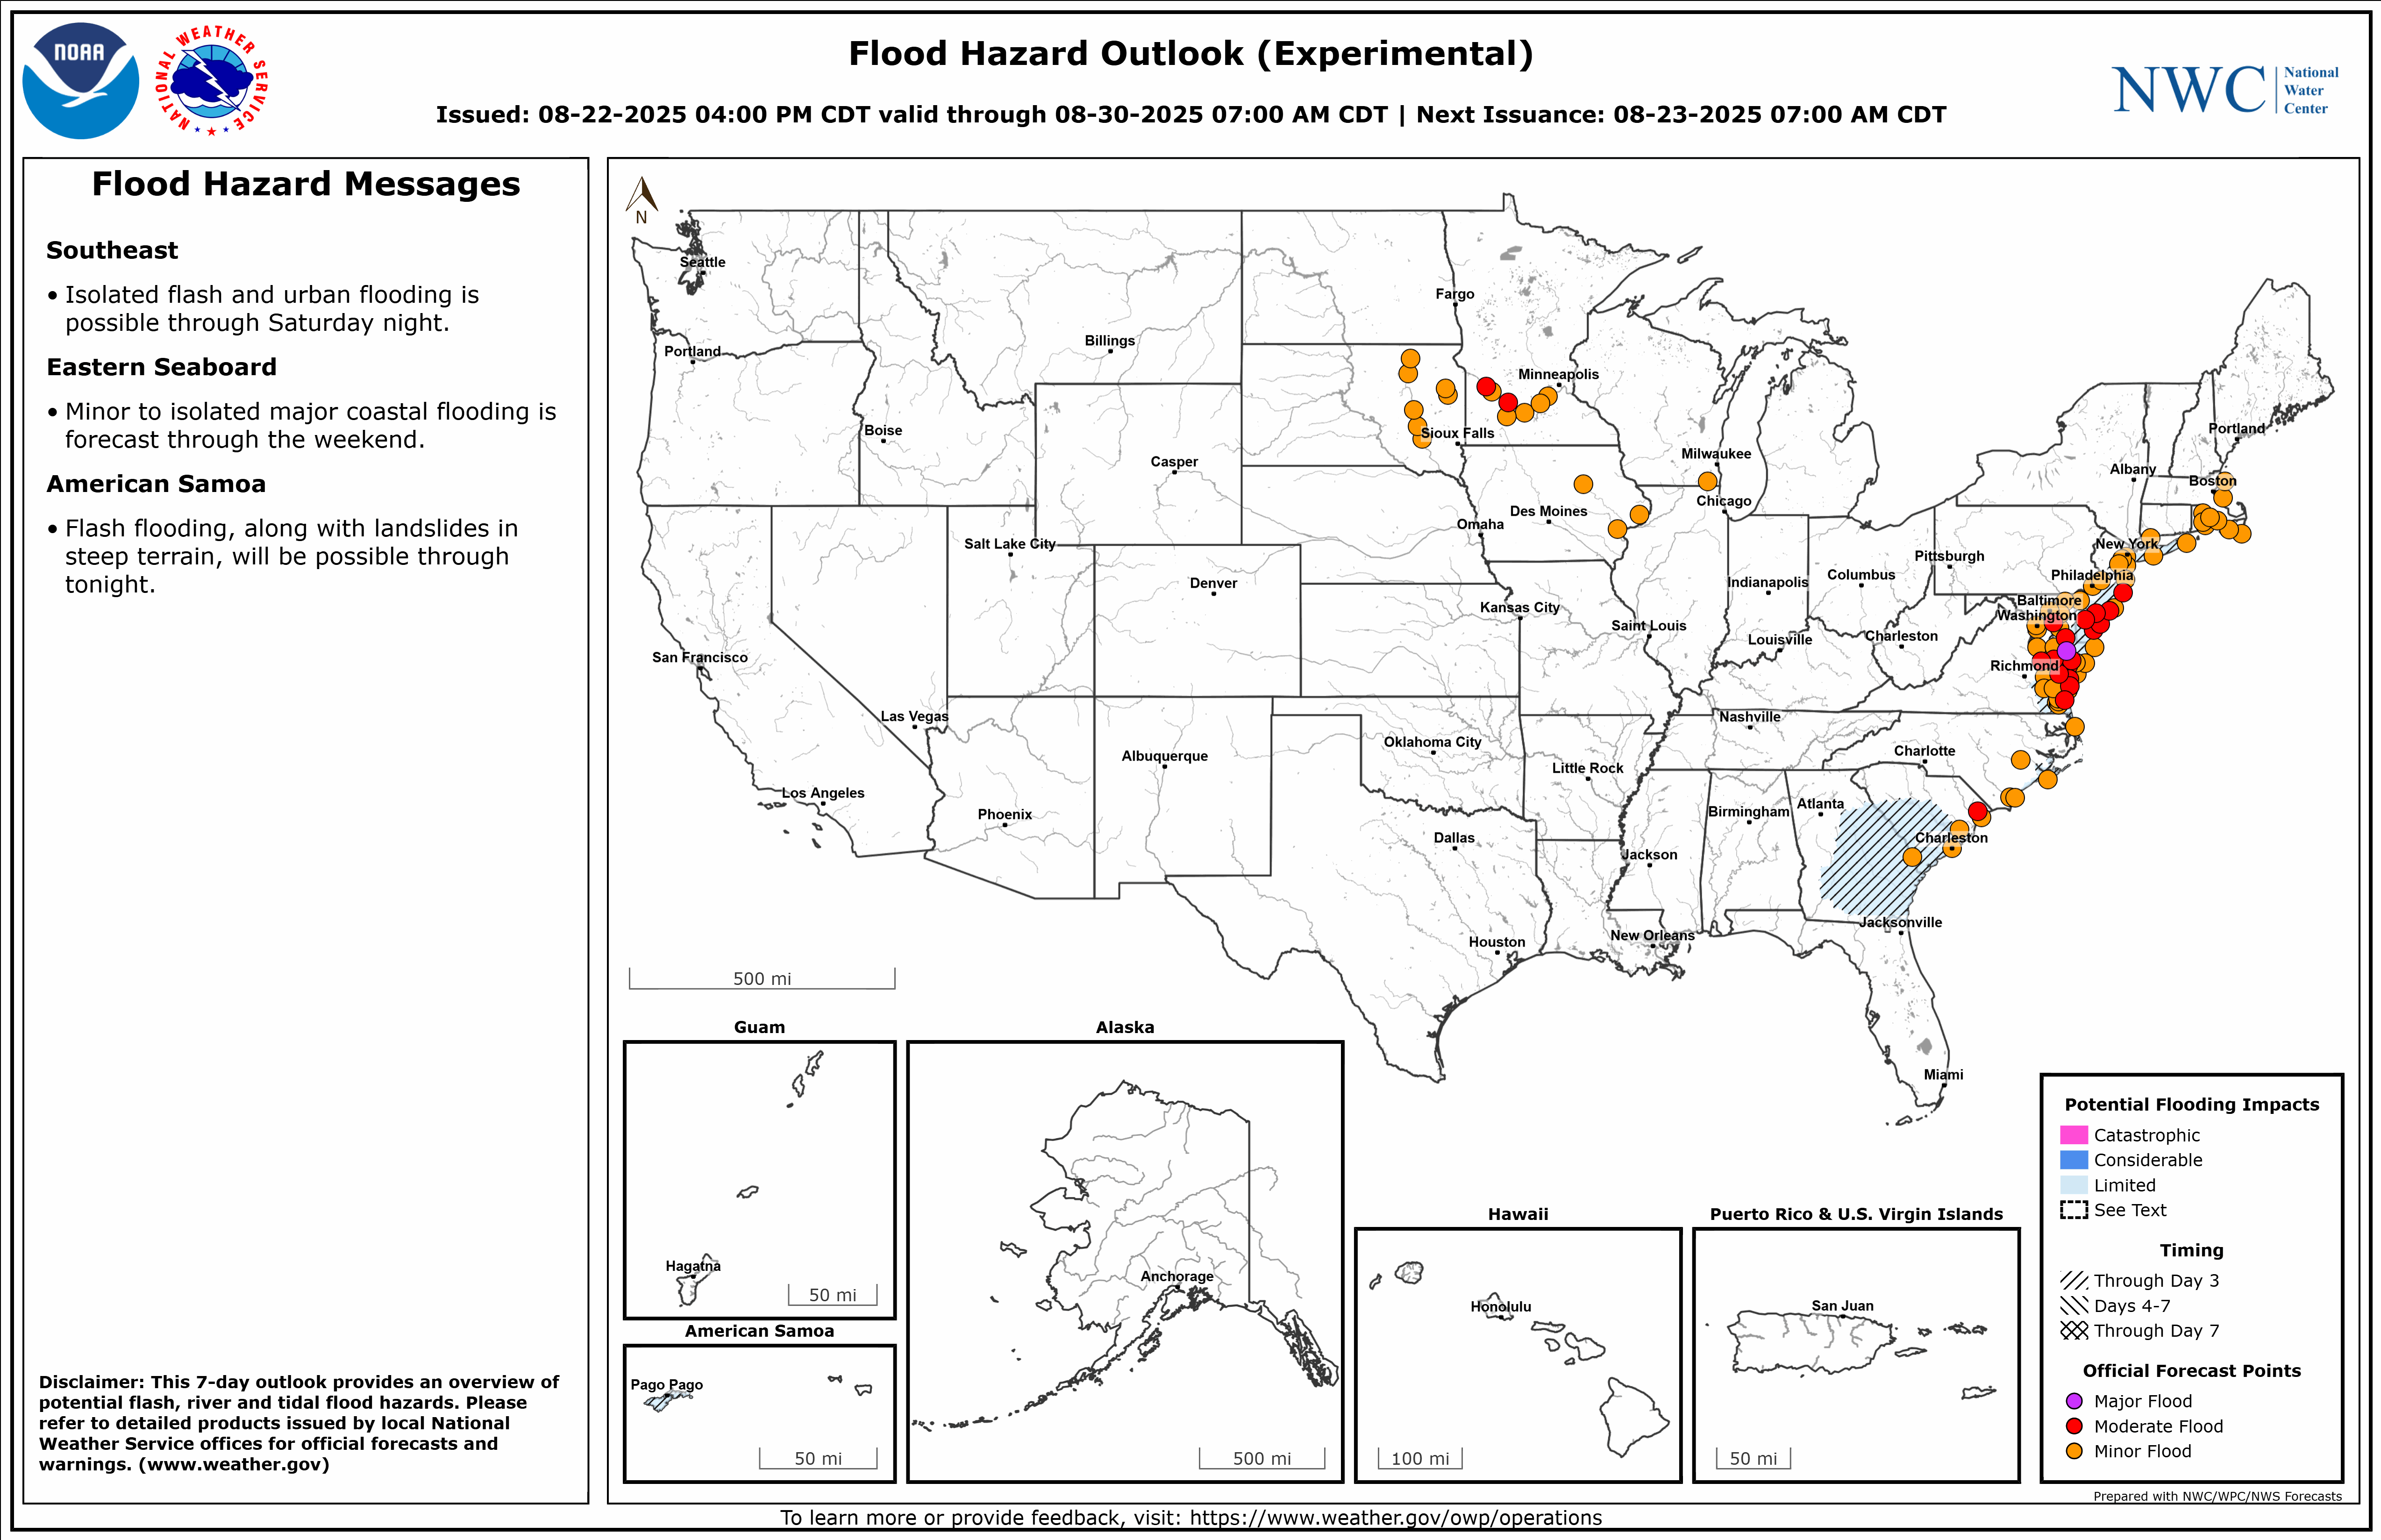 |
| Significant River Flood Outlook | Flood Hazard Outlook |
 |
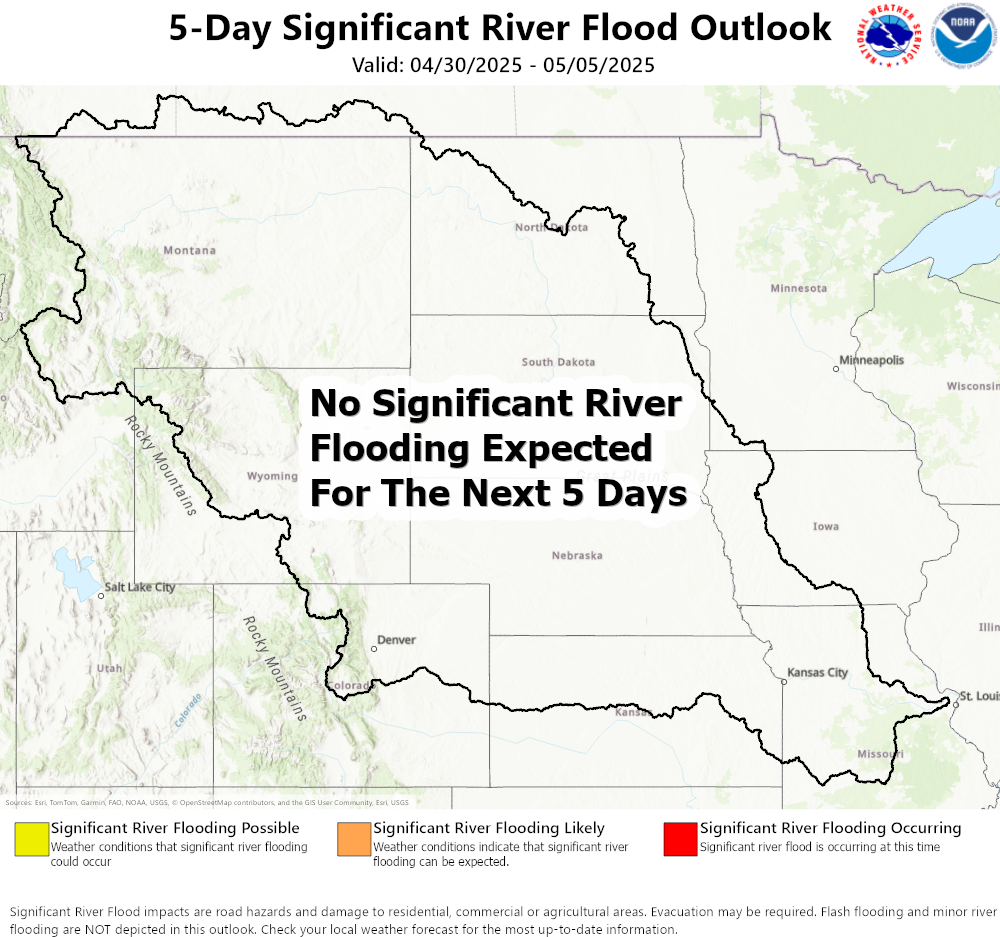 |
| Significant River Flood Outlook (NCRFC) | Significant River Flood Outlook (MBRFC) |
General Hazards Outlook Graphics
 |
 |
| Days 3-7 All Hazards Outlook | Days 8-14 All Hazards Outlook |
 |
 |
|
| NWS Radar Mosaic--Iowa | 1-Hour Quantitative Precipitation Estimates (QPE)--NWS Des Moines Service Area | Storm Total Quantitative Precipitation Estimates (QPE)--NWS Des Moines Service Area |
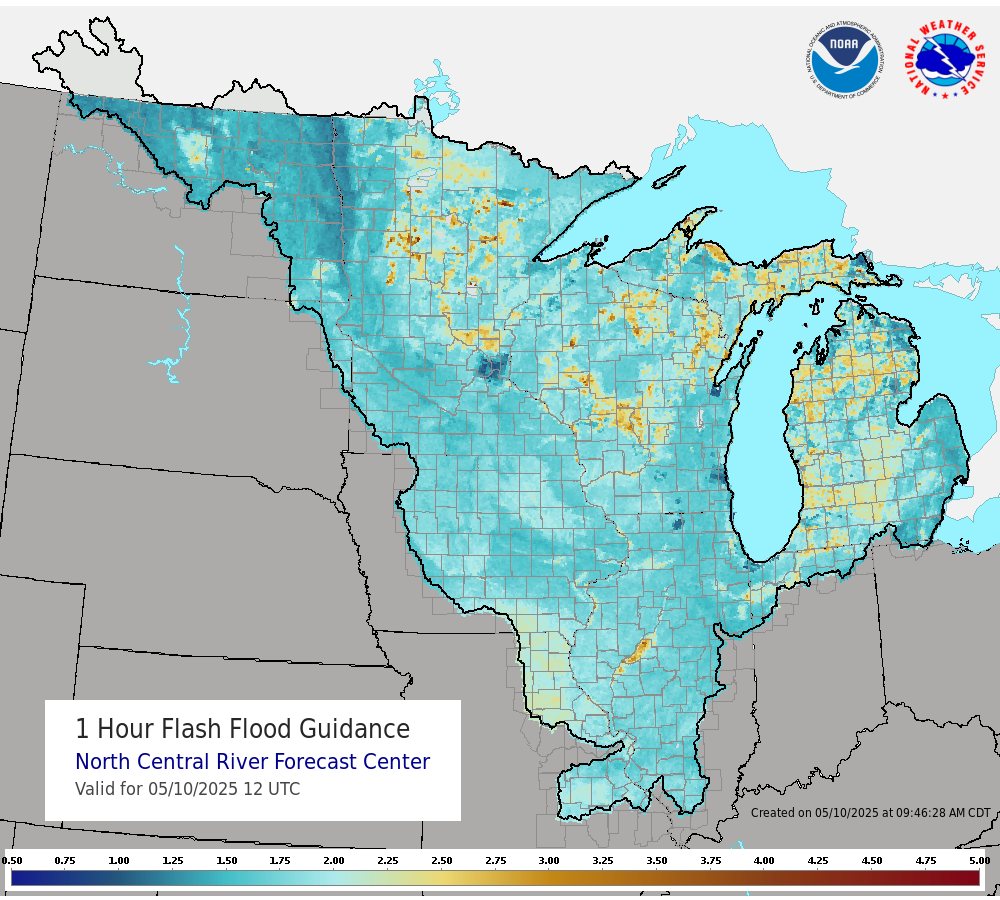
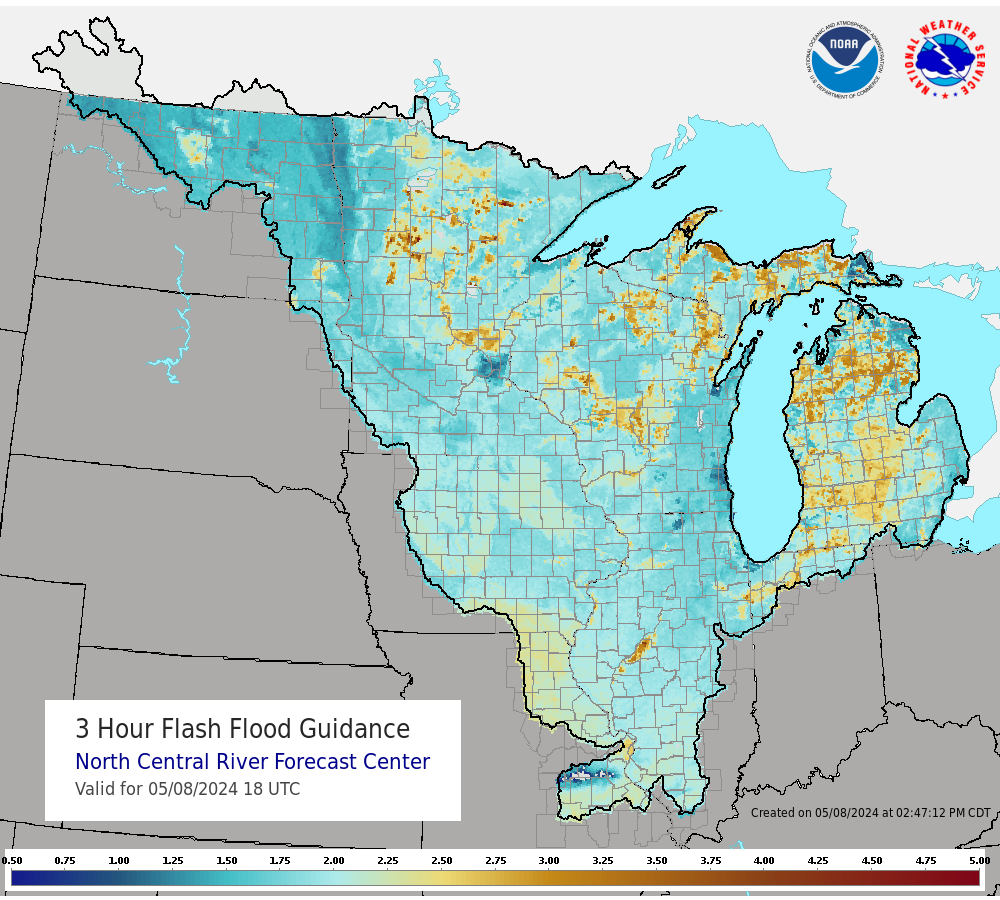
NCRFC Gridded Flash Flood Guidance (GFFG) Graphics
 |
 |
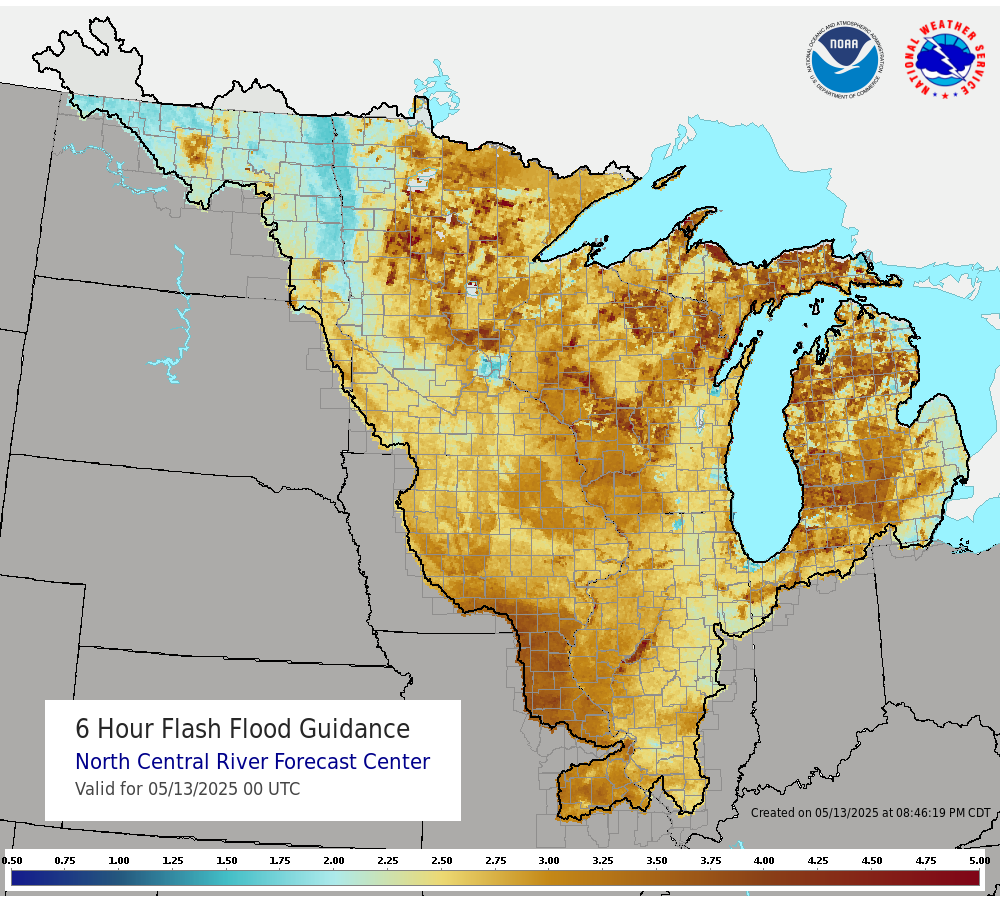 |
| NCRFC GFFG (1-hr) | NCRFC GFFG (3-hr) | NCRFC GFFG (6-hr) |
MBRFC Gridded Flash Flood Guidance (GFFG) Graphics
 |
 |
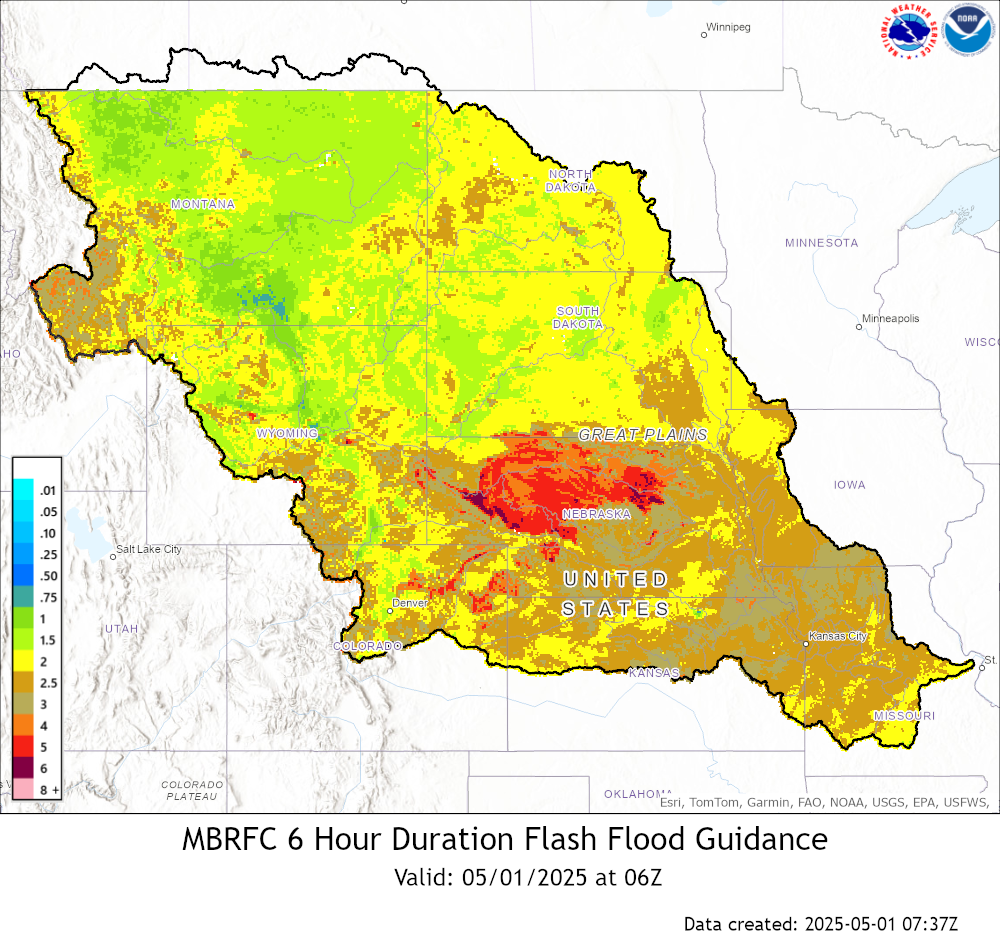 |
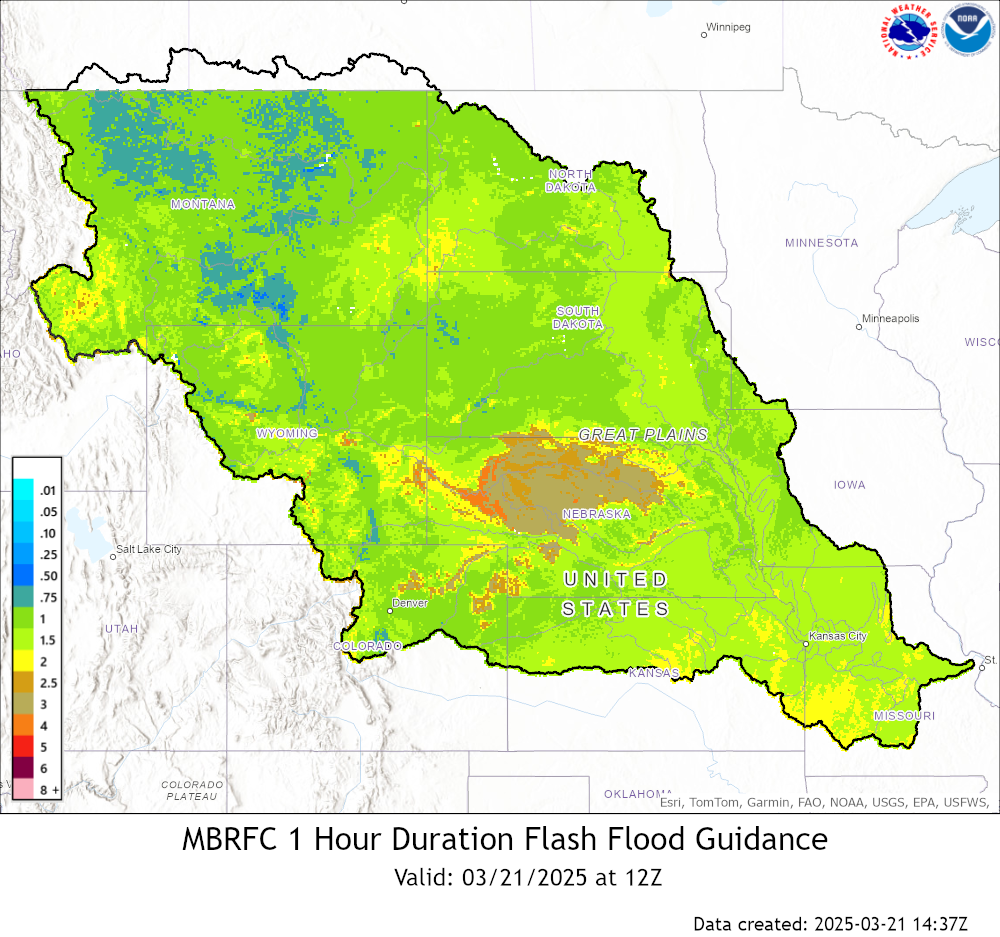
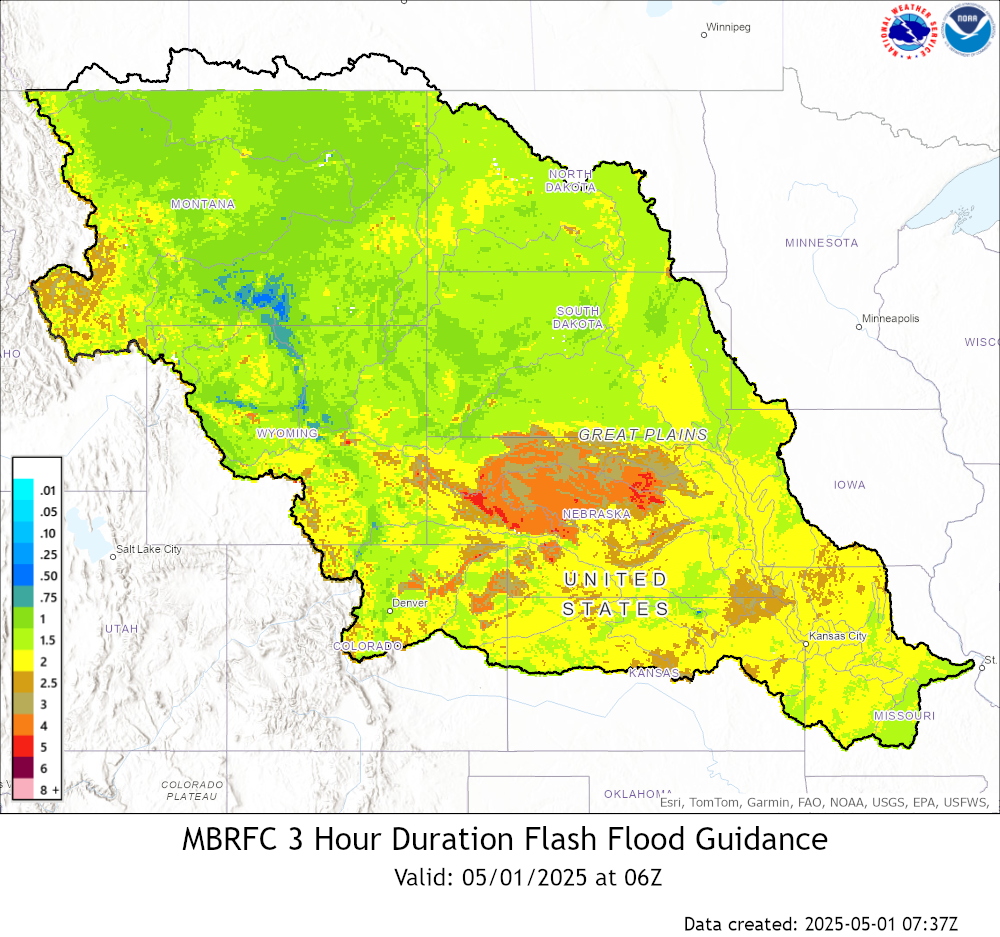
| MBRFC GFFG (1-hr) | MBRFC GFFG (3-hr) | MBRFC GFFG (6-hr) |
USGS Streamflow Graphics
 |
 |
| USGS U.S. Streamgage Streamflow Percentiles (1-Day) | USGS U.S. Hydro Region Streamflow Percentiles (1-Day) |
 |
 |
| USGS Iowa Streamgage Streamflow Percentiles (1-Day) | USGS Iowa Hydro Region Streamflow Percentiles (1-Day) |
 |
 |
| USGS Iowa Streamflow Index (1-Day) | USGS Iowa Streamflow Percent Summary (1-Day) Table of Categories/Percentages (1-Day) |
USGS Runoff Graphics
| USGS Iowa Average Runoff (1-Day) | USGS Iowa Average Runoff (7-Day) |
Color Keys
 |
 |
| Key for Percentile Classes | Key for Duration Percentile Classes |
 |
 |
 |
| Past Precip Total (1 week) | Past Precip Total (2 weeks) | Past Precip Total (1 month) |
WPC Deterministic Quantitative Precipiation Forecast (QPF) Graphics
 |
 |
 |
| Day 1 | Day 2 | Day 3 |
 |
 |
 |
| Days 1-3 | Days 1-5 | Days 1-7 |
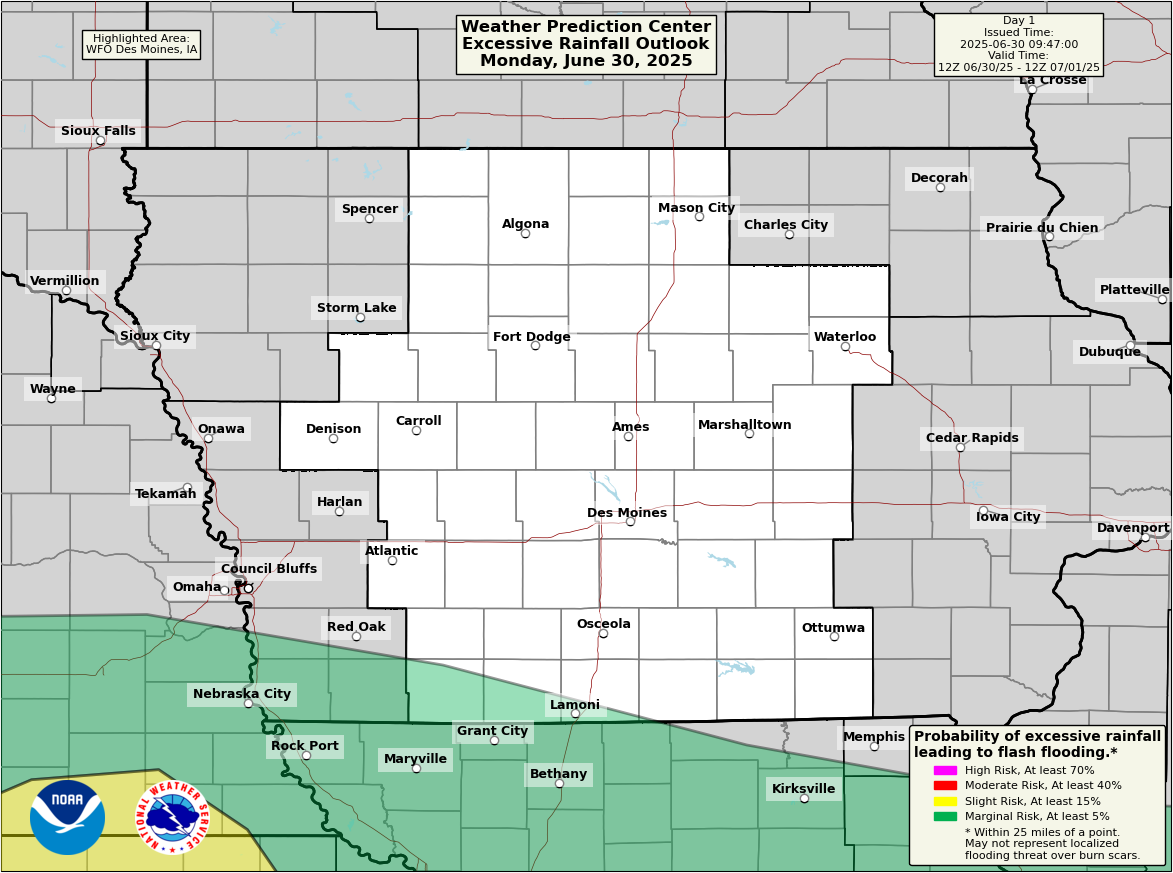
Excessive Rainfall Outlook (ERO) Graphics
 |
 |
 |
| Day 1 | Day 2 | Day 3 |
 |
 |
| Day 4 | Day 5 |
 |
 |
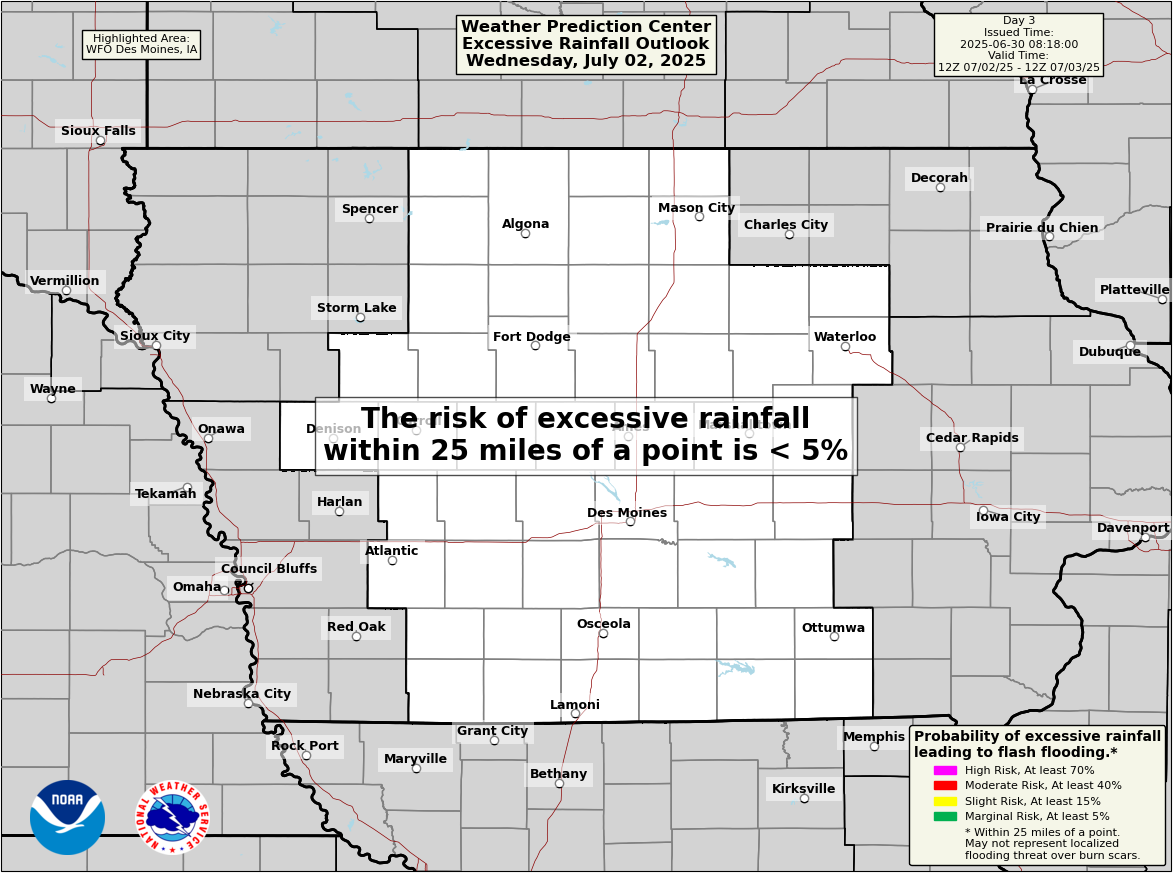 |
| Day 1 | Day 2 | Day 3 |
 |
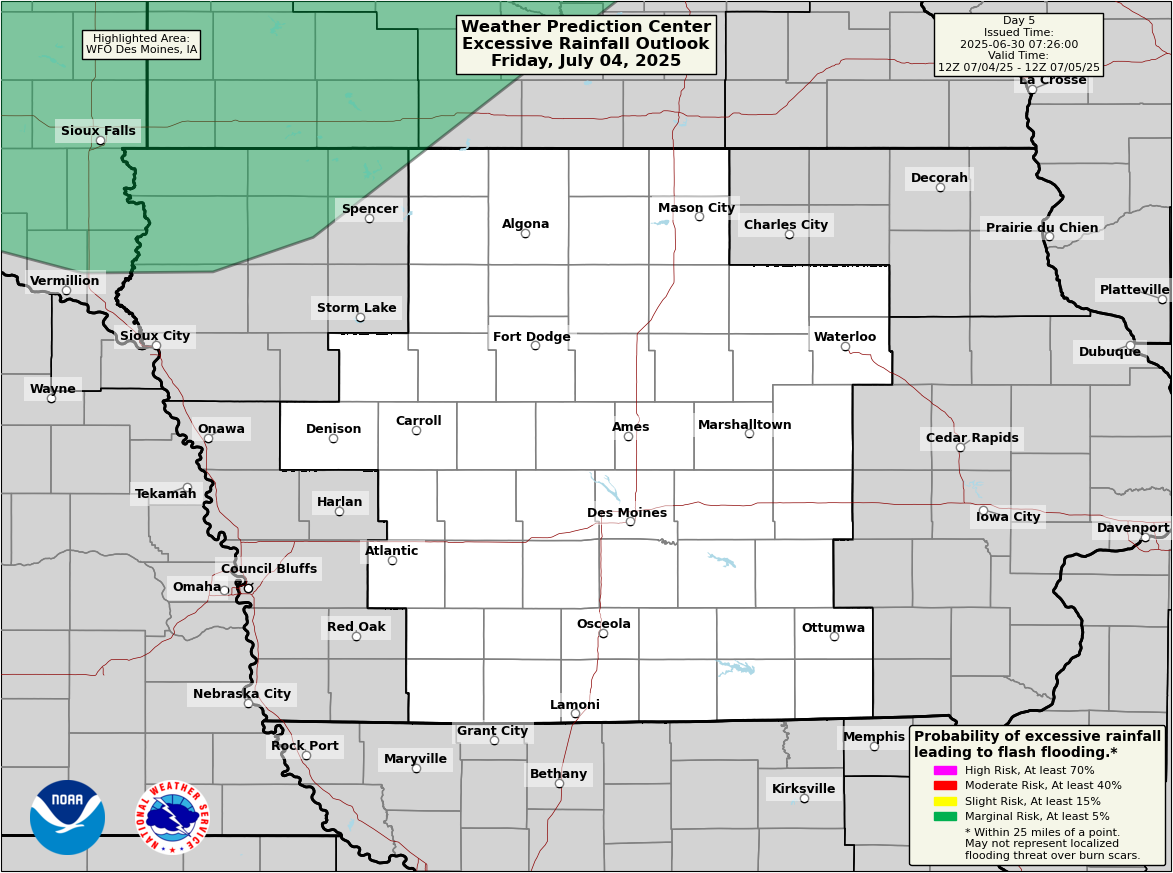 |
| Day 4 | Day 5 |
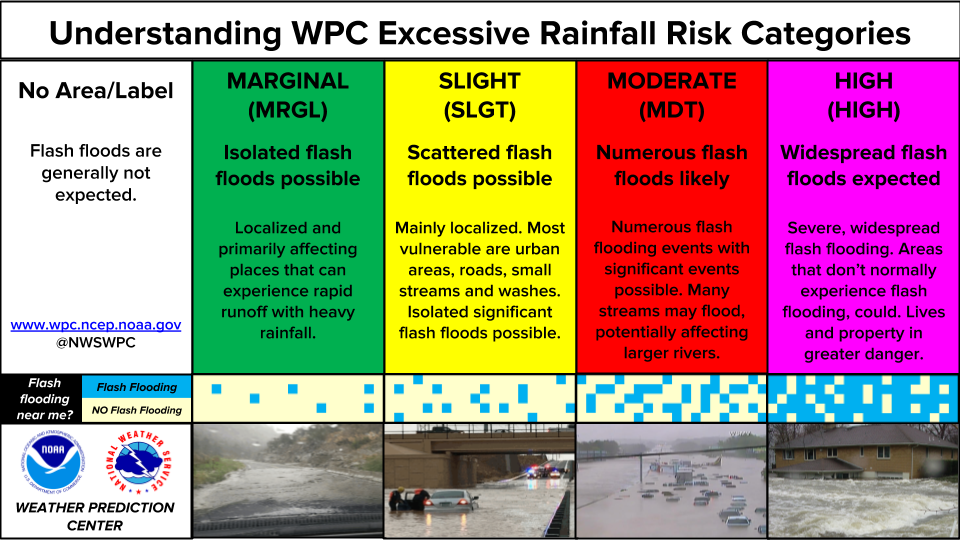 |
| ERO Category Info |
 |
 |
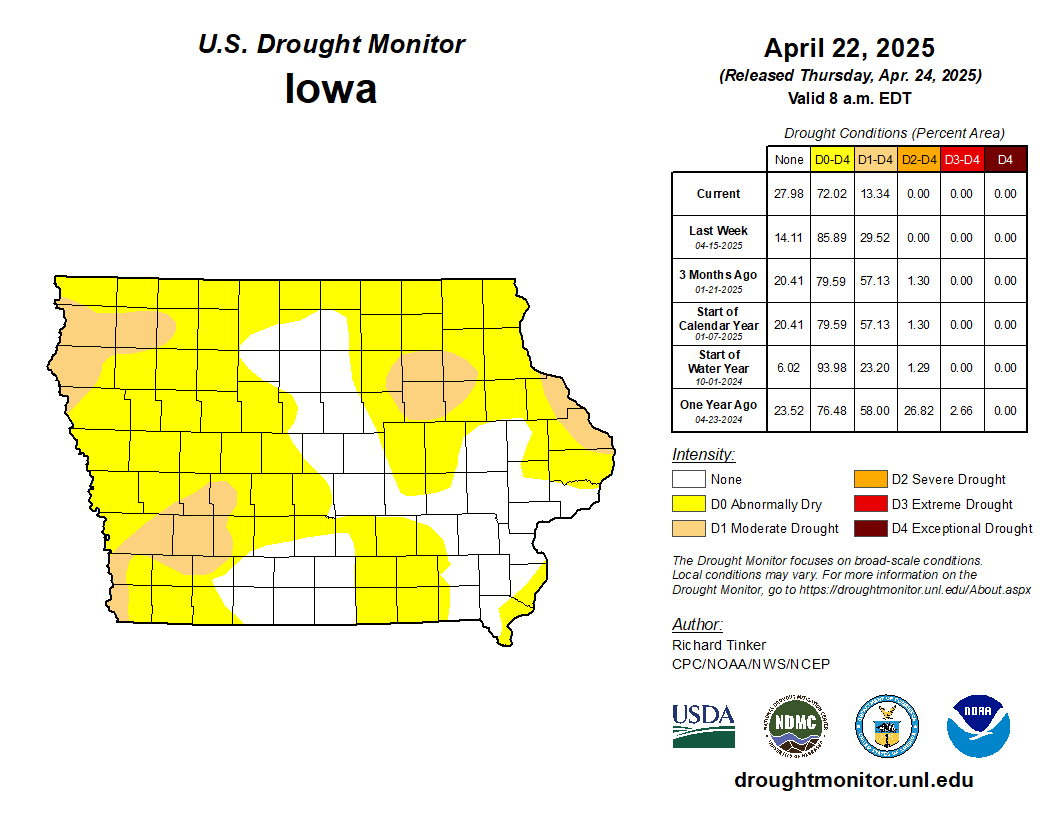 |
| Latest Drought Conditions (U.S.) | Latest Drought Conditions (CONUS) | Latest Drought Conditions (Iowa) |
 |
 |
 |
| 1-Week Change | 2-Week Change | 4-Week (1-Month) Change |
CPC Temperature & Precip Outlook Graphics
 |
 |
| 6-10 Day Outlook (Temperature) | 6-10 Day Outlook (Precipitation) |
 |
 |
| 8-14 Day Outlook (Temperature) | 8-14 Day Outlook (Precipitation) |
 |
 |
| 3-4 Week Outlook (Temperature) | 3-4 Week Outlook (Precipitation) |
 |
 |
| 1-Month Outlook (Temperature) | 1-Month Outlook (Precipitation) |
 |
 |
| 3-Month Outlook (Temperature) | 3-Month Outlook (Precipitation) |
CPC Drought Outlook Graphics
 |
 |
| U.S. Monthly Drought Outlook | U.S. Seasonal Drought Outlook |


