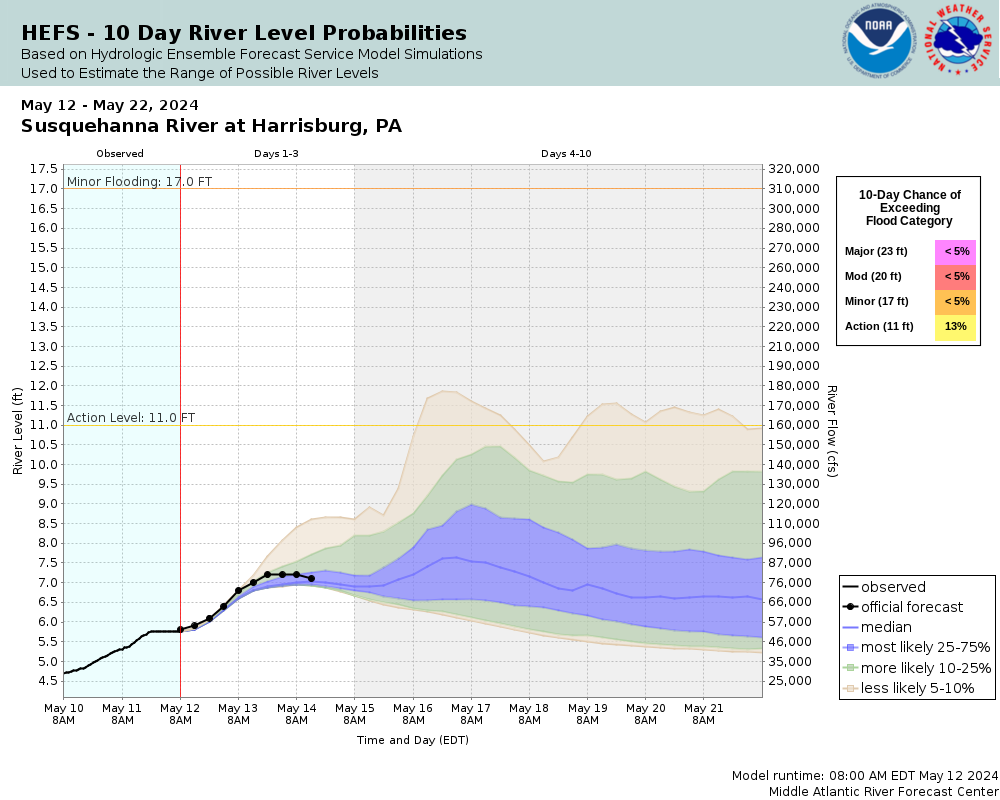
In late 2017, the Middle Atlantic River Forecast Center (MARFC) began issuing experimental short term ensemble hydrologic forecast products from the new NWS Hydrologic Ensemble Forecast Service (HEFS). The graphic that is currently being provided is a 10 day ensemble forecast. For example the current HEFS forecast for the Susquehanna River at Harrisbug PA is shown here
How do I find these graphics?
On the AHPS (Advanced Hydrologic Predictions System) page (http://water.weather.gov) for the individual forecast point, go to the probability tab, and then the option that says Short Term Probabilistic Guidance. If that option is not present or is greyed out, the HEFS forecasts are not currently available.
Are they available everywhere?
The short term ensemble graphics are currently available at about 100 of MARFC's river forecast point. That number will increase so that almost all of our forecast points will have HEFS available by the end of 2018. Most of the locations that are not available at this time are at or immediately downstream of reservoirs. Other River Forecast Centers will also be adding HEFS forecasts in the coming year or two.
How are they generated?
HEFS is using the Global Ensemble Forecast System (GEFS) as its precipitation forcing during the 10 day forecast period. A preprocessor is used to create an bias-corrected precipitation forecast for the model input. Detailed information on the science within HEFS can be found at http://journals.ametsoc.org/doi/abs/10.1175/BAMS-D-12-00081.1. Additional training on HEFS is available at https://www.meted.ucar.edu/hydro/HEFS/.
What are the different shaded areas on the plot?
How do these compare to the legacy ensemble forecasts from the Ensemble Prediction System (ESP)?
The big difference between HEFS and the legacy forecasts from ESP is that HEFS uses forcings from the atmosperic models - the GEFS model - instead of just climatology data. That is critical to having a reliable short term forecast.
How do these compare to the MMEFS forecasts?
The major difference between HEFS and MMEFS is the use of the data preprocessor in HEFS. The use of the preprocessor should produce a more reliable forecast than MMEFS. MMEFS uses raw atmospheric model information which can result in many known biases. MARFC will be conducting a comparison of the forecasts from HEFS and MMEFS in the near future.
How often are the HEFS forecasts updated?
MARFC is currently updating the HEFS forecasts on a daily basis. They should generally be updated by about 1pm EST (November - March) / 2pm EDT (March - November) every day.
How good are these forecasts?
Over the past year, we have conducted extensive validation work to ensure the reliability of these products and that they are an improvement over the legacy ESP products. The nature of atmospheric and hydrologic modeling is that there is uncertainty and the models are changing every day. There will be times that the resulting observed river levels will fall outside the bounds shown in the graphic. That is to be expected since the bounds shown in the graphic represent the 5-95% exceedance intervals. Up to 10% of the forecasts will fall outside the range. In addition, the deterministic forecast produced by the RFC will also occasionally fall outside the bounds of the ensemble due to differences in processing times and the manual quality control procedures used by the RFC forecasters.
How can these products be used?
We don't know all the ways these products can be used! Water managers and reservoir operators can use them to monitor their operations and to have an idea of the expected flows coming into their system. Emergency managers can use them as a preparation tool to get an idea of the chance of exceedance of different flood levels. Drought managers can use HEFS to see whether ongoing dry conditions will continue. They may be used to support ecological and habitat forecasts and water supply quality information.
Additional Questions?
Please send any feedback or additional questions to marfc.webmaster@noaa.gov. We are very interested in hearing your feedback and experience with HEFS

