Hurricane Threats and Impacts Graphics FAQ
Graphics are for areas subject to active tropical cyclone wind and/or storm surge watches and warnings.
What are the Hurricane Threats and Impacts (HTI) Graphics?
HTI graphics are issued by local Weather Forecast Offices (WFOs) when tropical cyclone (i.e. hurricane or tropical storm) wind watches and warnings, and/or storm surge watches and warnings, are in effect for at least part of their land area of responsibility. Once available, they are updated by respective WFOs with each new forecast issued by the National Hurricane Center (NHC) or Central Pacific Hurricane Center (CPHC) and maintained until the threats of these hazards have locally passed. Any departure in the forecast from the actual track, size, or intensity of a hurricane can dramatically change its impacts. Through the implicit use of probability data, color-coded HTI graphics depict the potential conditions to protect against with accompanying descriptions of potential impacts needed for effective preparations. The HTI graphics account for the latest forecast at specific locations while also including a reasonable safety margin to account for any forecast errors.
What hazards are described by the HTI Graphics?
Tropical wind, storm surge, flooding rain, and tornadoes are the hazards addressed within the HTI graphics suite. Figure 1 (below) offers an example of each hazard-based HTI graphic with the NHC Cone Graphic superimposed (from Hurricane Irma, 2017). Since the Cone Graphic only reveals the most probable track of the center of the storm, it provides little to no information about projected impacts. The HTI graphics, however, show the geographic extent of associated hazards; their level of threat and potential impacts. Impacts often extend well-beyond the area depicted in the Cone Graphic alone. The HTI color-scale corresponds to increasing levels of threat and is graduated from warm to hot colors.
![[Wind Threat Figure 1]](https://www.weather.gov/images/srh/tropical/hti_WindThreat_example.png) |
![[Surge Threat Figure 1]](https://www.weather.gov/images/srh/tropical/hti_SurgeThreat_example.png) |
![[FloodingRain Threat Figure 1]](https://www.weather.gov/images/srh/tropical/hti_FloodingRainThreat_example.png) |
![[Tornado Threat Figure 1]](https://www.weather.gov/images/srh/tropical/hti_TornadoThreat_example.png) |
| Figure 1. Example of HTI Graphics for the tropical wind, storm surge, flooding rain, and tornado hazards (left to right) from Hurricane Irma (2017). |
Examining the wind graphic (above; left), locations colored in purple have the potential to experience winds greater than 110 mph when accounting for both the forecast and forecast error. It is not a mere depiction of forecast conditions to be expected. Rather, it indicates that these locations should be ready for winds in excess of 110 mph, when taking into account the latest forecast and knowing that (although skilled) the forecast isn't perfect. Simply put, locations in purple are being threatened by major hurricane force winds greater than 110 mph (at least Category 3 force), locations in red are being threatened by hurricane force winds between 74-110 mph (Category 1 or 2 force), and so on. A similar approach is used for depicting each of the remaining hazards. HTI is designed to help make preparedness actions more effective. For additional information about hurricane preparedness, please see ready.gov/hurricanes and always follow the recommended actions of local officials during an event.
How do I access the HTI Graphics webpage when my area is threatened?
The HTI Graphics suite can be accessed using the following web portal: weather.gov/srh/tropical
It can also be accessed from most coastal WFO websites via weather.gov by clicking on a region of interest. The links will be made readily accessible from most WFO front pages during active hurricane or tropical storm events.
When you reach this portal, you will see the following tabs across the top of the page:
![[Figure 2]](https://www.weather.gov/images/srh/tropical/hti_fig2.png) |
| Figure 2. A screenshot of the tabs available at the top of the tropical web portal when tropical cyclone wind or storm surge watches and/or warning are in effect. |
Click on the Threats and Impacts tab to display HTI information similar to what is shown below on the left side of Figure 3. By default, the wind hazard is initially displayed, but users can quickly select any of the radio buttons just above the graphic to retrieve information on other hazards of interest.
![[Figure 3]](https://www.weather.gov/images/srh/tropical/hti_fig3.png) |
| Figure 3. A breakdown of the graphical information provided on the tropical web portal when tropical cyclone wind or storm surge watches and/or warnings are in effect. |
- Select a hazard in order to display the corresponding threat map as assessed by the local WFO. A color-coded legend unique to each hazard is also provided. The map conveys what potential conditions to protect against by location, accounting for both the latest forecast and forecast error for improved readiness, responsiveness, and resiliency.
- For safety-sake, it provides a depiction of a reasonable worst case scenario.
- Once a threat map is displayed, click a map location to obtain current information on that hazard for the desired site and its vicinity. Information is extracted from local text products and displayed to the right of the map.
- Location-specific forecast parameters per hazard include what, where, when, how much, and how long.
- By clicking on a map location, users also obtain descriptions of potential impacts. These are the resulting impacts which would likely occur if the hazard were realized to its graphically depicted potential. Text descriptions are derived locally, often with input from Emergency Managers. Pop-ups are placed over the map near the selected location.
- This makes threat information more relatable for users by conveying what potential impacts to prepare for.
- Remember, the map is not a forecast map for the selected hazard. Rather, it is a depiction of the forecast with a safety margin included. Consequently, text information that describes the latest forecast (without accounting for forecast error) on the right of the map may or may not match the map on the left (which does account for forecast error).
- HTI can also be accessed in the National Digital Forecast Database webpage here: https://digital.weather.gov/
- Under the listing of the Tropical elements in the top left drop down menu, select the "hurricane threat" grid for the desired hazard. There, you will see the threat levels depicted as you would above; click on any given point to sample the threat level for that location. These versions will only be available through the NDFD.
- The HTI Product Description Document (PDD) can be found here: https://www.weather.gov/media/srh/tropical/PDD_HTI.pdf


 > 1 ft above ground
 > 3 ft above ground
 > 6 ft above ground
 > 9 ft above ground


.png) Surf Forecast/Rip Currents
Surf Forecast/Rip Currents Tropical Weather
 Map View
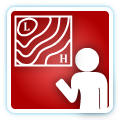 Weather Hazard Briefing (when applicable)
 Forecaster Discussion
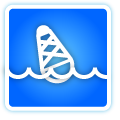 Marine
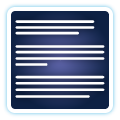 Text Products
.png) Skywarn
Skywarn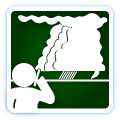 Submit Storm Reports
Social Media