|
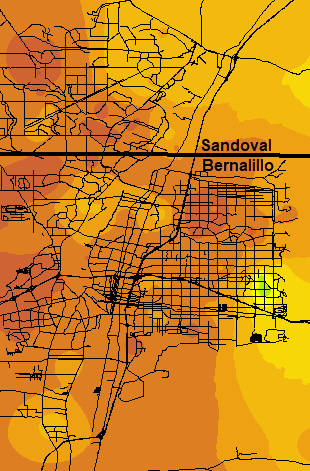
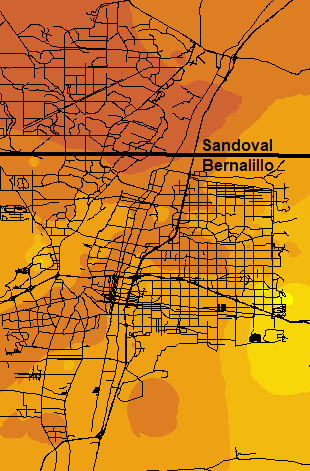
Sorry, Rio Rancho! You folks really missed out this August! Since the only official stations are the Albuquerque Sunport and a handful of cooperative observers for the Weather Service, dedicated members of the Community Collaborative Rain, Hail and Snow (CoCoRaHS) Network help fill in the gaps across Albuquerque. Below are two maps showing the distribution of precipitation across Albuquerque for August 2016 and August 2017. Remember, if you feel your area is not represented well on these maps, get yourself a rain gage and sign up for CoCoRaHS! The more observers, the better!
|
|||||||||
 |
 |
Legend
|
|||||||
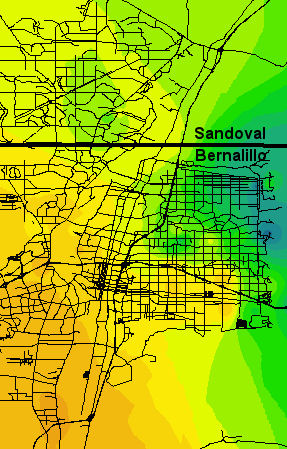
| August 2016 | August 2017 | ||||||||
|
One glaring similarity on the August 2016 and 2017 images is noted across southeast Albuquerque near and north of Four Hills. Both last year and this year, this area was the big winner for precipitation. However, also like last year, much of this precipitation fell during one storm! On the evening of August 4th, 2016, areas near and just north of Four Hills received between two and two and a half inches of rain. Remarkably, only minor street flooding was observed. This August, the amounts were not quite as high, but between 0.75 and 1.5 inches of rain fell during the evening of August 29th. The rest of the precipitation in this area generally fell in half inch chunks, notably on the 4th, 11th and 23rd. Perhaps one of the most glaring differences is noted across northern Rio Rancho and Corrales. In 2016, these areas averaged around 2 to 2.5 inches of rainfall, while this year, nearly all of Rio Rancho and Corrales only received between 0.5 and 1 inch of rain! Meanwhile, areas across the westside saw similar amounts of rainfall, though where the highest amounts occurred varied a bit. Larger rainfall events on the westside were on the 11th, 14th and 21st. |
|||||||||
|
In contrast, here's a look back at 2006. Using the same scale as the images above, August 2006 was literally "off the scale" in some portions of the Metro area. |
 |
Legend
|
||||||||||||||||||||||||||||||||||||
| August 2006 | ||||||||||||||||||||||||||||||||||||||
| Normal August precipitation at the Albuquerque Sunport is 1.58 inches. This August, the Sunport received 1.49 inches of rain. In August of 2016, the Sunport received 0.86 inches. If you recall, in August of 2015, the Sunport only received 0.32 inches of precipitation, so at least we are trending upward! Below are tables for the wettest and driest August's on record since 1897. | ||||||||||||||||||||||||||||||||||||||
|
||||||||||||||||||||||||||||||||||||||
| To see how July 2016 and July 2017 compared, click here. | ||||||||||||||||||||||||||||||||||||||